

Note: This report includes forecasting data that is based on baseline historical data.
Executive summary
Canada's population at an estimate of 38.9 million in 2023, has historically increased by a compound annual growth rate (CAGR) of 1.2% over the last decade (2013 to 2023), and is expected to slow in growth by 0.7% over the forecast period (2023 to 2033) - despite a high increase in immigrants welcomed to the country until 2025. The country's urban population at 32.4 million in 2023, which has increased by a CAGR of 1.3% (2018 to 2023) is forecast to remain relatively stable over the next 10 years (+0.9%); reaching a total of 35.8 million, accounting for 83.4% of the country's total population in 2033.
The top 10 largest urban cities in Canada accounted for just shy of half of the population (48.1%) in 2023. Toronto is the biggest city at approximately 6.0 million people, followed by Montréal (4.0 million) and Vancouver (2.6 million) over the year.
Canada was the 10th largest global exporter of processed or value-added packaged agri-food and seafood products at exports of Can$48.0 billion, representing a trade surplus of Can$14.0 billion with imports from the world at Can$34.0 billion in 2022. The top five exported commodities in 2022, were bread and bakery products, low erucic acid canola oil (excluding crude), and fresh or chilled bovine meat (boneless) with total exports of value-added agri-food and seafood growing by a CAGR of 10.4% (2018 to 2022).
In 2023, retail sales of packaged food in Canada totaled Can$77.6 billion in current prices. Top categories with the highest sales included dairy (Can$16.6 billion), baked goods (Can$11.2 billion), and meals and soups (Can$9.1 billion). Common trends within all packaged food categories are focused around products that target the 'healthy-consciousness' consumer that consist of natural, fortified or functional ingredients. Plant-based or high in protein products are becoming high in demand, as well.
Price-sensitivity is of utmost importance, as food inflation in the country reached an all-time high in early 2023, and of which is expected to remain high for the unforeseeable future. Convenience, intriguing or culturally-inspired offerings are key factors to help maintain high demand and interest in the food or drink industry. E-commerce platforms have played a vital role in supporting retailers during lockdown periods, which have continued to gain a much higher retailer market share amongst all distribution channels in recent years.
Consumer profile
"Canada's population is projected to experience a substantial growth, driven by the government's ambitious immigration targets, aimed at welcoming 500,000 immigrant's annually until 2025.Footnote 1".
In 2022, Canada's population reached 38.9 million and has grew at a slow rate by a CAGR of 1.2% over the last decade (2013-2023). This population consisted of approximately 7.3 million of children under the age of 17, 14.2 million of young and middle youth adults (aged 18-44), 10.1 million of mid-lifers (aged 45-64), and 7.3 million of later lifers and seniors (aged 65+) in 2022. Canada's urban population accounted for 81.7% with the remainder 18.3% of the population residing in rural regions over last year.
Toronto has the largest urban population at 5.9 million people, accounting for 15.2% of the total population throughout Canada, followed by Montreal (10.1%), Vancouver (6.7%), Calgary (3.5%), and Edmonton (3.1%) in 2022. Out of the ten most populated urban regions in Canada, the National capital region (Ottawa - Gatineau) accounting for 2.7% of the total population in 2022, and is expected to increase at one of the highest CAGR by 1.0% (2022-2032) - along with a higher population growth in London - Ontario (1.2%) and Vancouver (1.0%).
Rank | Cities | Population ('000) in 2022 | Population ('000) in 2023 | Population ('000) in 2032 | CAGR* % 2022-2032 |
|---|---|---|---|---|---|
Total - rural population | 7,106.2 | 7,186.5 | 7,137.0 | 0.04 | |
Total - urban population | 31,823.7 | 32,422.4 | 35,436.8 | 1.1 | |
1 | Toronto | 5,908.0 | 5,951.3 | 6,398.9 | 0.7 |
2 | Montreal | 3,943.7 | 3,972.6 | 4,270.5 | 0.7 |
3 | Vancouver | 2,593.0 | 2,624.4 | 2,888.5 | 1.0 |
4 | Calgary | 1,362.1 | 1,372.4 | 1,477.2 | 0.7 |
5 | Edmonton | 1,204.6 | 1,216.4 | 1,323.9 | 0.9 |
6 | Ottawa - Gatineau | 1,069.6 | 1,083.2 | 1,195.6 | 1.0 |
7 | Hamilton | 792.1 | 799.4 | 867.3 | 0.8 |
8 | Winnipeg | 783.6 | 790.5 | 856.3 | 0.8 |
9 | Quebec | 776.2 | 781.3 | 836.4 | 0.7 |
10 | London - Ontario | 443.6 | 450.9 | 506.5 | 1.2 |
Subtotal - urban population (top 10) | 18,876.5 | 19,042.4 | 20,621.1 | 0.8 | |
Total - Canadian population | 38,929.9 | 39,608.9 | 42,888.5 | 0.9 | |
Source: Euromonitor International, 2023 *CAGR: Compound Annual Growth Rate | |||||
In 2022, out of approximately 15.3 million households, Canada's average household size was 2.5 persons with an average of 0.5 children per household. Single persons represented the largest demographic by 29.5%, followed by couples without children (25.6%), couples with children (25.1%), other blended families (11.1%), and single-parent families (8.7%). Home owners accounted for 63.9% of the population and 34.6% were renters living in apartments in 2022.
The median age of population was 41.0 in Canada in 2022. In Canada, the average gross income of population (aged 15+) was Can$66,952.1 with an annual median disposable income per household of Can$76,637.2 in 2022. The total Canadian average gross income was the lowest at Can$27,172.9 of population (aged 15-19) and on average peaked at Can$86,972.8 of population (aged 45-49). In Canada, middle class households consisted of 32.1% of the population. Out of a workforce of 84.4% of the total population (32.9 million people) in 2022, Canadians (Social Class C) bringing in a salary between (100-150%) of the average gross income (up to Can$100,428.2) accounted for 21.2% of the population, while 32.1% (Social Class D) made between (50-100% avg. income), and 26.5% (Social Class E) made less than 50% of average salary per year (<Can$33,476.1). On the upper end, 11.3% (Social Class B) of the population made a salary between (150-200% avg. income) and 8.8% of the population (Social Class A) made over 200% of average salary per year (>Can$133,904.2).
Exports
Canada was the 10th largest exporter of value-added processed packaged food and seafood products at a total value of Can$48.0 billion and a global market share of 3.6% in 2022. Canada is a net exporter of processed agri-food and seafood products with 2022 imports from the world at Can$34.0 billion, representing a trade surplus of Can$14.0 billion.
Canada's processed agri-food and seafood exports increased by a CAGR of 10.4% between 2018 and 2022. The top five exported commodities in 2022 at a total of Can$16.1 billion (33.4%) were bread and bakery products at Can$4.4 billion (9.1%), low erucic acid canola oil, excluding crude at Can$4.3 billion (8.9%), fresh or chilled bovine meat, boneless at Can$2.8 billion (5.9%), canola meal at Can$2.5 billion (5.2%), and Frozen French fries at Can$2.1 billion (4.3%). Key exporter countries over last year were the United States (Can$37.4 billion), China (Can$2.4 billion), Japan (Can$2.1 billion), Mexico (Can$1.4 billion), and the European Union (Can$931.6 million).
Retail sales - packaged food
In 2023, retail sales of packaged food products in Canada totalled Can$77.6 billion. Top categories with the highest sales included dairy (Can$16.6 billion), baked goods (Can$11.2 billion), meals and soups (Can$9.1 billion), and within the snacks category was savoury snacks (Can$6.6 billion). Albeit, categories that registered the highest 5-year compound annual growth rates (2018-2023) were plant-based dairy (9.4%) and edible oils (9.0%).
All packaged food categories, overall managed to recover during the post-COVID-19 period and registered moderate positive CAGRs between 2018 and 2023. Nevertheless, all categories are expected to slow down in growth mostly contributable to fluctuations in price hikes - at the exception of the baby food category, predicted to rebound once both manufacturers and the government works collaboratively together to address previous global supply chain challenges. Additionally, as Canadians return physically back to work and socialize in public more, snacks such as ice cream (CAGR: 6.3%), confectionery (5.5%), and sweet biscuits, snack bars and fruit snacks (4.3%) are forecast to grow (2023-2028) over historic values.
Category | 2018 | 2023 | CAGR* % 2018-2023 | 2024 | 2028 | CAGR* % 2023-2028 |
|---|---|---|---|---|---|---|
Total - packaged foods | 58,461.1 | 77,578.3 | 5.8 | 80,861.7 | 97,401.1 | 4.7 |
Cooking ingredients and meals | 11,358.0 | 15,551.8 | 6.5 | 16,297.6 | 20,595.6 | 5.8 |
Edible oils | 489.7 | 752.4 | 9.0 | 774.4 | 897.3 | 3.6 |
Meals and soups | 6,488.1 | 9,147.9 | 7.1 | 9,631.4 | 12,674.9 | 6.7 |
Sauces, dips and condiments | 3,637.8 | 4,686.9 | 5.2 | 4,902.4 | 5,876.4 | 4.6 |
Sweet spreads | 742.4 | 964.5 | 5.4 | 989.5 | 1,146.9 | 3.5 |
Dairy products and alternatives | 14,068.1 | 18,044.3 | 5.1 | 18,939.4 | 22,870.7 | 4.9 |
Baby food | 641.6 | 704.6 | 1.9 | 720.7 | 826.2 | 3.2 |
Dairy | 12,974.1 | 16,630.5 | 5.1 | 17,457.9 | 21,033.5 | 4.8 |
Plant-based dairy | 452.4 | 709.3 | 9.4 | 760.8 | 1,011.0 | 7.3 |
Staple Foods | 19,644.7 | 26,331.3 | 6.0 | 26,930.4 | 30,614.5 | 3.1 |
Baked goods | 7,985.1 | 11,199.3 | 7.0 | 11,504.2 | 13,082.6 | 3.2 |
Breakfast cereals | 1,377.1 | 1,700.2 | 4.3 | 1,719.9 | 1,839.3 | 1.6 |
Processed fruit and vegetables | 2,119.4 | 2,812.5 | 5.8 | 2,854.1 | 3,241.1 | 2.9 |
Processed meat, seafood and alternatives | 6,644.7 | 8,516.2 | 5.1 | 8,709.2 | 9,938.0 | 3.1 |
Rice, pasta and noodles | 1,518.4 | 2,103.2 | 6.7 | 2,143.1 | 2,513.5 | 3.6 |
Snacks | 13,390.3 | 17,650.9 | 5.7 | 18,694.3 | 23,320.3 | 5.7 |
Confectionery | 4,544.8 | 5,866.0 | 5.2 | 6,223.9 | 7,666.6 | 5.5 |
Ice cream | 1,553.2 | 2,071.9 | 5.9 | 2,198.1 | 2,813.5 | 6.3 |
Savoury snacks | 4,759.8 | 6,620.1 | 6.8 | 7,034.0 | 9,014.9 | 6.4 |
Sweet biscuits, snack bars and fruit snacks | 2,532.5 | 3,092.9 | 4.1 | 3,238.3 | 3,825.3 | 4.3 |
Source: Euromonitor International, 2023 *CAGR: Compound Annual Growth Rate | ||||||
In 2023, leading retail companies (and top brands) in the packaged food category in Canada included Saputo Inc. (Dairyland, Neilson, Saputo) at a value of Can$3.6 billion and a 4.6% value share, PepsiCo Inc. (Tostitos, Quaker, Harvest Crunch) at Can$3.3 billion (4.3%), and the Kraft Heinz Company (Kraft, Heinz, Classico) at Can$3.2 billion (4.2%). Private labelled brands accounted for 13.0% at sales of Can$10.1 billion, with artisanal companies accounting for 5.0% (Can$3.8 billion) in 2023.
Company | Top brand(s) | Retail sales value (Can$ million) | Market share % |
|---|---|---|---|
Total - market share | 77,578.3 | 100.0 | |
Saputo Inc. | Dairyland, Neilson, Saputo, Armstrong, Alexis de Portneuf, Stella, Nutrilait, Fraser Valley, Milk 2 Go, JOYYA, Vachon | 3,600.6 | 4.6 |
PepsiCo Inc. | Tostitos, Quaker, Harvest Crunch, Lay's, Doritos, Ruffles, Miss Vickie's, Smartfood, Fritos, Rold Gold, Stacy's Pita Chips, Twistos, Hickory Sticks, Cheetos, Crispy Minis, Cracker Jack, Chester's | 3,300.7 | 4.3 |
Kraft Heinz Company | Kraft, Heinz, Classico, Crave, Philadelphia, Miracle Whip, Catelli, HP, Renée's, Bull's Eye, Diana Sauce | 3,240.8 | 4.2 |
Lactalis, Groupe | Lactancia, Beatrice, Black Diamond, Iögo, Cracker Barrel, Astro, P'tit Quebec, Balderson, Cheez Whiz, Olympic, AMOOza!, Astro BioBest | 3,218.9 | 4.1 |
Agropur Co-operative Agro-Alimentaire | Sealtest, L'Extra, Natrel, Quebon, OKA | 2,596.2 | 3.3 |
Maple Leaf Foods Inc. | Schneiders, Maple Leaf, Maple Lodge, Lightlife | 2,324.8 | 3.0 |
Mondelez International Inc. | Cadbury (Dairy Milk), Ritz, Oreo, Premium, Halls, Chips Ahoy!, Trident/Dirol, Dentyne, Christie, Wheat Thins, Triscuit, Petit Beurre, Stride, Jet-Puffed, Toblerone, Clif, Peak Freans, Petit Ecolier, Maynard's, Trebor | 1,917.0 | 2.5 |
Grupo Bimbo SAB de CV | Demptster's, Vachon, Stonemill | 1,674.9 | 2.2 |
Danone, Groupe | Activia, Danone, Silk, Actimel, International Delight, Danino | 1,248.0 | 1.6 |
Nestlé SA | Stouffer's, Delissio, Market Place Cuisine, Coffee-mate, Gerber, Nestlé, Kit Kat, Drumstick, Coffee Crisp, Favourites, Smarties, Good North, Aero, Parlour, Polar, Black Magic, After Eight, Real Dairy, Sundae | 1,235.2 | 1.6 |
Private label | Private label | 10,061.6 | 13.0 |
Artisanal | Artisanal | 3,846.5 | 5.0 |
Others | Others | 13,764.0 | 17.7 |
Subtotal - top ten companies | 52,029.2 | 67.1 | |
Source: Euromonitor, 2023 | |||
Dairy products and alternatives
Retail sales
In 2023, dairy in Canada totalled Can$16.6 billion or 92.2% of the dairy products and alternatives category, growing by a CAGR of 5.1% between 2018 and 2023. Cheese was the largest subsector within the dairy category increasing to Can$6.8 billion (41.2%), followed by drinking milk products dropping to Can$3.2 billion (19.2%), yoghurt and sour milk products increasing to Can$2.7 billion (16.0%), and butter and spreads increasing to Can$2.0 billion (12.0%) in 2023.
With the Canadian landscape registering its highest levels of inflation in recent years, marking notable food price increases that reached unprecedented heights in 2022 and into 2023, dairy products and alternatives were substantially hit with butter and spreads, as well as baby food, leading in terms of price escalation. As a result, many Canadian consumers looked for more affordable options like private label offerings, despite seeing a slight decline in prices in 2023.Footnote 1
While there was a decrease in drinking milk products from 2022 to 2023 (−3.4%), plant-based dairy has sustained its growth forecast into 2023. Trends in plant-based 'beyond milk alternatives' (alongside meat alternatives) have continued to gain traction, whereby plant-based cheese and yoghurt have also, expanded and have both experienced rapid growth. Many plant-based dairy players are vying for a competitive edge with the introduction of new product development innovations helping to expand the category, which in turn offers consumers an array of choices that are becoming more readily available in smaller grocery stores to larger establishments. Innovations in other dairy products are being introduced in efforts to re-engage consumers and inject novelty into well-established product segments such as offerings of immune-supportive and vitamin-enriched drinking yoghurt, shredded cheese with bacon, and the launch of butter balls. As the health-conscious trend is magnified more so post-COVID-19, manufacturers are aiming to steer away from high sugar content and are embracing healthier alternatives like higher fat butter and full-fat products, along with prioritizing clean labelling.Footnote 1
During the forecast period (2023-2028) in Canada, the dairy is expected to slightly slow down in overall value growth by a CAGR of 4.8%, which is largely attributed to price increases. Nevertheless, once inflation is actively brought under control, plant-based dairy and the dairy and dairy alternatives category as a whole is set for expansion, bolstered by sustained demand characterised by varying consumer preferences and the continued diversification of product offerings.Footnote 1
Category | 2018 | 2019 | 2020 | 2021 | 2022 | 2023 |
|---|---|---|---|---|---|---|
Total - dairy | 12,974.1 | 13,199.0 | 14,463.6 | 14,680.1 | 15,660.9 | 16,630.5 |
Butter and spreads | 1,307.6 | 1,327.7 | 1,463.1 | 1,503.2 | 1,746.6 | 1,992.5 |
Cheese | 4,776.6 | 4,921.0 | 5,556.2 | 5,886.2 | 6,333.2 | 6,849.9 |
Drinking milk products | 3,383.4 | 3,414.9 | 3,616.5 | 3,365.7 | 3,313.1 | 3,200.8 |
Yoghurt and sour milk products | 2,107.0 | 2,087.8 | 2,212.8 | 2,275.8 | 2,469.8 | 2,653.5 |
Other dairy | 1,399.5 | 1,447.5 | 1,614.9 | 1,649.3 | 1,798.1 | 1,933.7 |
Source: Euromonitor International, 2023 | ||||||
Category | Annual growth % 2023/2022 | CAGR* % 2018-2023 | Total growth % 2018-2023 |
|---|---|---|---|
Total - dairy | 6.2 | 5.1 | 28.2 |
Butter and spreads | 14.1 | 8.8 | 52.4 |
Cheese | 8.2 | 7.5 | 43.4 |
Drinking milk products | −3.4 | −1.1 | −5.4 |
Yoghurt and sour milk products | 7.4 | 4.7 | 25.9 |
Other dairy | 7.5 | 6.7 | 38.2 |
Source: Euromonitor International, 2023 *CAGR: Compound Annual Growth Rate | |||
Category | 2023 | 2024 | 2025 | 2026 | 2027 | 2028 |
|---|---|---|---|---|---|---|
Total - dairy | 16,630.5 | 17,457.9 | 18,295.7 | 19,170.3 | 20,083.4 | 21,033.5 |
Butter and spreads | 1,992.5 | 2,098.9 | 2,190.5 | 2,283.0 | 2,377.9 | 2,480.3 |
Cheese | 6,849.9 | 7,310.6 | 7,749.2 | 8,193.6 | 8,648.0 | 9,111.2 |
Drinking milk products | 3,200.8 | 3,211.6 | 3,268.3 | 3,336.0 | 3,409.0 | 3,486.2 |
Yoghurt and sour milk products | 2,653.5 | 2,792.0 | 2,934.8 | 3,092.9 | 3,267.9 | 3,458.7 |
Other dairy | 1,933.7 | 2,044.8 | 2,152.8 | 2,264.9 | 2,380.6 | 2,497.1 |
Source: Euromonitor International, 2023 *CAGR: Compound Annual Growth Rate | ||||||
Category | Annual growth % 2024/2023 | CAGR* % 2023-2028 | Total growth % 2023-2028 |
|---|---|---|---|
Total - dairy | 5.0 | 4.8 | 26.5 |
Butter and spreads | 5.3 | 4.5 | 24.5 |
Cheese | 6.7 | 5.9 | 33.0 |
Drinking milk products | 0.3 | 1.7 | 8.9 |
Yoghurt and sour milk products | 5.2 | 5.4 | 30.3 |
Other dairy | 5.7 | 5.2 | 29.1 |
Source: Euromonitor International, 2023 *CAGR: Compound Annual Growth Rate | |||
Competitive landscape - dairy
In 2023, leading retail companies (top brands) in the Canadian dairy category included Saputo Inc. (Dairyland, Neilson, Saputo) at a value of Can$3.6 billion (21.7%), The Lactalis Groupe (Lactantia, Beatrice, Black Diamond) at Can$3.2 billion (19.3%), and Agropur Co-operative Agro-Alimentaire (L'Extra, Natrel, Quebon) at Can$2.6 billion (15.5%). Private labelled dairy brands accounted for Can$1.3 billion (15.5%) of sales in 2023.
A noteworthy change within the dairy competitive landscape was Nestlé's divestiture to Perrigo Inc. of the Good Start baby milk formula brand, where Nestlé previously has been a significant player in this market. Additionally, Lactalis' Canada acquired Khaas, a specialty yogurt brand. Notable innovations by prominent brands in the growth of plant-based milk, cheese and yogurt alternatives categories include Danone's Silk (Nextmilk), Vitalite, Babybel, Two Bears, Yoggu, and Becel.Footnote 1
Company | Top brand(s) | Retail sales (US$ million) | Market share % in 2023 |
|---|---|---|---|
Saputo Inc. | Dairyland, Neilson, Saputo, Armstrong, Alex de Portneuf, Stella, Nutrilait, Fraser Valley, Milk 2 Go, JOYYA | 3,600.6 | 21.7 |
Lactalis, Groupe | Lactantia, Beatrice, Black Diamond, Iögo, Cracker Barrel, Astro, P'tit Quebec, Balderson, Cheez Whiz, Olympic, aMOOza!, Astro BioBest | 3,213.4 | 19.3 |
Agropur Co-operative Agro-Alimentaire | L'Extra, Natrel, Quebon, Sealtest, OKA | 2,578.5 | 15.5 |
Kraft Heinz Company | Kraft, Philadelphia, Jell-O, Velveeta | 1,160.4 | 7.0 |
Danone, Groupe | Danone, Activia, Actimel, International Delight, Danino | 967.3 | 5.8 |
General Mills Inc. | Yoplait, Liberté, Minigo | 720.6 | 4.3 |
Upfield Holdings BV | Becel, Imperial, I Can't Believe It's Not Butter | 396.7 | 2.4 |
Gay Lea Foods Co-Operative Ltd. | Gay Lea, Nordica | 191.5 | 1.2 |
Arla Foods Amba | Tre Stelle | 109.7 | 0.7 |
Bel, Groupe | Boursin | 85.7 | 0.5 |
Private label | Private label | 1,313.4 | 7.9 |
Others | Others | 1,793.5 | 10.8 |
Total - dairy | 16,630.5 | 100.0 | |
Source: Euromonitor International, 2023 | |||
Retail distribution channels - dairy products and alternatives
In 2023, store-based retailing distribution of dairy products and alternatives totalled a market share of 94.8% mainly consisting of grocery retailers such as supermarkets (54.8%), hypermarkets (18.7%), small local grocers (9.2%), and discounters (6.8%). Non-store e-commerce retailing for dairy products and alternatives held a 5.2% market share, which has increased by a high CAGR of 79.2% from sales of Can$51.3 million in 2018 to Can$947.2 million in 2023.
As supermarkets and hypermarkets maintain their position as the primary choice for consumers seeking dairy products, a notable trend is the increasing popularity of discounters like Costco. Consumers are opting for bulk purchases to capitalize on potential savings over sporadic offer discounts from supermarkets and hypermarkets - primarily driven by the ongoing high levels of food inflation. Heightened sales for 'everyday or immediate need' food products are also occurring within General Merchandise and Dollar stores.Footnote 1
Outlet type | 2018 | 2023 | CAGR* % 2018-2023 | ||
|---|---|---|---|---|---|
Actual | Share % | Actual | Share % | ||
Total - retail channels | 14,068.1 | 100.0 | 18,044.3 | 100.0 | 5.1 |
Store-based retail - offline | 14,016.8 | 99.6 | 17,097.1 | 94.8 | 4.1 |
Grocery retailers | 13,778.3 | 97.9 | 16,801.4 | 93.1 | 4.0 |
Convenience retail stores (including forecourts) | 329.1 | 2.3 | 345.4 | 1.9 | 1.0 |
Supermarkets | 8,038.8 | 57.1 | 9,893.0 | 54.8 | 4.2 |
Hypermarkets | 2,727.3 | 19.4 | 3,366.6 | 18.7 | 4.3 |
Discounters | 1,033.2 | 7.3 | 1,222.5 | 6.8 | 3.4 |
Warehouse clubs | 221.4 | 1.6 | 261.5 | 1.4 | 3.4 |
Food/drink tobacco specialists | 44.6 | 0.3 | 58.5 | 0.3 | 5.6 |
Small local grocers | 1,383.9 | 9.8 | 1,654.0 | 9.2 | 3.6 |
Non-grocery specialists | 238.4 | 1.7 | 295.7 | 1.6 | 4.4 |
General merchandise stores | 77.2 | 0.5 | 94.4 | 0.5 | 4.1 |
Health and beauty specialists | 159.6 | 1.1 | 192.9 | 1.1 | 3.9 |
Other non-grocery retailers | 1.7 | 0.0 | 8.3 | 0.0 | 37.3 |
Non-store retail - e-commerce | 51.3 | 0.4 | 947.2 | 5.2 | 79.2 |
Source: Euromonitor International, 2023 *CAGR: Compound Annual Growth Rate | |||||
Staple foods – baked goods
Retail sales
In 2023, baked goods were the 2nd largest packaged food segment at a total retail sales value of Can$11.2 billion in Canada, growing historically by a CAGR of 7.0% between 2018 and 2023. Bread was the largest subsector within the baked goods category to reach sales of Can$6.7 billion (59.5%), followed by pastries at Can$2.1 billion (12.2%), cakes at Can$1.2 billion (11.1%), dessert pies and tarts at Can$726.0 million (7.0%), frozen baked goods at Can$388.6 million (5.5%), and dessert mixes at Can$113.7 million (3.3%) in 2023.
Amidst high prices that have been soaring to record levels, sales of baked goods are set to contract in value and volume growth - particularly in the bread category. Consumers are seeking cost-saving options and when not purchasing in bulk, they are turning to smaller discount retailers like Dollarama. While affordability is a key concern, health-conscious consumers are increasingly looking for functionality and healthier options when it comes to baked goods. Whole wheat has been the staple choice over the years, yet emerging ingredients found in flatbread, leavened bread, and cakes - often considered 'functional and healthier alternatives' in the category - are products that are oat flour-based, gluten-free, and keto-friendly or plant-based options.Footnote 2
In the forecast period (2023 to 2028), baked goods are expected to gradually decline due to high prices and an increasingly health-conscious consumer base, focused on reduced-carb diets - particularly in the case of regular white bread (leavened or flat). Dessert mixes with its lack of nutrition are expected to decrease the most over the forecast period at a CAGR of −0.3%. Nevertheless, there are opportunities to strengthen the category as the plant-based trend is gaining momentum in Canada and manufacturers prioritize the introduction of better-for-you products. Artisinal bakers offering more options in the fresh bread segment, along with Canada's ambitious immigration plan are expected to strengthen the category. With an increased diversity of consumers, the baked goods category is set to see a growing number of foodservice outlets serving global cuisine and supermarkets are now stocking more ethnic food products (including naans, roti, tortillas, and new varieties of Agege bread from Nigeria).Footnote 2
Category | 2018 | 2019 | 2020 | 2021 | 2022 | 2023 |
|---|---|---|---|---|---|---|
Total - baked goods | 7,985.1 | 8,199.0 | 8,922.8 | 9,131.9 | 10,286.6 | 11,199.3 |
Bread | 4,579.5 | 4,679.7 | 5,225.1 | 5,383.3 | 6,122.8 | 6,661.3 |
Cakes | 997.1 | 1,013.8 | 1,033.6 | 1,056.7 | 1,164.5 | 1,242.5 |
Dessert mixes | 97.5 | 96.6 | 105.6 | 103.9 | 110.1 | 113.7 |
Frozen baked goods | 294.6 | 307.1 | 351.0 | 346.2 | 368.4 | 388.6 |
Pastries | 1,455.8 | 1,517.7 | 1,574.3 | 1,611.9 | 1,842.4 | 2,067.2 |
Dessert pies and tarts | 560.6 | 584.1 | 633.2 | 630.0 | 678.5 | 726.0 |
Source: Euromonitor International, 2023 | ||||||
Category | Annual growth % 2023/2022 | CAGR* % 2018-2023 | Total Growth % 2018-2023 |
|---|---|---|---|
Total - baked goods | 8.9 | 7.0 | 40.3 |
Bread | 8.8 | 7.8 | 45.5 |
Cakes | 6.7 | 4.5 | 24.6 |
Dessert mixes | 3.3 | 3.1 | 16.6 |
Frozen baked goods | 5.5 | 5.7 | 31.9 |
Pastries | 12.2 | 7.3 | 42.0 |
Dessert pies and tarts | 7.0 | 5.3 | 29.5 |
Source: Euromonitor International, 2023 *CAGR: Compound Annual Growth Rate | |||
Category | 2023 | 2024 | 2025 | 2026 | 2027 | 2028 |
|---|---|---|---|---|---|---|
Total - baked goods | 11,199.3 | 11,504.2 | 11,848.5 | 12,234.4 | 12,641.1 | 13,082.6 |
Bread | 6,661.3 | 6,854.0 | 7,072.3 | 7,315.1 | 7,569.9 | 7,852.3 |
Cakes | 1,242.5 | 1,243.3 | 1,257.6 | 1,285.8 | 1,324.6 | 1,373.1 |
Dessert mixes | 113.7 | 113.0 | 112.3 | 111.9 | 111.9 | 112.1 |
Frozen baked goods | 388.6 | 397.7 | 407.2 | 417.7 | 429.3 | 441.8 |
Pastries | 2,067.2 | 2,141.4 | 2,219.8 | 2,301.4 | 2,380.8 | 2,456.2 |
Dessert pies and tarts | 726.0 | 754.8 | 779.3 | 802.5 | 824.7 | 847.0 |
Source: Euromonitor International, 2023 | ||||||
Category | Annual growth % 2024/2023 | CAGR* % 2023-2028 | Total growth % 2023-2028 |
|---|---|---|---|
Total - baked goods | 2.7 | 3.2 | 16.8 |
Bread | 2.9 | 3.3 | 17.9 |
Cakes | 0.1 | 2.0 | 10.5 |
Dessert mixes | −0.6 | −0.3 | −1.4 |
Frozen baked goods | 2.3 | 2.6 | 13.7 |
Pastries | 3.6 | 3.5 | 18.8 |
Dessert pies and tarts | 4.0 | 3.1 | 16.7 |
Source: Euromonitor International, 2023 *CAGR: Compound Annual Growth Rate | |||
Competitive landscape - Baked goods
In 2023, leading retail companies (and top brands) in the baked goods category in Canada included Grupo Bimbo SAB de CV (Dempster's, Vachon, Stonemill) at sales of Can$1.7 billion (15.0%), George Weston Ltd. (Wonder Bread, Country Harvest, D'Italiano) at Can$980.0 million (8.8%), and FGF Brands Inc. (Casa Mendosa) at Can$181.6 million (1.6%). Artisanal bakers, however, brought in the highest share of sales value at Can$3.8 billion (34%), followed by private label baked good products that totalled Can$2.3 billion (20.2%) in 2023.
Rising prices are compelling consumers to down trade or turn to discount retailers like Dollarama for their grocery needs, including baked goods. Artisanal manufacturers are seeing a growing market share as independent bakeries and shops continue to emerge nationwide. A growing diversity in the Canadian population is speeding the growth in foodservice sales of baked goods and bakeries that are offering unique and new global flavours.Footnote 2
Company | Top brand(s) | Retail sales (US$ million) | Market share % in 2023 |
|---|---|---|---|
Grupo Bimbo SAB de CV | Dempster's, Vachon, Stonemill | 1,674.9 | 15.0 |
George Weston Ltd. | Wonder Bread, Country Harvest, D'Italiano, Weston, All But Gluten, Casa Mendosa | 980.0 | 8.8 |
FGF Brands Inc. | Casa Mendosa | 181.6 | 1.6 |
Kellogg Company | Kellogg's Eggo, Kellogg's Pop-Tarts | 181.3 | 1.6 |
Ozery Bakery/Pita Break | Morning Rounds | 86.2 | 0.8 |
General Mills Inc. | Betty Crocker, Pillsbury | 80.9 | 0.7 |
La Boulangerie St-Methode | La Récolte de St-Méthode | 79.1 | 0.7 |
Chudleigh's Ltd. | Chudleigh's | 49.2 | 0.4 |
McCain Foods Ltd. | McCain | 27.0 | 0.2 |
Hostess Brands LLC | Hostess | 24.5 | 0.2 |
Artisanal | Artisanal | 3,806.5 | 34.0 |
Private label | Private label | 2,267.0 | 20.2 |
Others | Others | 1,686.0 | 15.1 |
Total - baked goods | 11,199.3 | 100.0 | |
Source: Euromonitor International, 2023 | |||
Retail distribution channels - staple foods
In 2023, store-based retailing distribution of staple foods like baked good products totalled a market share of 95.5% mainly consisting of grocery retailers such as supermarkets (46.5%), hypermarkets (20.9%), small local grocers (9.9%), discounters (7.9%), and food/drink tobacco specialists (6.0%). Non-store e-commerce retailing for staple food products held a 4.5% market share, which has increased by a high CAGR of 94.2% from sales of Can$42.6 million in 2018 to Can$1.2 billion in 2023.
Outlet type | 2018 | 2023 | CAGR* % 2018-2023 | ||
|---|---|---|---|---|---|
Actual | Share % | Actual | Share % | ||
Total - retail channels | 19,644.7 | 100.0 | 26,331.3 | 100.0 | 6.0 |
Store-based retail - offline | 19,602.1 | 99.8 | 25,155.2 | 95.5 | 5.1 |
Grocery retailers | 19,217.9 | 97.8 | 24,701.4 | 93.8 | 5.1 |
Convenience retail stores (including forecourts) | 183.6 | 0.9 | 214.1 | 0.8 | 3.1 |
Supermarkets | 9,463.7 | 48.2 | 12,250.5 | 46.5 | 5.3 |
Hypermarkets | 4,350.6 | 22.1 | 5,514.3 | 20.9 | 4.9 |
Discounters | 1,613.5 | 8.2 | 2,086.0 | 7.9 | 5.3 |
Warehouse clubs | 363.9 | 1.9 | 451.7 | 1.7 | 4.4 |
Food/drink tobacco specialists | 1,181.5 | 6.0 | 1,588.7 | 6.0 | 6.1 |
Small local grocers | 2,061.2 | 10.5 | 2,596.1 | 9.9 | 4.7 |
Non-grocery specialists | 384.2 | 2.0 | 453.8 | 1.7 | 3.4 |
General merchandise stores | 289.7 | 1.5 | 347.0 | 1.3 | 3.7 |
Apparel and footwear specialists | 16.7 | 0.1 | 20.0 | 0.1 | 3.7 |
Health and beauty specialists | 58.7 | 0.3 | 71.1 | 0.3 | 3.9 |
Other non-grocery retailers | 19.1 | 0.1 | 15.6 | 0.1 | −4.0 |
Non-store retail - e-commerce | 42.6 | 0.2 | 1,176.1 | 4.5 | 94.2 |
Source: Euromonitor International, 2023 *CAGR: Compound Annual Growth Rate | |||||
Cooking ingredients – meals and soups
In 2023, the meals and soups category was the 3rd largest packaged food segment at a total retail sales value of Can$9.1 billion in Canada, growing historically by a CAGR of 7.1% between 2018 and 2023. Ready meals was the largest subsector within this category that reached sales of Can$4.4 billion (48%), followed by prepared salads at Can$1.5 billion (15.9%), food kits at Can$1.3 billion (14%), packaged pizzas at Can$1.2 million (12.7%), and soup at Can$861.8 million (9.4%) in 2023.
In Canada, there is a growing interest in new product developments in culturally-inspired foods, which is helping to particularly boost the sales in the meals and soups category - especially for ready meals (CAGR: 5.7%) and food kits (19.6%) between 2018 and 2023. Prepared salads was the best performed sub-category in 2023 (+7.8%) over the previous year, followed closely by food kits (+6.9%). Reasoning behind this trend, is due to consumers being increasingly pressed for time for home cooking especially with organizations adopting hybrid or on-site work models. As a result, meal kits help relieve the hassle of extensive meal preparation and these already prepared meals have become an economical and convenient solution for working Canadians.Footnote 3
The soups and meals category in Canada, however, is forecast to experience moderate growth at a total CAGR of 6.7% over the next five years (2023-2028). Food kits are expected to continue to grow at a higher rate (18.6%) over the forecast period, while traditional soups will be less popular. The demand for convenience and intriguing flavours is expected to play a pivotal role in supporting the industry's growth. Albeit, as money becomes tighter, consumers are expected to cut down from high spending in the grocery food and beverage industry, and instead will look towards budgeting their discretionary funds on expenditures such as foodservice, outdoor activities, and travel.Footnote 3
New health-consious product developments is a key factor, to continue to shape the meals and soups category. New product innovations must emphasize on functional benefits with added nutritional value that are rich in macronutrients or have a higher protein content. Additionally, the introduction of plant-based products are likely to gain prominence and carve out a lasting presence in the category.Footnote 3
Category | 2018 | 2019 | 2020 | 2021 | 2022 | 2023 |
|---|---|---|---|---|---|---|
Total - meals and soups | 6,488.1 | 6,825.9 | 7,871.0 | 8,330.2 | 8,773.6 | 9,147.9 |
Ready meals | 3,332.0 | 3,424.1 | 3,889.6 | 4,033.5 | 4,239.2 | 4,392.0 |
Soup | 682.1 | 687.8 | 805.9 | 811.4 | 844.6 | 861.8 |
Pizza | 923.2 | 917.4 | 1,073.5 | 1,104.3 | 1,145.2 | 1,162.4 |
Food kits | 523.7 | 696.6 | 1,016.1 | 1,192.9 | 1,198.2 | 1,280.4 |
Prepared salads | 1,027.1 | 1,100.1 | 1,085.8 | 1,187.9 | 1,346.3 | 1,451.3 |
Source: Euromonitor International, 2023 | ||||||
Category | Annual growth % 2023/2022 | CAGR* % 2018-2023 | Total growth % 2018-2023 |
|---|---|---|---|
Total - meals and soups | 4.3 | 7.1 | 41.0 |
Ready meals | 3.6 | 5.7 | 31.8 |
Soup | 2.0 | 4.8 | 26.3 |
Pizza | 1.5 | 4.7 | 25.9 |
Food kits | 6.9 | 19.6 | 144.5 |
Prepared salads | 7.8 | 7.2 | 41.3 |
Source: Euromonitor International, 2023 *CAGR: Compound Annual Growth Rate | |||
Category | 2023 | 2024 | 2025 | 2026 | 2027 | 2028 |
|---|---|---|---|---|---|---|
Total - meals and soups | 9,147.9 | 9,631.4 | 10,257.8 | 11,008.1 | 11,859.0 | 12,674.9 |
Ready meals | 4,392.0 | 4,576.2 | 4,777.2 | 4,994.4 | 5,223.8 | 5,465.7 |
Soup | 861.8 | 880.5 | 899.9 | 921.5 | 945.6 | 969.8 |
Pizza | 1,162.4 | 1,189.4 | 1,221.6 | 1,257.6 | 1,297.2 | 1,338.6 |
Food kits | 1,280.4 | 1,481.0 | 1,769.6 | 2,143.3 | 2,599.1 | 3,005.6 |
Prepared salads | 1,451.3 | 1,504.2 | 1,589.6 | 1,691.3 | 1,793.3 | 1,895.2 |
Source: Euromonitor International, 2023 | ||||||
Category | Annual growth % 2024/2023 | CAGR* % 2023-2028 | Total growth % 2023-2028 |
|---|---|---|---|
Total - meals and soups | 5.3 | 6.7 | 38.6 |
Ready meals | 4.2 | 4.5 | 24.4 |
Soup | 2.2 | 2.4 | 12.5 |
Pizza | 2.3 | 2.9 | 15.2 |
Food kits | 15.7 | 18.6 | 134.7 |
Prepared salads | 3.6 | 5.5 | 30.6 |
Source: Euromonitor International, 2023 *CAGR: Compound Annual Growth Rate | |||
Competitive landscape - meals and soups
In 2023, leading retail companies (and brands) in the meals and soups category in Canada included Nestlé SA (Stouffer's, Delissio, Marketplace Cuisine) at Can$1.2 billion (13.5%), HelloFresh SE (Chef's Plate, HelloFresh) at Can$577.8 million (6.3%), and the Campbell Soup Company (Campbell's, Habitant) at Can$521.5 million (5.7%). Private label meals and soups products held highest sales at a total market value of Can$1.5 million (16.1%) in 2023.
As people have started to return to work, the increasingly hectic lifestyles of consumers are anticipated to drive heightened demand for meal kits, which have led to sales growth in companies like Hello Fresh, Good Food, and several other new start-ups, such as Halalmeals and Inspired Go in Canada.
Nestlé's decision to exit the Canadian market in 2023, with leading brands (Delissio, Stouffer's) in frozen pizza and ready meals sub-categories will have significant implications for the food industry. Other brands will need to strategize and compete with new innovations, to fill the gap left behind by these product departures.Footnote 3
Company | Top brand(s) | Retail sales (US$ million) | Market share % in 2023 |
|---|---|---|---|
Nestlé SA | Stouffer's, Delissio, Marketplace Cuisine | 1,233.1 | 13.5 |
HelloFresh SE | Chef's Plate, HelloFresh | 577.8 | 6.3 |
Campbell Soup Company | Campbell's, Habitant | 521.5 | 5.7 |
Charoen Pokphand Group | Michelina's | 506.5 | 5.5 |
Oetker-Gruppe | Giuseppe, Restorante, Casa di Mama | 497.5 | 5.4 |
Kraft Heinz Company | Kraft, Crave, Heinz | 471.1 | 5.1 |
ConAgra Brands Inc. | Swanson, Healthy Choice, VH, Chef Boyardee | 435.3 | 4.8 |
Goodfood Market Corp. | Goodfood | 291.7 | 3.2 |
Taylor Fresh Foods Inc. | Earthbound Farm, River Ranch | 191.9 | 2.1 |
Itochu Corp. | Dole | 183.3 | 2.0 |
Private label | Private label | 1,469.8 | 16.1 |
Others | Others | 1,817.8 | 19.9 |
Total - meals and soups | 9,147.9 | 100.0 | |
Source: Euromonitor International, 2023 | |||
Retail distribution channels - cooking ingredients and meals
In 2023, store-based retailing distribution of cooking ingredients and meals totalled a market share of 90.9% mainly consisting of grocery retailers such as supermarkets (53.7%), hypermarkets (17.4%), small local grocers (12.1%), and discounters (5.4%). Non-store e-commerce retailing for cooking ingredients and meal products held a 9.1% market share, which has increased by a high CAGR of 40.2% from sales of Can$262.2 million in 2018 to Can$1.4 billion in 2023.
Outlet type | 2018 | 2023 | CAGR* % 2018-2023 | ||
|---|---|---|---|---|---|
Actual | Share % | Actual | Share % | ||
Total - retail channels | 11,358.0 | 100.0 | 15,551.8 | 100.0 | 6.5 |
Store-based retail - offline | 11,095.8 | 97.7 | 14,132.7 | 90.9 | 5.0 |
Grocery retailers | 11,072.4 | 97.5 | 14,099.3 | 90.7 | 5.0 |
Convenience retail stores (including forecourts) | 40.0 | 0.4 | 48.5 | 0.3 | 3.9 |
Supermarkets | 6,723.9 | 59.2 | 8,358.3 | 53.7 | 4.4 |
Hypermarkets | 2,031.7 | 17.9 | 2,704.8 | 17.4 | 5.9 |
Discounters | 574.5 | 5.1 | 837.8 | 5.4 | 7.8 |
Warehouse clubs | 197.8 | 1.7 | 260.8 | 1.7 | 5.7 |
Food/drink tobacco specialists | 1.5 | 0.0 | 1.6 | 0.0 | 1.3 |
Small local grocers | 1,503.1 | 13.2 | 1,887.6 | 12.1 | 4.7 |
Non-grocery specialists | 23.4 | 0.2 | 33.3 | 0.2 | 7.3 |
Health and beauty specialists | 22.5 | 0.2 | 32.6 | 0.2 | 7.7 |
Other non-grocery retailers | 0.8 | 0.0 | 0.8 | 0.0 | 0.0 |
Non-store retail - e-commerce | 262.2 | 2.3 | 1,419.2 | 9.1 | 40.2 |
Source: Euromonitor International, 2023 *CAGR: Compound Annual Growth Rate | |||||
Snacks – savoury
In 2023, savoury snack products in Canada was the largest segment in the overall snack category at a total retail sales value of Can$6.6 billion, growing historically by a CAGR of 6.8% between 2018 and 2023. Salty snacks had the highest sales in the savoury snack category at a value of Can$3.6 billion (54.1%), followed by nuts, seeds and trail mixes at Can$1.1 billion (16.2%), savoury biscuits at Can$913.2 million (13.8%), meat snacks at Can$541.3 million (8.2%), popcorn at Can$286.5 million (4.3%), pretzels at Can$89.8 million (1.4%), and seafood snacks at Can$12.3 million (1.(%) in 2023.
Post-pandemic, Canada after a long period of being isolated from others has fully reopened services that has resulted in an increase in social gatherings, as well as the return to offices and schools. This has led to a resurgence in on-the-go snacking and has encouraged manufacturers to move towards smaller portion size packaging more suitable for everyday consumption. Nevertheless, with food inflation in the country reaching an all-time high in early 2023, prices were increased in some snack sub-categories such as in confectionery and sweet biscuits, which resulted in lower volume sales. This forced manufacturers to take aggressive actions to lower price points in general that helped to maintain steady growth in an already high consumption level category - particularly amongst the targeted younger student generation, who are key consumers of snacks.Footnote 4
Snacks are expected to continue growth in the forecast period by a CAGR of 6.4% (2023-2028). While government actions aim to reduce inflation in Canada, manufacturers are heavily investing in new product development that focus on the health conscious consumer with functional benefits. Almost every snack category has seen a wide range of innovative products, where manufacturers are revitalizing certain categories by focusing on key ingredients such as added minerals, vitamins, protein and fibre, while striving to avoid high-carb and high-sugar products.Footnote 4
Category | 2018 | 2019 | 2020 | 2021 | 2022 | 2023 |
|---|---|---|---|---|---|---|
Total - savoury snacks | 4,759.8 | 4,946.5 | 5,362.1 | 5,671.4 | 6,116.3 | 6,620.1 |
Nuts, seeds and trail mixes | 680.3 | 709.1 | 779.8 | 863.8 | 961.5 | 1,072.8 |
Popcorn | 231.9 | 228.1 | 233.6 | 245.7 | 264.7 | 286.5 |
Pretzels | 62.2 | 68.2 | 73.9 | 77.2 | 84.3 | 89.8 |
Meat snacks | 287.7 | 326.0 | 376.6 | 420.3 | 476.2 | 541.3 |
Salty snacks | 2,608.1 | 2,700.7 | 2,926.5 | 3,070.9 | 3,309.0 | 3,581.6 |
Savoury biscuits | 794.3 | 815.8 | 866.3 | 880.7 | 896.2 | 913.2 |
Seafood snacks | 5.4 | 6.6 | 8.8 | 9.6 | 10.8 | 12.3 |
Other savoury snacks (including seaweed, spicy gluten, insect snacks, variety packs etc.) | 90.2 | 92.0 | 96.7 | 103.2 | 113.5 | 122.6 |
Source: Euromonitor International, 2023 | ||||||
Category | Annual growth % 2023/2022 | CAGR* % 2018-2023 | Total growth % 2018-2023 |
|---|---|---|---|
Total - savoury snacks | 8.2 | 6.8 | 39.1 |
Nuts, seeds and trail mixes | 11.6 | 9.5 | 57.7 |
Popcorn | 8.2 | 4.3 | 23.5 |
Pretzels | 6.5 | 7.6 | 44.4 |
Meat snacks | 13.7 | 13.5 | 88.1 |
Salty snacks | 8.2 | 6.5 | 37.3 |
Savoury biscuits | 1.9 | 2.8 | 15.0 |
Seafood snacks | 13.9 | 17.9 | 127.8 |
Other savoury snacks (including seaweed, spicy gluten, insect snacks, variety packs etc.) | 8.0 | 6.3 | 35.9 |
Source: Euromonitor International, 2023 *CAGR: Compound Annual Growth Rate | |||
Category | 2023 | 2024 | 2025 | 2026 | 2027 | 2028 |
|---|---|---|---|---|---|---|
Total - savoury snacks | 6,620.1 | 7,034.0 | 7,471.4 | 7,939.1 | 8,455.8 | 9,014.9 |
Nuts, seeds and trail mixes | 1,072.8 | 1,169.7 | 1,275.0 | 1,390.1 | 1,519.5 | 1,662.5 |
Popcorn | 286.5 | 303.2 | 319.4 | 335.8 | 352.6 | 369.6 |
Pretzels | 89.8 | 93.6 | 97.2 | 100.6 | 104.1 | 107.2 |
Meat snacks | 541.3 | 591.1 | 640.8 | 692.6 | 747.8 | 806.7 |
Salty snacks | 3,581.6 | 3,814.5 | 4,063.0 | 4,328.7 | 4,623.4 | 4,942.2 |
Savoury biscuits | 913.2 | 919.2 | 925.5 | 933.3 | 943.2 | 954.4 |
Seafood snacks | 12.3 | 13.5 | 14.7 | 16.1 | 17.7 | 19.6 |
Other savoury snacks (including seaweed, spicy gluten, insect snacks, variety packs etc.) | 122.6 | 129.4 | 135.7 | 141.7 | 147.5 | 152.9 |
Source: Euromonitor International, 2023 | ||||||
Category | Annual growth % 2024/2023 | CAGR* % 2023-2028 | Total growth % 2023-2028 |
|---|---|---|---|
Total - savoury snacks | 6.3 | 6.4 | 36.2 |
Nuts, seeds and trail mixes | 9.0 | 9.2 | 55.0 |
Popcorn | 5.8 | 5.2 | 29.0 |
Pretzels | 4.2 | 3.6 | 19.4 |
Meat snacks | 9.2 | 8.3 | 49.0 |
Salty snacks | 6.5 | 6.7 | 38.0 |
Savoury biscuits | 0.7 | 0.9 | 4.5 |
Seafood snacks | 9.8 | 9.8 | 59.3 |
Other savoury snacks (including seaweed, spicy gluten, insect snacks, variety packs etc.) | 5.5 | 4.5 | 24.7 |
Source: Euromonitor International, 2023 *CAGR: Compound Annual Growth Rate | |||
Competitive landscape - savoury snacks
In 2023, leading retail companies (and brands) in the savoury snack category in Canada included PepsiCo Inc. (Lay's, Doritos, Ruffles) at Can$2.5 billion (37.6%), Mondelez International Inc. (Ritz, Premium, Christie) at Can$466.8 million (7.1%), and Old Dutch Foods Inc. (Old Dutch, Restaurante Style, Humpty Dumpty) at Can$360.3 million (5.4%). Private label savoury snack brands held a high total market value of Can$968.4 million (14.6%) in 2023.
Manufacturers are targeting the younger, higher consumption audience, often through social media platforms such as Instagram that offers engaging content and interactions for snack brands like Pringles, Ruffles, KitKat, Lays, and Twizzlers. Kit Kat, for example, launched an Instagram-specific product (exclusively available through Instagram influencers) called Iftar Bar at the start of Ramadan, targeting and engaging the Muslim community - which specializes in 30 bars, one for each day of fasting. Additionally, small business owners persistently striving to enter the snacks market are actively supported by Canadian consumers. As a result, successful entrants gaining consumer confidence are small companies like the Humble Snacks Company and Simply Protein. As part of its Global snacking business unit called Kellanova, Mondelez International is restructuring its operations by successfully acquiring the Cliff Bar and Kellogg Company's snack brands.Footnote 4
Company | Top brand(s) | Retail sales (US$ million) | Market share % in 2023 |
|---|---|---|---|
PepsiCo Inc. | Lay's, Doritos, Ruffles, Miss Vickie's, Tostitos, Smartfood, Fritos, Rold Gold, Stacy's Pita Chips, Twistos, Cheetos, Crispy Minis, Cracker Jack, Chester's, Spitz, Sunchips | 2,486.6 | 37.6 |
Mondelez International Inc. | Ritz, Premium, Christie, Wheat Thins, Triscuit | 466.8 | 7.1 |
Old Dutch Foods Inc. | Old Dutch, Restaurante Style, Humpty Dumpty, Arriba | 360.3 | 5.4 |
Hormel Foods Corp | Planters | 242.6 | 3.7 |
Link Snacks Inc | Jack Link's | 196.2 | 3.0 |
ConAgra Brands Inc. | Orville Redenbacher's, Slim Jim, Bigs, Duke's | 167.0 | 2.5 |
Dare Foods Ltd. | Breton, Melba, Vinta, Grissol | 152.7 | 2.3 |
Campbell Soup Company | Pepperidge Farm, Kettle Chips | 100.0 | 1.5 |
The Wonderful Co LLC | Wonderful Pistachios | 96.8 | 1.5 |
Blue Diamond Growers | Blue Diamond | 80.8 | 1.2 |
Private label | Private label | 968.4 | 14.6 |
Others | Others | 903.1 | 13.6 |
Total - savoury snacks | 6,620.1 | 100.0 | |
Source: Euromonitor International, 2023 | |||
Retail distribution channels - snacks category
In 2023, store-based retailing distribution of snack products totalled a market share of 94.5%. While grocery retailers such as supermarkets (28.9%) and hypermarkets (11.4%) have maintained their growth in the snack category, discounters (13.1%), small local grocers (12.9%), and convenience and forecourt retailers (11.4%) have at the same time steadily gained a higher market share, sometimes at the expense of traditional retailers.
Non-store e-commerce retailing for snack products held a 5.5% market share, which has increased by a high CAGR of 51% from sales of Can$124.6 million in 2018 to Can$978.0 billion in 2023. Meanwhile, vending and direct selling of snacks have remained low or have drastically declined over the period, with CAGRs of 1.6% and −12.9% respectively (2018-2023).
Foodservice has experienced a healthy recovery and has seen a strong performance as the country fully reopened. A factor also, driving this high demand is a growing population through an influx of immigrants and tourists, which has led to an increase in the number of new foodservice outlets.Footnote 4
Outlet type | 2018 | 2023 | CAGR* % 2018-2023 | ||
|---|---|---|---|---|---|
Actual | Share % | Actual | Share % | ||
Total - retail channels | 13,390.3 | 100.0 | 17,650.9 | 100.0 | 5.7 |
Store-based retail - offline | 13,265.7 | 99.1 | 16,672.9 | 94.5 | 4.7 |
Grocery retailers | 11,603.3 | 86.7 | 14,509.1 | 82.2 | 4.6 |
Convenience retail stores (including forecourts) | 1,571.8 | 11.7 | 2,005.4 | 11.4 | 5.0 |
Supermarkets | 4,162.5 | 31.1 | 5,093.2 | 28.9 | 4.1 |
Hypermarkets | 1,577.0 | 11.8 | 2,011.7 | 11.4 | 5.0 |
Discounters | 1,822.4 | 13.6 | 2,311.4 | 13.1 | 4.9 |
Warehouse clubs | 255.3 | 1.9 | 331.6 | 1.9 | 5.4 |
Food/drink tobacco specialists | 405.3 | 3.0 | 471.1 | 2.7 | 3.1 |
Small local grocers | 1,809.0 | 13.5 | 2,284.8 | 12.9 | 4.8 |
Non-grocery specialists | 1,591.4 | 11.9 | 2,087.1 | 11.8 | 5.6 |
General merchandise stores | 89.0 | 0.7 | 115.4 | 0.7 | 5.3 |
Health and beauty specialists | 1,096.4 | 8.2 | 1,321.4 | 7.5 | 3.8 |
Other non-grocery retailers | 406.1 | 3.0 | 650.4 | 3.7 | 9.9 |
Non-store retail | 195.5 | 1.5 | 1,054.7 | 6.0 | 40.1 |
Vending | 70.7 | 0.5 | 76.6 | 0.4 | 1.6 |
Direct selling | 0.2 | 0.0 | 0.1 | 0.0 | −12.9 |
E-Commerce | 124.6 | 0.9 | 978.0 | 5.5 | 51.0 |
Source: Euromonitor International, 2023 *CAGR: Compound Annual Growth Rate | |||||
Product launch and trend analysis
Mintel indicated that there were 37,278 packaged food products launched (including new variety/range extension, packaging, formulation or relaunched) in Canada's supermarkets between the period of January 2018 and December 7th, 2023. During this period, these food products consisted mainly of categories such as new sauces and seasonings (16.8%), snacks (14%), processed fish, meat and egg products (12.1%), bakery (11.4%), dairy (8.1%), side dishes (6.5%), fruit and vegetables (5.5%), chocolate confectionery (5.4%), meals and meal centers (4.3%), and sweet spreads (3.4%).
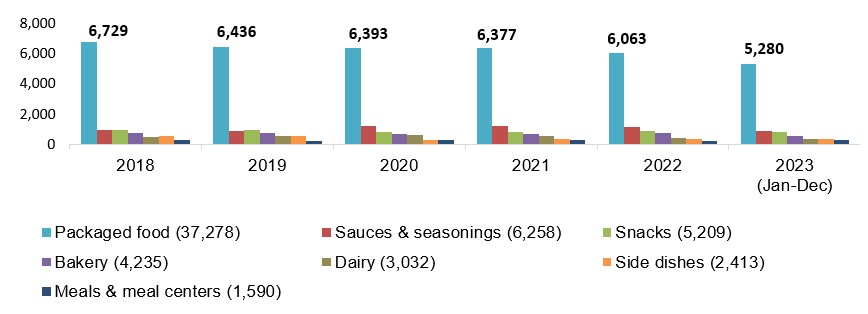
Description of above image
Product | 2018 | 2019 | 2020 | 2021 | 2022 | 2023 (January to December 7) | Total |
|---|---|---|---|---|---|---|---|
Packaged food | 6,729 | 6,436 | 6,393 | 6,377 | 6,063 | 5,280 | 37,278 |
Sauces and seasonings | 929 | 901 | 1,182 | 1,216 | 1,133 | 897 | 6,258 |
Snacks | 941 | 914 | 826 | 834 | 905 | 789 | 5,209 |
Bakery | 773 | 771 | 701 | 697 | 720 | 573 | 4,235 |
Dairy | 508 | 545 | 629 | 579 | 417 | 354 | 3,032 |
Side dishes | 562 | 515 | 304 | 346 | 370 | 316 | 2,413 |
Meals and meal centers | 300 | 228 | 298 | 279 | 233 | 252 | 1,590 |
Source: Mintel, 2023
Top parent companies launching the most new package food products in Canada over the last year [Q4-2022 to Q4-2023] were Metro (282), George Weston (279), Pattison Food Group (279), Walmart (194), Sobey's (134), and Avril Supermarché Santé (106). New packaged food brands launched recently for the first time within the last six months in the Canadian market (2023) include Chef Pasquale (Rosata sauce), Flavorgod (gingerbread cookie flavoured seasoning), We Bio! (no sugar added organic apple mango purée), and Grenade (milk chocolate protein spread).
In Canada, the fastest growing flavours in these packaged food products were tahini (+600%), pesto (+600%), and Mexican, sundried tomato, peri/piri and Turkish delight growing by +400% each [Q4-2021 to Q4-2023]. New or popular ingredients included sour cream and onion flavour, sea trout, cilantro, golden linseed flour, calcium potassium phosphate citrate, Kennebec potato, vegan fish stock, packaging gases, and Coral lentil.
Leading claims used on these packaged food products within the last three months were Kosher (37.5%), low/no/reduced allergen (33.2%), gluten free (28.5%), no additives/preservatives (23.1%), environmentally friendly packaging (17.7%), vegan/no animal ingredients (15.8%), environmentally friendly product (15.1%), and free from added/artificial flavourings (14.1%). Other health and functional claims on packaging included organic (18%), plant-based (9.2%), premium (7.3%), dairy free (5.9%), wholegrain (4.3%), high/added fibre (3.8%), all natural (3.4%), no added sugar (3.4%), and high/added protein (3.2%). Amongst these products, top growing claims included functional - eye health (+600%), functional - brain and nervous system (+300%), female (+200%), functional - digestive (133.3%), and carbon neutral (+116.7%); while declining claims at −100% included male, breath-freshening, seasonal, diabetic, no/no/reduced glycemic [Q3-2022 compared to Q3-2023].
In the Canadian market, the highest growing categories included sweet spreads (+62.5%), fruit and vegetables (+57.1%), sauces and seasonings (+23.2%), soup (+39.5%), and side dishes (+10.1%); while top declining categories included chocolate confectionery (−71.8%), dairy (−34.2%), meals and meal centers (−28.1%), bakery (−16%), snacks (−11.6%), and processed fish, meat and egg products (−9.6%) [Q4-2022 vs Q4-2023].
Product attributes | Yearly launch - item count | ||||||
|---|---|---|---|---|---|---|---|
2018 | 2019 | 2020 | 2021 | 2022 | 2023 | Total | |
Yearly product launches | 6,729 | 6,436 | 6,393 | 6,377 | 6,063 | 5,280 | 37,278 |
Top launch types | |||||||
New variety/range extension | 2,958 | 2,668 | 2,259 | 2,300 | 1,929 | 1,619 | 13,733 |
New packaging | 2,057 | 1,723 | 2,363 | 2,246 | 2,595 | 2,079 | 13,063 |
New product | 1,351 | 1,759 | 1,372 | 1,453 | 1,152 | 1,229 | 8,316 |
Relaunch | 333 | 270 | 387 | 358 | 380 | 338 | 2,066 |
New formulation | 30 | 16 | 12 | 20 | 7 | 15 | 100 |
Top sub-categories | |||||||
Fish products | 370 | 325 | 269 | 380 | 261 | 236 | 1,841 |
Seasonings | 337 | 379 | 255 | 250 | 342 | 229 | 1,792 |
Vegetables | 273 | 239 | 248 | 309 | 231 | 225 | 1,525 |
Meat products | 378 | 195 | 236 | 190 | 194 | 142 | 1,335 |
Baking ingredients and mixes | 207 | 163 | 164 | 240 | 304 | 197 | 1,275 |
Top five companies | |||||||
Loblaws | 490 | 255 | 401 | 368 | 340 | 152 | 2,006 |
Sobeys | 178 | 79 | 386 | 413 | 205 | 88 | 1,349 |
Walmart | 176 | 233 | 237 | 128 | 248 | 157 | 1,179 |
Metro Brands | 303 | 109 | 41 | 175 | 235 | 235 | 1,098 |
Save-on-Foods | 0 | 26 | 119 | 213 | 168 | 153 | 679 |
Top five brands | |||||||
Compliments | 92 | 50 | 293 | 290 | 126 | 65 | 916 |
PC President's Choice | 202 | 94 | 173 | 155 | 173 | 80 | 877 |
Great Value | 128 | 171 | 170 | 82 | 163 | 128 | 842 |
Western Family | 109 | 44 | 118 | 220 | 145 | 112 | 748 |
Selection | 142 | 38 | 7 | 58 | 114 | 76 | 435 |
Import status (if reported) | |||||||
Imported | 2,242 | 2,400 | 2,290 | 2,363 | 2,055 | 1,814 | 13,164 |
Not imported | 1,273 | 1,292 | 1,279 | 1,376 | 1,580 | 1,471 | 8,271 |
Top five price groups | |||||||
US$0.18 - 11.17 | 6,304 | 5,949 | 5,726 | 5,704 | 5,481 | 4,613 | 33,777 |
US$11.18 - 22.17 | 380 | 418 | 595 | 606 | 526 | 620 | 3,145 |
US$22.18 - 33.17 | 35 | 59 | 62 | 54 | 54 | 35 | 299 |
US$33.18 - 44.17 | 9 | 3 | 10 | 7 | 2 | 7 | 38 |
US$44.18 - 57.00 | 0 | 1 | 0 | 6 | 0 | 2 | 9 |
Top five flavours (including blend) | |||||||
Unflavoured/plain | 2,445 | 2,416 | 2,323 | 2,440 | 2,139 | 1,804 | 13,567 |
Chocolate | 146 | 111 | 111 | 121 | 99 | 105 | 693 |
Smoke | 111 | 73 | 65 | 82 | 75 | 58 | 464 |
Vanilla/vanilla Bourbon/vanilla Madagascar | 63 | 61 | 59 | 55 | 50 | 47 | 335 |
Strawberry | 61 | 56 | 55 | 53 | 48 | 55 | 328 |
Top package types | |||||||
Flexible (stand-up pouch/sachet) | 3,615 | 3,546 | 2,825 | 2,744 | 2,991 | 2,548 | 18,269 |
Jar | 514 | 573 | 866 | 859 | 732 | 616 | 4,160 |
Bottle | 351 | 344 | 562 | 570 | 503 | 402 | 2,732 |
Tub | 484 | 461 | 364 | 409 | 388 | 404 | 2,510 |
Skinpack | 406 | 389 | 410 | 385 | 290 | 254 | 2,134 |
Source: Mintel; Global New Product Database, 2023 | |||||||
Product examples
Organic Brown Rice Paper with Turmeric

Source: Mintel, 2023
Company | Cultivar Foods |
|---|---|
Brand | King Soba |
Sub-category | Bakery, baking ingredients and mixes |
Market | Canada, imported from Vietnam |
Related claims | Organic, vegetarian, gluten free, wholegrain, low / no / reduced allergen, ethical – environmentally friendly package / recycling, ease of use, vegan / no animal ingredients |
Store name / type / location | Marchés TAU, natural / health food store, Montreal-Langelier, H1S 1V7 |
Launch type | New product |
Date published | December 2023 |
Price in Canadian dollars | 9.99 |
This product retails in a 200 gram pack and contains 22 portions. Vietnamese-style rice wraps. Organic, gluten-free, and vegan. Ideal for fresh Vietnamese-style spring or summer rolls. Just soak, fill and roll. Recyclable pack. Suitable for vegans and vegetarians. Logos and certifications: Canada Organic
Organic Coconut Sugar

Source: Mintel, 2023
Company | Big Tree Farms |
|---|---|
Brand | Big Tree Farms |
Sub-category | Sweeteners and sugar, sucrose |
Market | Canada |
Related claims | Organic, ethical – environmentally friendly product / human / sustainable, vegan / no animal ingredients, GMO free |
Store name / type / location | Costco, club store, Burnaby, V5C 0E5 |
Launch type | New product |
Date published | December 2023 |
Price in Canadian dollars | 12.99 |
This product retails in a 1.8 kilogram pack. Nature's perfect unrefined sweetener for baking and beverages. Certified fair trade. Organic granulated coconut flower blossom nectar sugar is super sustainable. Logos and certifications: USDA Organic, Non GMO Project Verified, Control Union Fair Choice, Vegan, Facebook, Twitter, Instagram
Fire Roasted Brussel Sprouts & Bacon

Source: Mintel, 2023
Company | PuraVida Foods |
|---|---|
Brand | PuraVida |
Sub-category | Side dishes, stuffing, polenta and other sides |
Market | Canada, imported from the United States |
Related claims | Microwaveable, gluten free, low / no / reduced allergen |
Store name / type / location | Costco, club store, Burnaby, V5C 0E5 |
Launch type | New product |
Date published | December 2023 |
Price in Canadian dollars | 17.99 |
This product retails in a 1.1 kilogram pack containing four pouches. Microwaveable individual steam pouches, ready in five mins. A mix of Brussels sprouts and naturally smoked bacon tossed in extra virgin olive oil, Himalayan pink salt and cracked black peppercorns, fire roasted using proprietary high temperature for a short time - al dente cooking method, followed by rapid freezing using advanced cryogenics. Gluten free. Logos and certifications: Facebook, Twitter, Instagram, LinkedIn, YouTube, U.S. Inspected and Passed
Organic Whole Brown Rice Flour

Source: Mintel, 2023
Company | La Milanaise |
|---|---|
Brand | Milanaise |
Sub-category | Bakery, baking ingredients and mixes |
Market | Manufactured in Canada, not imported |
Related claims | Organic, wholegrain, ethical – environmentally friendly package / biodegradable / toxins free / sustainable |
Store name / type / location | IGA, supermarket, Jean Talon Est, Montreal, H1S 1K6 |
Launch type | New product |
Date published | December 2023 |
Price in Canadian dollars | 10.79 |
This product retails in a 1 kilogram pack. Ideal for cookies and muffins. Made in Canada from imported ingredients. Milanaise is a family business. To meet organic definition, all cereal grains used for milling have been produced in full compliance to standards of organic agriculture, using composts, green manures and sound crop rotations to maintain and enhance soil fertility. For better quality, all the manufacturer's flours are freshly milled. 100% compostable bag with water based ink. Logos and certifications: Ecocert, Canada Organic, Kosher, Ecocert Canada
Marble Rye Sliced Bread

Source: Mintel, 2023
Company | Walmart |
|---|---|
Brand | Your Fresh Market |
Sub-category | Bakery, bread and bread products |
Market | Canada |
Related claims | No additives / preservatives, Kosher, low / no / reduced transfat, free from added / artificial colourings or flavourings |
Store name / type / location | Walmart, mass merchandise / hypermarket, Edmonton, T6N 0A9 |
Launch type | New product |
Date published | December 2023 |
Price in Canadian dollars | 3.47 |
This product retails in a 500 gram pack. Marble rye sliced bread, made from a traditional European-style recipe - perfect on its own, as a sandwich or for dipping in your favourite spreads. The Ingredient Wise symbol appears on products made without these ingredients: synthetic colours, artificial flavours and sweeteners, hydrogenated vegetable oil, and monosodium glutamate. Logos and certifications: Ingredient Wise, Kosher, How2Recycle
Chestnut Spread

Source: Mintel, 2023
Company | Meilleures Marques |
|---|---|
Brand | Chef Lelarge |
Sub-category | Sweet spreads, nut spreads |
Market | Canada, imported from France |
Store name / type / location | Metro (Canada), supermarket, Montreal, Langelier, H1N 1C6 |
Launch type | New product |
Date published | December 2023 |
Price in Canadian dollars | 14.99 |
This product is now available and retails in a 500 gram pack. Fine products. This chestnut spread has a delectable texture and can be enjoyed on its own, on a piece of angel cake or mixed into favourite recipes, like chestnut brownies.
For more information
The Canadian Trade Commissioner Service:
International Trade Commissioners can provide Canadian industry with on-the-ground expertise regarding market potential, current conditions and local business contacts, and are an excellent point of contact for export advice.
More agri-food market intelligence:
Agri-food market intelligence service
Canadian agri-food and seafood businesses can take advantage of a customized service of reports and analysis, and join our email subscription service to have the latest reports delivered directly to their inbox.
More on Canada's agriculture and agri-food sectors:
Canada's agriculture sectors
Information on the agriculture industry by sector. Data on international markets. Initiatives to support awareness of the industry in Canada. How the department engages with the industry.
Resources
- Euromonitor International database, 2023
- Euromonitor International | June 2023. Country Report: Snacks in Canada
- Euromonitor International | November 2023. Country Report: Baked Goods in Canada
- Euromonitor International | November 2023. Country Report: Meals and Soups in Canada
- Euromonitor International | September 2023. Country Report: Dairy Products and Alternatives in Canada
- Global Trade Tracker, 2023
- Mintel Global New Products Database, 2023
Sector Trend Analysis – Packaged food trends in Canada
Global Analysis Report
Prepared by: Erin-Ann Chauvin, Senior Market Analyst
© His Majesty the King in Right of Canada, represented by the Minister of Agriculture and Agri-Food (2024).
Photo credits
All photographs reproduced in this publication are used by permission of the rights holders.
All images, unless otherwise noted, are copyright His Majesty the King in Right of Canada.
To join our distribution list or to suggest additional report topics or markets, please contact:
Agriculture and Agri-Food Canada, Global Analysis
1341 Baseline Rd, Tower 5, 3rd floor
Ottawa ON K1A 0C5
Canada
Email: aafc.mas-sam.aac@agr.gc.ca
The Government of Canada has prepared this report based on primary and secondary sources of information. Although every effort has been made to ensure that the information is accurate, Agriculture and Agri-Food Canada (AAFC) assumes no liability for any actions taken based on the information contained herein.
Reproduction or redistribution of this document, in whole or in part, must include acknowledgement of agriculture and agri-food Canada as the owner of the copyright in the document, through a reference citing AAFC, the title of the document and the year. Where the reproduction or redistribution includes data from this document, it must also include an acknowledgement of the specific data source(s), as noted in this document.
Agriculture and Agri-Food Canada provides this document and other report services to agriculture and food industry clients free of charge.