

Note: This report includes forecasting data that is based on baseline historical data.
Executive summary
The pet population in India has increased significantly by a compound annual growth rate (CAGR) of 11.7% from 22.1 million pets in 2018 to 38.5 million pets in 2023.
Retail sales of pet food in India has increased significantly in CAGR by 20.7% from US$245.4 million in 2018 to US$629.6 million in 2023 and is expected to further improve with an increase in CAGR of 15.0% as retail sales are anticipated to reach US$1.3 billion by 2028.
The largest category of pet food in India, in terms of retail value sales in 2023, was dog food with values of US$539.0 million (85.6% market share) and cat food with values of US$89.8 million (14.3% market share) in 2023
Mars Inc and Indian Broiler Group were the two largest pet food companies in India representing a combined market share of 66.9% in 2022. In terms of retail sales, Mars International India PVT LTD, led sales attaining values of US$281.5 million in 2022.
The majority of India's pet food market is distributed through non-grocery retailers (pet shops and superstores), representing US$312.0 million (49.6% market share), while remaining sales are distributed through non-retail (veterinary clinics) channels with values of US$199.6 million (31.7% market share) and retail online (e-commerce) channels representing US$91.5 million (14.5% market share) in 2022.
In 2022, India imported US$144.1 million of pet food representing an increase in annual growth of 33.6% from US$45.3 million in 2018. Canada was India's eighth largest supplier of pet food providing US$2.3 million (1.6% market share) in 2022, representing a significant increase in annual growth of 31.1% from US$0.8 million in 2018.
According to Mintel's Global New Products Database (GNPD), there were 1,139 new pet food products launched in India between January 2018 and October 2023.
Dog snacks and treats, and dog food dry, and wet, were top subcategories of newly released pet food product launches while vitamin/mineral fortified, no additives/preservatives and teeth and tartar prevention were top claims associated with new pet food products released during the prescribed period.
Pet population and ownership
The pet population in India has increased significantly by a compound annual growth rate (CAGR) of 11.7% from 22.1 million pets in 2018 to 38.5 million pets in 2023. The pet population is forecast to increase by an additional CAGR of 8.8% as the pet population is expected to grow to 58.7 million pets by 2028.
In 2023, dogs accounted for 87.4% of the pet population (33.6 million) while cats represented 9.5% (3.7 million). Cat ownership in India has historically been low however, recent social media campaigns efforts by major brands to spread awareness of the benefits of cat ownership has encouraged the Indian pet owner to become increasingly receptive to owning a cat (Euromonitor International; Pet Care in India, July 2023). Cats, as a choice of pet, did attain the largest CAGR of 16.0% in the historic period as the population increased from 1.7 million in 2018 to 3.7 million in 2023 and are expected to obtain the largest CAGR (9.4%) in the forecast period, as the population increases to 5.8 million by 2028.
| Category | 2018 | 2023 | CAGR* % 2018-2023 | 2024 | 2028 | CAGR* % 2023-2028 |
|---|---|---|---|---|---|---|
| Pet Population (Total) | 22,112.5 | 38,463.1 | 11.7 | 42,165.1 | 58,706.8 | 8.8 |
| Cat | 1,743.6 | 3,666.6 | 16.0 | 4,072.2 | 5,752.0 | 9.4 |
| Dogs (total) | 19,431.5 | 33,606.2 | 11.6 | 36,853.9 | 51,527.4 | 8.9 |
| Small Dog (up to 20 pounds or 9 kilograms) | 8,671.7 | 16,911.5 | 14.3 | 18,729.5 | 26,769.5 | 9.6 |
| Medium Dog (20 to 50 pounds or 9 to 23 kilograms) | 2,996.7 | 4,668.4 | 9.3 | 5,069.9 | 6,860.0 | 8.0 |
| Large Dog (Over 50 pounds or over 23 kilograms) | 7,763.0 | 12,026.3 | 9.1 | 13,054.5 | 17,897.9 | 8.3 |
| Bird | 153.0 | 188.1 | 4.2 | 196.2 | 222.0 | 3.4 |
| Fish | 708.8 | 923.6 | 5.4 | 963.7 | 1,123.0 | 4.0 |
| Small Mammal/Reptile | 75.6 | 78.6 | 0.8 | 79.1 | 82.4 | 0.9 |
| Small Mammal/Reptile | 63.1 | 65.6 | 0.8 | 66.1 | 68.9 | 1.0 |
| Small Mammal/Reptile | 12.5 | 12.9 | 0.6 | 13.0 | 13.5 | 0.9 |
|
Source: Euromonitor International, 2023 *CAGR: Compound Annual Growth Rate |
||||||
India's dog ownership experienced a 7.1% increase in CAGR from 16.9 million households in 2018 to 23.9 million households in 2023, while the number of households owning cats also increased in growth by 5.6% from 1.3 million to 1.8 million during the same period.
| Category | 2018 | 2019 | 2020 | 2021 | 2022 | 2023 | CAGR* % 2018-2023 |
|---|---|---|---|---|---|---|---|
| % Households owning a cat | 0.5 | 0.5 | 0.5 | 0.5 | 0.6 | 0.6 | 3.7 |
| Households owning a cat | 1,340.9 | 1,413.1 | 1,494.3 | 1,571.0 | 1,678.6 | 1,759.6 | 5.6 |
| % Households owning a dog | 6.0 | 6.5 | 7.1 | 7.4 | 7.7 | 7.9 | 5.7 |
| Households owning a dog | 16,984.9 | 18,775.6 | 20,769.2 | 21,935.1 | 23,080.8 | 23,967.6 | 7.1 |
|
Source: Euromonitor International, 2023 *CAGR: Compound Annual Growth Rate |
|||||||
Retail market size
Global retail sales overview of pet food (products)
Global retail sales of pet food have increased moderately in CAGR by 9.7% from US$84.4 billion in 2018 to US$134.0 billion in 2023 and are expected to increase at an additional CAGR of 6.7% as retail sales attain US$185.8 billion by 2028. The United States (U.S) was the largest global retail market for pet food with sales of US$53.2 billion (39.7% market share), followed by Brazil with values of US$8.0 billion (6.0% market share) and China, with retail sales of US$7.6 billion (5.7% market share) in 2023.
India was the twenty-eighth largest global retail sales market for pet food with values of US$629.6 million, representing a 0.5% market share in 2023. India experienced a significant increase in CAGR of 20.7% as retail sales grew from US$245.4 million in 2018 and are expected to further improve with the greatest increase in CAGR (15.0%) of the top markets in the forecast period, as retail sales are anticipated to reach US$1.3 billion by 2028. In comparison, Canada was the seventh largest retail sales market for pet food, accounting for a 3.3% retail sale market share with values of US$4.4 billion in 2023, representing an increase of 8.3% from US$2.9 billion in 2018. Similarly, Canada is also expected to achieve positive growth, increasing by 6.2% in the forecast period as retail sales attain US$6.0 billion by 2028.
| Geography | 2018 | 2023 | CAGR* % 2018-2023 | 2024 | 2028 | CAGR* % 2023-2028 |
|---|---|---|---|---|---|---|
| World | 84,437.5 | 134,025.7 | 9.7 | 144,182.5 | 185,778.0 | 6.7 |
| United States | 33,393.7 | 53,232.3 | 9.8 | 55,820.1 | 65,032.7 | 4.1 |
| Brazil | 3,650.1 | 8,008.5 | 17.0 | 9,040.6 | 13,605.1 | 11.2 |
| China | 3,852.6 | 7,637.2 | 14.7 | 8,499.6 | 12,398.3 | 10.2 |
| United Kingdom | 4,468.0 | 5,451.8 | 4.1 | 5,682.4 | 6,284.3 | 2.9 |
| Russia | 2,344.9 | 4,621.8 | 14.5 | 5,080.5 | 6,690.1 | 7.7 |
| Germany | 3,562.9 | 4,508.0 | 4.8 | 4,752.8 | 5,449.4 | 3.9 |
| Canada (7) | 2,959.5 | 4,401.3 | 8.3 | 4,679.1 | 5,950.7 | 6.2 |
| France | 3,581.0 | 4,400.2 | 4.2 | 4,589.8 | 5,209.7 | 3.4 |
| India | 3,527.8 | 4,240.9 | 3.8 | 4,347.9 | 4,700.5 | 2.1 |
| Italy | 2,615.7 | 3,357.3 | 5.1 | 3,546.6 | 4,203.8 | 4.6 |
| India (28) | 245.4 | 629.6 | 20.7 | 730.1 | 1,268.8 | 15.0 |
|
Source: Euromonitor International, 2023 *CAGR: Compound Annual Growth Rate |
||||||
Retail sales overview of pet food (products) in India
Pet care in India displayed strong value growth in 2023, driven by the pet humanisation trend and greater accessibility to pet food and pet products. Further, increasing awareness of the importance of good nutrition is set to advance growth in prepared dog and cat food, particularly for premium food (premiumization), as rising disposable incomes paired with premium products' nutritious ingredients and health claims, help strengthen product demand. Increasing inflation however, has also heightened demand for the mid-priced and economy segments of dog and cat food (Euromonitor International; Pet Care in India, July 2023).
The largest category of pet food in India, in terms of retail value sales in 2023, was dog food with values of US$539.0 million (85.6% market share) increasing in growth by 19.6% from US$220.3 million in 2018, followed by cat food with values of US$89.8 million (14.3% market share), representing the largest increase in CAGR (29.5%) from retail sales of US$24.7 million in 2018.
Growth in India's pet food as a category is expected to remain positive, at 15.0%, as retail value sales are projected to reach US$1.3 billion by 2028, as the Indian economy and consumer's standard of living continue to improve.
| Category | 2018 | 2023 | CAGR* % 2018-2023 | 2024 | 2028 | CAGR* % 2023-2028 |
|---|---|---|---|---|---|---|
| Pet Food | 245.4 | 629.6 | 20.7 | 730.1 | 1,268.8 | 15.0 |
| Cat Food | 24.7 | 89.8 | 29.5 | 108.4 | 216.2 | 19.2 |
| Dog Food | 220.3 | 539.0 | 19.6 | 620.7 | 1,051.3 | 14.3 |
| Bird Food | 0.1 | 0.2 | 14.9 | 0.3 | 0.4 | 14.9 |
| Fish Food | 0.3 | 0.5 | 10.8 | 0.6 | 0.9 | 12.5 |
| Small Mammal/Reptile Food | 0.0 | 0.0 | N/C | 0.0 | 0.0 | N/C |
|
Source: Euromonitor International, 2023 *CAGR: Compound Annual Growth Rate N/C: not calculable |
||||||
Competitive landscape
Mars Inc and Indian Broiler Group were the two largest pet food companies in India representing a combined market share of 66.9% in 2022. In terms of retail sales, Mars International India PVT LTD (Brand names; Pedigree, Royal Canin, Whiskas, Eukanuba, Sheba and Chappi) led sales, attaining values of US$281.5 million in 2022. The company's success is attributed to its wide distribution network and strong brand presence among local pet owners, providing consumers with various product pack sizes and formats according to pet and breed. Indian Broiler Group (Brand names; Drools and Purepet), India's second largest pet food company, attained retail values of US$79.2 million in 2022, strengthening its positioning in pet care by recently expanding its production capacity in India (Euromonitor International; Pet Care in India, July 2023).
Private label companies in comparison, continue to show a measured presence in the pet food market with retail sales of US$2.2 million (0.4% market share) in 2022, despite increasing in CAGR by 16.4% from retail sales of US$1.0 million in 2017.
| Company | Retail sales (US$ millions) | Market share % |
|---|---|---|
| Total | 538.8 | 100.0 |
| Mars Inc | 281.5 | 52.2 |
| Indian Broiler Group | 79.2 | 14.7 |
| Charoen Pokphand Group | 17.7 | 3.3 |
| Stylam Sydney | 11.9 | 2.2 |
| Nestlé SA | 8.0 | 1.5 |
| Russo Mangimi SpA | 7.4 | 1.4 |
| Glenands Group | 3.2 | 0.6 |
| Colgate-Palmolive Co | 2.9 | 0.5 |
| Creative Pet Products Co | 0.9 | 0.2 |
| Avanti Pvt Ltd | 0.8 | 0.1 |
| Private Label | 2.2 | 0.4 |
| Others | 122.2 | 22.7 |
|
Source: Euromonitor International, 2023 a: latest company share data available to 2022 |
||
Distribution channels
The majority of India's pet food market is distributed through non-grocery retailers (pet shops and superstores), representing US$312.0 million (49.6% market share), while remaining sales are distributed through non-retail (veterinary clinics) channels with values of US$199.6 million (31.7% market share) and retail online (e-commerce) channels representing US$91.5 million (14.5% market share) in 2022.
E-commerce sales have increased (accelerated initially by the pandemic) however, the channel is expected to remain relevant in the forecast period as leading manufacturers such as Mars and Royal Canin for example, are increasingly partnering with prominent e-commerce companies in India (Amazon, Flipkart and BigBasket) to sell their products and reinforce their online presence (Euromonitor International; Pet Care in India, July 2023).
| Outlet Type | 2018 | 2023 | ||
|---|---|---|---|---|
| Actual | Share | Actual | Share | |
| Distribution Channel (Total) | 245.4 | 100.0 | 629.6 | 100.0 |
| Retail Channels | 162.2 | 66.1 | 429.9 | 68.3 |
| Retail Offline | 151.3 | 61.7 | 338.4 | 53.7 |
| Grocery Retailers | 10.5 | 4.3 | 24.1 | 3.8 |
| Hypermarkets | 4.9 | 2.0 | 11.1 | 1.8 |
| Supermarkets | 3.4 | 1.4 | 8.5 | 1.4 |
| Small Local Grocers | 2.2 | 0.9 | 4.5 | 0.7 |
| Non-Grocery Retailers | 140.8 | 57.4 | 314.3 | 49.9 |
| Home Products Specialists | 140.4 | 57.2 | 312.0 | 49.6 |
| Pet Shops and Superstores | 140.4 | 57.2 | 312.0 | 49.6 |
| Health and Beauty Specialists | 0.4 | 0.2 | 2.2 | 0.3 |
| Retail E-Commerce | 10.8 | 4.4 | 91.5 | 14.5 |
| Non-retail channels | 83.2 | 33.9 | 199.6 | 31.7 |
| Veterinary clinics | 83.2 | 33.9 | 199.6 | 31.7 |
| Source: Euromonitor International, 2023 | ||||
Market segmentation
Dog food
According to Euromonitor International, the dependence on home-cooked food for dogs is great, especially amongst pet owners beyond tier-1 cities. As such, the percentage of pet owners that feed prepared food to their dogs remains low as most pet owners have limited knowledge of the nutritional requirements of their pets. To address this, leading manufacturers such as Mars (Pedigree, Eukanuba, Chappi) and Indian Broiler Group (Drools) have launched digital campaigns to educate customers about the nutritional requirements of dogs, and the benefits of prepared dog food. Further, the recent implementation (legislation) of the mandatory registration of household pets (to help mitigate pet abandonment and limit population), has served to create a greater awareness and appreciation for pet care, encouraging more pet owners to shift from home-cooked meals to prepared packaged food, which is set to continue to drive the growth of dog food (Euromonitor International; Dog Food in India, July 2023).
Dog food was the largest category in India's pet food market with retail sales of US$539.0 million (85.6% market share in 2023). The category grew significantly (19.6%) during the 2018-2023 period, increasing in retail sales from US$220.3 million in 2018. Dry dog food was the largest segment of the category with retail value sales of US$482.7 million (89.6% market share) in 2023. Of the dry dog food segment, all price point products performed well. Of note, economy food achieved the best performance, increasing in growth by 22.0% as retail sales increased from US$129.2 million in 2018 to US$348.7 million in 2023 (+18.2% from US$295.0 million in 2022), while mid-priced and premium also increased in growth by 19.8% and 15.5% respectively, from 2018 to 2023.
Dog treats and mixers also experienced significant growth (16.5%) from US$24.0 million in 2018 to US$51.6 million in 2023 (+11.9% from US$46.1 million in 2022), due to the pet owner's increasing intent to care for, and bond more with their dogs (Euromonitor International; Dog Food in India, July 2023). Relatedly, the disposable incomes of households in India grew by a CAGR of 10% from 2019 to 2023, increasing the pet owners' ability to spend more on their pets while positionings such as dental care, snacks and special rewards and treats have gained popularity. In addition, with increasing awareness for pet health care, pet owners are anticipated to seek natural and organic dog treats that are free from artificial ingredients, preservatives and fillers (Euromonitor International; Dog Food in India, July 2023).
The overall dog food market is forecast to remain positive with a CAGR of 14.3% as retail sales are anticipated to reach US$1.1 billion by 2028. In the dog food competitive landscape, Mars Inc (Brand names: Pedigree, Royal Canin, Eukanuba and Chappi) led sales with a market share of 51.7%, followed by Indian Broiler Group (Brand name: Drools) with a market share of 14.7% and Stylam Sydney (Brand name: Stylam) with a market share of 2.6% in 2023.
Leading manufacturers in dog food traditionally focused on limited dry food products however, as consumer awareness regarding the nutritional benefits of prepared foods is increasing, manufactures have expanded their product ranges to include a variety of price point products that correspond to different breeds and life cycles to meet consumer demand. In comparison, private labels held a measured presence in the market attaining a 0.5% market share in 2023.
| Category | 2018 | 2019 | 2020 | 2021 | 2022 | 2023 |
|---|---|---|---|---|---|---|
| Dog Food | 220.3 | 260.6 | 326.0 | 397.2 | 464.8 | 539.0 |
| Dog Treats and Mixers | 24.0 | 28.4 | 34.0 | 40.4 | 46.1 | 51.6 |
| Dry Dog Food | 193.4 | 229.0 | 288.4 | 352.8 | 414.4 | 482.7 |
| Economy Dry Dog Food | 129.2 | 152.7 | 196.5 | 247.5 | 295.0 | 348.7 |
| Mid-Priced Dry Dog Food | 5.5 | 6.9 | 8.7 | 10.3 | 11.9 | 13.6 |
| Premium Dry Dog Food | 58.6 | 69.3 | 83.2 | 95.1 | 107.5 | 120.4 |
| Wet Dog Food | 2.9 | 3.2 | 3.6 | 4.0 | 4.4 | 4.8 |
| Mid-Priced Wet Dog Food | 2.9 | 3.2 | 3.6 | 4.0 | 4.4 | 4.8 |
| Source: Euromonitor International, 2023 | ||||||
| Category | Annual growth % 2022-2023 | CAGR* % 2018-2023 | Total growth % 2018-2023 |
|---|---|---|---|
| Dog Food | 16.0 | 19.6 | 144.7 |
| Dog Treats and Mixers | 11.9 | 16.5 | 115.0 |
| Dry Dog Food | 16.5 | 20.1 | 149.6 |
| Economy Dry Dog Food | 18.2 | 22.0 | 169.9 |
| Mid-Priced Dry Dog Food | 14.3 | 19.8 | 147.3 |
| Premium Dry Dog Food | 12.0 | 15.5 | 105.5 |
| Wet Dog Food | 9.1 | 10.6 | 65.5 |
| Mid-Priced Wet Dog Food | 9.1 | 10.6 | 65.5 |
|
Source: Euromonitor International, 2023 *CAGR: Compound Annual Growth Rate |
|||
| Company | Retail sales (US$ millions) | Market share % |
|---|---|---|
| Total | 464.8 | 100.0 |
| Mars Inc | 240.4 | 51.7 |
| Indian Broiler Group | 68.2 | 14.7 |
| Stylam Sydney | 11.9 | 2.6 |
| Nestlé SA | 7.0 | 1.5 |
| Russo Mangimi SpA | 6.5 | 1.4 |
| Private Label | 2.2 | 0.5 |
| Source: Euromonitor International, 2023 | ||
| Category | 2024 | 2025 | 2026 | 2027 | 2028 |
|---|---|---|---|---|---|
| Dog Food | 620.7 | 711.6 | 812.2 | 924.6 | 1,051.3 |
| Dog Treats and Mixers | 57.3 | 63.0 | 68.8 | 74.7 | 80.8 |
| Dry Dog Food | 558.3 | 643.0 | 737.5 | 843.5 | 963.6 |
| Economy Dry Dog Food | 408.6 | 476.5 | 552.7 | 638.9 | 737.3 |
| Mid-Priced Dry Dog Food | 15.5 | 17.4 | 19.5 | 21.8 | 24.3 |
| Premium Dry Dog Food | 134.2 | 149.1 | 165.2 | 182.7 | 201.9 |
| Wet Dog Food | 5.2 | 5.6 | 6.0 | 6.4 | 6.9 |
| Mid-Priced Wet Dog Food | 5.2 | 5.6 | 6.0 | 6.4 | 6.9 |
| Source: Euromonitor International, 2023 | |||||
| Category | Annual growth % 2023-2024 | CAGR* % 2023-2028 | Total growth % 2023-2028 |
|---|---|---|---|
| Dog Food | 15.2 | 14.3 | 95.0 |
| Dog Treats and Mixers | 11.0 | 9.4 | 56.6 |
| Dry Dog Food | 15.7 | 14.8 | 99.6 |
| Economy Dry Dog Food | 17.2 | 16.2 | 111.4 |
| Mid-Priced Dry Dog Food | 14.0 | 12.3 | 78.7 |
| Premium Dry Dog Food | 11.5 | 10.9 | 67.7 |
| Wet Dog Food | 8.3 | 7.5 | 43.8 |
| Mid-Priced Wet Dog Food | 8.3 | 7.5 | 43.8 |
|
Source: Euromonitor International, 2023 *CAGR: Compound Annual Growth Rate |
|||
Cat food
Traditionally, cats have not been a popular choice for pet owners in India. Recent social media influences and campaigns however, have since helped to alter the perceptions of cats as pets. For instance, Whiskas launched a campaign entitled 'Bring Home Curiosity' during the pandemic to eliminate perceived notions and superstitions surrounding cats and communicated the playful and curious nature of cats instead, which led to a higher adoption rate of cats in the last few years. Relatedly, manufacturers promoted awareness campaigns on various social media platforms to educate consumers of the nutritional requirements of cats, which has led more consumers to gravitate towards prepared food (Euromonitor International; Cat Food in India, July 2023).
Cat food was the second largest pet food category in India with retail value sales of US$89.8 million (14.3% market share) in 2023. The category grew significantly by a CAGR of 29.5% during the 2018-2023 period, increasing from retail sales of US$24.7 million in 2018.
Dry cat food was the largest segment in terms of retail sales, with values of US$79.9 million (89.0% of cat food market share) in 2023, increasing in CAGR by 28.4% from US$22.9 million in 2018, while wet cat food was the best performing segment as retail sales increased by 40.6% from US$1.8 million in 2018 to US$9.9 million in 2023. Sales of wet cat food are expected to be bolstered by the increase in demand for premium products, which prior to 2021, was absent (+35.0% from US$3.4 million in 2021 to US$6.2 million in 2023). Mars Inc in particular, has aided growth in this segment by launching Sheba (a premium wet cat food brand) in 2021, offering multiple products and flavour variants and textures, to be incorporated as a special occasion meal for cats, eaten in between regular dry cat food (Euromonitor International; Cat Food in India, July 2023).
Within the dry cat food segment, mid-priced food attained the largest retail value sales (US$50.1 million in 2023), while economy food experienced the best performance, increasing in growth by 43.9%% from US$3.4 million in 2018 to US$21.0 million in 2023 (+22.8% from US$17.1 million in 2022). Premium cat food has also experienced substantial recent growth, increasing 29.4% from US$6.8 million in 2022 to US$8.8 million in 2023.
The cat food market, though relatively nascent, is forecast to increase in growth by 19.2%, as retail sales are anticipated to reach US$216.2 million by 2028, as more companies expand their product portfolios to initiate product trials and ultimately strengthen regular consumption. In addition, with the expected continued growth in digital campaigns illustrating the advantages and nutritional requirements of cats as pets, the prospect of greater growth in cat food as a segment, is expected (Euromonitor International; Cat Food in India, July 2023).
In the cat food market competitive landscape, Mars Inc (Brand names: Whiskas, Royal Canin, Sheba and Iams) led sales with a market share of 56.1%, followed by Charoen Pokphand Group (Brand name: Me-O) with a market share of 16.9% and Indian Broiler Group (Brand names: Drools and Purepet) with a market share of 14.9% in 2023. Further, as cat food in India remains largely dominated by a few brands, acquisitions can intensify a brands exposure and address consumer need through a wide variety of portfolio products. Purina Pet Care India for example, experienced significant increases in sales (+110.0%) from 2021 to its acquisition by Nestlé India in July 2022, as Purina Pet Care now has access to a greater distribution network and marketing campaign (Euromonitor International; Cat Food in India, July 2023). Euromonitor International also notes the importance of veterinarians as a trusted source for cat health and nutrition information by owners. As such, those brands wishing to increase their exposure and sales to largely brand loyal consumers may consider working (partnering) with key veterinarians to access existing or new consumers (Euromonitor International; Cat Food in India, July 2023).
| Category | 2018 | 2019 | 2020 | 2021 | 2022 | 2023 |
|---|---|---|---|---|---|---|
| Cat Food | 24.7 | 28.6 | 38.6 | 57.3 | 73.3 | 89.8 |
| Cat Treats and Mixers | ||||||
| Dry Cat Food | 22.9 | 26.5 | 36.3 | 51.4 | 65.4 | 79.9 |
| Economy Dry Cat Food | 3.4 | 4.1 | 6.4 | 12.7 | 17.1 | 21.0 |
| Mid-Priced Dry Cat Food | 17.0 | 19.3 | 25.9 | 33.8 | 41.5 | 50.1 |
| Premium Dry Cat Food | 2.5 | 3.2 | 4.0 | 4.9 | 6.8 | 8.8 |
| Wet Cat Food | 1.8 | 2.0 | 2.3 | 6.0 | 7.9 | 9.9 |
| Economy Wet Cat Food | ||||||
| Mid-Priced Wet Cat Food | 1.8 | 2.0 | 2.3 | 2.5 | 3.1 | 3.8 |
| Premium Wet Cat Food | 3.4 | 4.8 | 6.2 | |||
| Source: Euromonitor International, 2023 | ||||||
| Category | Annual growth % 2022-2023 | CAGR* % 2018-2023 | Total growth % 2018-2023 |
|---|---|---|---|
| Cat Food | 22.5 | 29.5 | 263.6 |
| Cat Treats and Mixers | |||
| Dry Cat Food | 22.2 | 28.4 | 248.9 |
| Economy Dry Cat Food | 22.8 | 43.9 | 517.6 |
| Mid-Priced Dry Cat Food | 20.7 | 24.1 | 194.7 |
| Premium Dry Cat Food | 29.4 | 28.6 | 252.0 |
| Wet Cat Food | 25.3 | 40.6 | 450.0 |
| Economy Wet Cat Food | |||
| Mid-Priced Wet Cat Food | 22.6 | 16.1 | 111.1 |
| Premium Wet Cat Food | 29.2 | 35.0 (2021-2023) | 82.4 (2021-2023) |
|
Source: Euromonitor International, 2023 *CAGR: Compound Annual Growth Rate |
|||
| Company | Retail sales (US$ millions) | Market share % |
|---|---|---|
| Total | 73.3 | 100.0 |
| Mars Inc | 41.1 | 56.1 |
| Charoen Pokphand Group | 12.4 | 16.9 |
| Indian Broiler Group | 10.9 | 14.9 |
| Nestlé SA | 1.0 | 1.4 |
| Russo Mangimi SpA | 0.9 | 1.2 |
| Source: Euromonitor International, 2023 | ||
| Category | 2024 | 2025 | 2026 | 2027 | 2028 |
|---|---|---|---|---|---|
| Cat Food | 108.4 | 129.7 | 154.3 | 182.8 | 216.2 |
| Cat Treats and Mixers | |||||
| Dry Cat Food | 96.3 | 115.1 | 136.8 | 162.0 | 191.6 |
| Economy Dry Cat Food | 25.5 | 30.7 | 36.9 | 44.2 | 52.8 |
| Mid-Priced Dry Cat Food | 59.9 | 71.2 | 84.2 | 99.2 | 116.7 |
| Premium Dry Cat Food | 10.9 | 13.1 | 15.7 | 18.6 | 22.1 |
| Wet Cat Food | 12.1 | 14.7 | 17.5 | 20.8 | 24.6 |
| Economy Wet Cat Food | |||||
| Mid-Priced Wet Cat Food | 4.5 | 5.3 | 6.3 | 7.4 | 8.8 |
| Premium Wet Cat Food | 7.7 | 9.3 | 11.2 | 13.3 | 15.8 |
| Source: Euromonitor International, 2023 | |||||
| Category | Annual growth % 2023-2024 | CAGR* % 2023-2028 | Total growth % 2023-2028 |
|---|---|---|---|
| Cat Food | 20.7 | 19.2 | 140.8 |
| Cat Treats and Mixers | |||
| Dry Cat Food | 20.5 | 19.1 | 139.8 |
| Economy Dry Cat Food | 21.4 | 20.2 | 151.4 |
| Mid-Priced Dry Cat Food | 19.6 | 18.4 | 132.9 |
| Premium Dry Cat Food | 23.9 | 20.2 | 151.1 |
| Wet Cat Food | 22.2 | 20.0 | 148.5 |
| Economy Wet Cat Food | |||
| Mid-Priced Wet Cat Food | 18.4 | 18.3 | 131.6 |
| Premium Wet Cat Food | 24.2 | 20.6 | 154.8 |
|
Source: Euromonitor International, 2023 *CAGR: Compound Annual Growth Rate |
|||
Other pet food
Other pet food grew a moderate rate of 9.9% from retail ales of US$0.5 million in 2018 to US$0.8 million in 2023. Pet owners who adopt other pets (namely birds, small mammals/reptiles and fish) are limited due to the number of authentic centres available for the adoption of these pets. In addition, consumers are not always aware of the legal procedures and processes required for adopting these pets, creating a barrier to their adoption. Of note, those who do adopt these pets are price-conscious and have a limited understanding of the nutritional requirements when selecting and buying food for their pets (Euromonitor International; Other Pet Food in India, July 2023).
Fish food was the largest segment of the other pet food category with retail sales of US$0.5 million (62.5% market share) in 2023, increasing in growth by 10.8% from US$0.3 million in 2018, while bird food was the best performing segment, increasing in CAGR by 14.9% from US$0.1 million in 2018 to US$0.2 million (25.0% market share) in 2023. Fish food remains dominant in the other pet food category due to the convenience and low maintenance aspects of owning a fish as a pet.
The other pet food market is forecast to increase at a growth rate of 10.2% as retail sales are anticipated to reach US$1.3 million by 2028. Other pet food as a category is expected to remain niche due to the inherent challenges of other pet adoptions as well as the proper identification of those legal other pets permitted to be adopted. For instance, some species of tortoise are not legal to own in India, as owning Indian star tortoises and red-ear sliders is banned under the Wildlife Protection Act. Since most consumers cannot differentiate between similar species, adoption and ownerships of other pets is expected to remain low in India (Euromonitor International; Other Pet Food in India, July 2023).
Other pet food remains a highly fragmented and competitive landscape. Tropical Industry (Brand name: Taiyo) led sales with a market share of 14.3%, followed by Vitakraft Pet Care GmbH & Co KG (Brand name: Sun Seed) with a market share of 14.3% and Pacific Blue Taiwan (Brand name: Toto) also with a market share of 14.3% in 2023. Pet shops and superstores are set to remain the most popular distribution channel going forward however, the convenience of e-commerce is likely to also remain relevant as an alternative source for other pet food distribution.
| Category | 2018 | 2019 | 2020 | 2021 | 2022 | 2023 |
|---|---|---|---|---|---|---|
| Other Pet Food | 0.5 | 0.5 | 0.5 | 0.6 | 0.7 | 0.8 |
| Bird Food | 0.1 | 0.1 | 0.2 | 0.2 | 0.2 | 0.2 |
| Fish Food | 0.3 | 0.4 | 0.4 | 0.4 | 0.5 | 0.5 |
| Small Mammal/Reptile Food | 0.0 | 0.0 | 0.0 | 0.0 | 0.0 | 0.0 |
| Source: Euromonitor International, 2023 | ||||||
| Category | Annual growth % 2022-2023 | CAGR* % 2018-2023 | Total growth % 2018-2023 |
|---|---|---|---|
| Other Pet Food | 14.3 | 9.9 | 60.0 |
| Bird Food | 0.0 | 14.9 | 100.0 |
| Fish Food | 0.0 | 10.8 | 66.7 |
| Small Mammal/Reptile Food | N/C | N/C | N/C |
|
Source: Euromonitor International, 2023 *CAGR: Compound Annual Growth Rate N/C: Not calculable |
|||
| Company | Retail sales (US$ millions) | Market share % |
|---|---|---|
| Total | 0.7 | 100.0 |
| Tropical Industry | 0.1 | 14.3 |
| Vitakraft Pet Care GmbH & Co KG | 0.1 | 14.3 |
| Pacific Blue Taiwan | 0.1 | 14.3 |
| Indian Broiler Group | 0.0 | 0.0 |
| Spectrum Brands Holdings Inc | 0.0 | 0.0 |
| Source: Euromonitor International, 2023 | ||
| Category | 2024 | 2025 | 2026 | 2027 | 2028 |
|---|---|---|---|---|---|
| Other Pet Food | 0.9 | 1.0 | 1.1 | 1.2 | 1.3 |
| Bird Food | 0.3 | 0.3 | 0.3 | 0.4 | 0.4 |
| Fish Food | 0.6 | 0.7 | 0.7 | 0.8 | 0.9 |
| Small Mammal/Reptile Food | 0.0 | 0.0 | 0.0 | 0.0 | 0.0 |
| Source: Euromonitor International, 2023 | |||||
| Category | Annual growth % 2023-2024 | CAGR* 2023-2028 | Total growth % 2023-2028 |
|---|---|---|---|
| Other Pet Food | 12.5 | 10.2 | 62.5 |
| Bird Food | 50.0 | 14.9 | 100.0 |
| Fish Food | 20.0 | 12.5 | 80.0 |
| Small Mammal/Reptile Food | N/C | N/C | N/C |
|
Source: Euromonitor International, 2023 *CAGR: Compound Annual Growth Rate N/C: Not calculable |
|||
Trade overview
India pet food import requirements
To prevent the entry of any Exotic Livestock Diseases into India through the importation of livestock and livestock products, the provisions of the Livestock Importation Act, 1898, are in operation. (Food Safety Standards Authority of India [FSSAI], Government of India; Food Regulatory Portal - Regulatory Requirements and Procedure for Food Imports).
The import of livestock products to India are permitted and subject to Sanitary Import Permits (SIPs), as per the provisions of the Livestock Importation act, 1898. A Sanitary Import Permit is not a licence, but a certificate confirming India's sanitary requirements for livestock products including; meat and products of all kinds of including fresh, chilled and frozen meat, tissue or poultry, pig, sheep and goat, egg and egg powder, milk and milk products, bovine, ovine and caprine embryos, ova or semen; and pet food products of animal origin. (Food Safety Standards Authority of India [FSSAI], Government of India]; Food Regulatory Portal - Regulatory Requirements and Procedure for Food Imports).
Imports of animal and animal products are only allowed through the designated seaports/airports of Bangalore, Chennai, Delhi, Hyderabad, Kolkata, and Mumbai where animal quarantine and certification services are available. Imports of fish products are allowed through the seaport of Vishakhapatnam (in the State of Andhra Pradesh), Sea and airport of Kochi and the Land Custom Station at Petra pole (for imports from Bangladesh only). (Food Safety Standards Authority of India [FSSAI], Government of India; Food Regulatory Portal - Regulatory Requirements and Procedure for Food Imports).
(Excerpts from Pet Webinar; Pet Food Import Requirements - India, Dr. Mwate Mulenga, Counsellor Agriculture and Technical Specialist Abroad - CFIA, August 29, 2022)
Given the expected growth of the pet food market in India, Canadian producers have an opportunity to expand their exports and products within the Indian pet food sector. That said, it is important for Canadian suppliers to work closely with their importing partners and Trade Commissioners to understand and ensure that India's import requirements for their specific products are met.
India's pet food import market
India is a net importer of pet food. In 2022, India imported US$144.1 million (+33.6% in annual growth from US$45.3 million in 2018) and exported US$63.7 million in pet food, recording a trade deficit of US$80.4 million. The top three suppliers of pet food to India were Thailand with values of US$82.9 million (57.5% market share), followed by South Africa with values of US$20.4 million (14.2% market share) and Italy with values of US$10.5 million (7.3% market share). Canada in comparison, was India's eighth largest supplier of pet food providing US$2.3 million (1.6% market share) in 2022, representing a significant increase in annual growth (31.1%) from US$0.8 million in 2018. Of note, Italy and Thailand experienced the largest increases in annual growth (47.5% and 44.2% respectively) from 2018 to 2022, while France experienced a decline in annual growth (9.4%) during the same period. Indonesia has also experienced a substantial increase in annual growth (60.8%) as their pet food supply to India grew from US$2.9 million in 2021 to US$4.6 million in 2022. More recently, France and the United Kingdom have experienced positive growth (70.9% and 32.7% respectively), recording increases in their supply values from 2022 to year-to-date (October 2023).
| Country | 2018 | 2019 | 2020 | 2021 | 2022 | CAGR* % 2018-2022 | Market share % in 2022 | 2023 (January to October) |
|---|---|---|---|---|---|---|---|---|
| World (Total) | 45.3 | 58.1 | 68.0 | 118.2 | 144.1 | 33.6 | 100.0 | 103.3 |
| Thailand | 19.2 | 27.2 | 34.3 |
62.3 |
82.9 | 44.2 | 57.5 | 59.3 |
| South Africa | 6.2 | 9.4 | 12.0 | 19.2 | 20.4 | 34.8 | 14.2 | 9.8 |
| Italy | 2.2 | 2.5 | 4.3 | 6.1 | 10.5 | 47.5 | 7.3 | 5.0 |
| France | 8.3 | 7.3 | 4.0 | 1.0 | 5.6 | −9.4 | 3.9 | 9.6 |
| Indonesia | 2.9 | 4.6 | 60.8 (2021-2022) | 3.2 | 4.0 | |||
| China | 1.0 | 1.2 | 1.4 | 2.4 | 3.1 | 33.7 | 2.1 | 3.0 |
| Spain | 1.8 | 3.2 | 5.2 | 6.3 | 2.7 | 10.1 | 1.9 | 1.5 |
| Canada (8) | 0.8 | 1.1 | 1.0 | 2.4 | 2.3 | 31.1 | 1.6 | 1.9 |
| Hungary | 0.6 | 0.7 | 0.9 | 1.8 | 1.7 | 31.7 | 1.2 | 1.2 |
| United Kingdom | 0.6 | 0.7 | 0.8 | 1.3 | 1.5 | 26.0 | 1.0 | 1.9 |
|
Source: Global Trade Tracker, 2024 *CAGR: Compound Annual Growth Rate |
||||||||
Dog and cat food (HS code 230910) is India's largest pet food import with values of US$144.1 million, representing a 100.0% market share in 2022. Canary seed was imported in 2020 and recorded values of US$1,244.
| HS Code | Description | 2018 | 2019 | 2020 | 2021 | 2022 | CAGR* % 2018-2022 | Market share % in 2022 | 2023 (January to October) |
|---|---|---|---|---|---|---|---|---|---|
| Pet Food (Total) | 45.3 | 58.1 | 68.0 | 118.2 | 144.1 | 33.6 | 100.0 | 103.3 | |
| 230910 | dog or cat food | 45.3 | 58.1 | 68.0 | 118.2 | 144.1 | 33.6 | 100.0 | 103.3 |
| 100830 | canary seed | 0.0 | 0.0 | −99.9 | 0.0 | 0.0 | |||
|
Source: Global Trade Tracker, 2024 *CAGR: Compound Annual Growth Rate |
|||||||||
| Category | 2018 | 2019 | 2020 | 2021 | 2022 | CAGR* % 2018-2022 | |
|---|---|---|---|---|---|---|---|
| India's imports from the World | 45.3 | 58.1 | 68.0 | 118.2 | 144.1 | 33.6 | |
| India' imports from Canada | 0.8 | 1.1 | 1.0 | 2.4 | 2.3 | 31.1 | |
| Supply gap | 44.5 | 57.0 | 43.5 | 115.8 | 141.8 | 33.6 | |
|
Source: Global Trade Tracker, 2024 *CAGR: Compound Annual Growth Rate |
|||||||
Canada's performance
Canada's export market
Similar to India, Canada is a net importer of pet foods. In 2022, Canada recorded a pet food trade deficit of US$345.5 million with imports of US$1.3 billion, and exports valued at US$913.4 million (+10.9% annually from exports of US$604.4 million in 2018).
Canada's pet food exports to global markets included dog or cat food (HS code: 230910) with values of US$786.7 million (86.1% market share) and canary seed (HS code: 100830) valued at US$126.6 million (13.9% market share) in 2022.
The U.S was the largest market for Canadian pet food exports with values of US$382.3 million (41.9% market share) followed by China with values of US$93.5 million (10.2% market share) and Mexico with values of US$37.1 million (4.1% market share) in 2022. India in comparison, was the fortieth largest export market for Canadian pet foods with values of US$2.5 million (0.3% market share) in 2022, experiencing the largest increase in annual growth (31.5%) from US$0.8 million in 2018. Top global pet food supplying Canadian provinces were Ontario (41.9% market share), Alberta (26.0% market share), British Columbia (11.7% market share), Saskatchewan (10.0% market share) and Québec (9.7% market share) in 2022. Top pet food supplying provinces to India were Alberta (95.0% market share), Ontario (2.3% market share) Saskatchewan (2.0% market share) and Nova Scotia (1.0% market share) in 2022.
| Country | 2018 | 2019 | 2020 | 2021 | 2022 | CAGR* % 2018-2022 | Market share % in 2022 | 2023 (January to October) |
|---|---|---|---|---|---|---|---|---|
| World (Total) | 604.4 | 683.7 | 838.1 | 956.0 | 913.4 | 10.9 | 100.0 | 669.7 |
| United States | 247.2 | 251.0 | 297.6 | 339.7 | 382.3 | 11.5 | 41.9 | 336.0 |
| China | 34.4 | 85.3 | 172.7 | 184.5 | 93.5 | 28.4 | 10.2 | 37.0 |
| Mexico | 25.5 | 28.5 | 36.9 | 40.1 | 37.1 | 9.8 | 4.1 | 28.3 |
| Spain | 16.1 | 19.3 | 19.3 | 26.1 | 35.3 | 21.7 | 3.9 | 21.5 |
| Korea | 13.4 | 16.6 | 17.9 | 29.3 | 28.1 | 20.3 | 3.1 | 17.7 |
| Taiwan | 13.8 | 15.1 | 14.8 | 15.3 | 25.0 | 16.0 | 2.7 | 17.9 |
| Netherlands | 8.3 | 12.6 | 13.0 | 20.7 | 21.7 | 27.0 | 2.4 | 20.3 |
| Japan | 24.1 | 17.8 | 17.2 | 22.3 | 18.9 | −5.9 | 2.1 | 18.9 |
| Italy | 8.8 | 11.3 | 11.5 | 14.7 | 18.0 | 19.6 | 2.0 | 14.5 |
| Hong Kong | 14.4 | 12.4 | 29.2 | 21.9 | 17.4 | 5.0 | 1.9 | 9.0 |
| India (40) | 0.8 | 1.1 | 1.4 | 2.7 | 2.5 | 31.5 | 0.3 | 0.9 |
|
Source: Global Trade Tracker, 2024 *CAGR: Compound Annual Growth Rate |
||||||||
Product launch analysis
According to Mintel's Global New Products Database (GNPD), there were 1,139 new pet food products launched in India between January 2018 and October 2023. The number of yearly product launches has declined slightly in growth by a CAGR of 1.8% from 226 pet products in 2018 to 210 pet products in 2022.
Dog snacks and treats, and dog food dry, and wet, were top subcategories of newly released pet food product launches while vitamin/mineral fortified, no additives/preservatives and teeth and tartar prevention were top claims associated with new pet food products released during the prescribed period.
The companies with the highest number of new product launches were Abis Exports (77 products), followed by Mars Petcare (46 products) and Mars International (39 products). Just under half (46.9%) of the new product launches were new products (534 products) whereas 33.3% were new variety/range extension (379 products). Top packaging types included flexible stand-up pouch (445 products), flexible (388 products) and flexible sachet (103 products). Top flavours were chicken (201 products), followed by unflavoured/plain (155 products), tuna (45 products), milk (33 products) and chicken and liver (25 products).
| Product attributes | Yearly launch counts | Total | |||||
|---|---|---|---|---|---|---|---|
| 2018 | 2019 | 2020 | 2021 | 2022 | 2023 (January to October) | ||
| Yearly product launches | 226 | 230 | 151 | 141 | 210 | 181 | 1,139 |
| Top subcategories | |||||||
| Dog snacks and treats | 107 | 143 | 75 | 69 | 99 | 77 | 570 |
| Dog food dry | 43 | 29 | 17 | 21 | 21 | 37 | 168 |
| Dog food wet | 19 | 16 | 23 | 6 | 23 | 20 | 107 |
| Cat food dry | 23 | 15 | 4 | 16 | 25 | 24 | 107 |
| Cat food wet | 18 | 20 | 18 | 18 | 14 | 13 | 101 |
| Top claims | |||||||
| Vitamin/mineral fortified | 90 | 71 | 55 | 42 | 76 | 67 | 401 |
| No additives/preservatives | 36 | 39 | 47 | 48 | 98 | 70 | 338 |
| Functional pet - teeth and tartar prevention | 77 | 77 | 44 | 38 | 49 | 47 | 332 |
| Functional pet - skin and coat | 67 | 55 | 42 | 48 | 62 | 58 | 332 |
| Functional pet - other | 81 | 69 | 42 | 31 | 58 | 44 | 325 |
| Top companies | |||||||
| Abis Exports | 24 | 20 | 12 | 14 | 6 | 1 | 77 |
| Mars Petcare | 0 | 6 | 9 | 8 | 16 | 7 | 46 |
| Mars International | 10 | 6 | 6 | 7 | 2 | 8 | 39 |
| Naughty Pet | 3 | 28 | 1 | 0 | 1 | 0 | 33 |
| Perfect Companion Group | 18 | 7 | 1 | 5 | 1 | 1 | 33 |
| Top price groupings (U.S dollars) | |||||||
| 0.14 - 6.13 | 184 | 194 | 113 | 102 | 176 | 141 | 910 |
| 6.14 - 12.13 | 30 | 24 | 27 | 30 | 25 | 24 | 160 |
| 12.14 - 18.13 | 8 | 6 | 5 | 3 | 7 | 10 | 39 |
| 18.14 - 24.13 | 4 | 5 | 5 | 5 | 2 | 4 | 25 |
| 24.14 - 34.00 | 0 | 1 | 0 | 1 | 0 | 2 | 4 |
| Imported status | |||||||
| Not imported | 20 | 12 | 23 | 45 | 46 | 43 | 189 |
| Imported | 61 | 54 | 26 | 20 | 38 | 39 | 238 |
| Top packaged types | |||||||
| Flexible stand-up pouch | 55 | 77 | 61 | 82 | 92 | 78 | 445 |
| Flexible | 109 | 77 | 41 | 40 | 70 | 51 | 388 |
| Flexible sachet | 23 | 17 | 11 | 3 | 19 | 30 | 103 |
| Jar | 14 | 41 | 10 | 6 | 10 | 13 | 94 |
| Can | 7 | 9 | 7 | 1 | 2 | 3 | 29 |
| Top launch types | |||||||
| New product | 95 | 100 | 77 | 77 | 98 | 87 | 534 |
| New variety/range extension | 81 | 72 | 51 | 29 | 81 | 65 | 379 |
| New packaging | 41 | 52 | 22 | 32 | 27 | 19 | 193 |
| Relaunch | 6 | 6 | 0 | 2 | 3 | 8 | 25 |
| New formulation | 3 | 0 | 1 | 1 | 1 | 2 | 8 |
| Top flavours (including blend) | |||||||
| Chicken | 44 | 37 | 22 | 29 | 42 | 27 | 201 |
| Unflavoured/plain | 39 | 41 | 21 | 16 | 22 | 16 | 155 |
| Tuna | 10 | 6 | 9 | 6 | 7 | 7 | 45 |
| Milk | 11 | 6 | 4 | 4 | 4 | 4 | 33 |
| Chicken and liver | 9 | 2 | 3 | 4 | 5 | 2 | 25 |
| Top ingredients | |||||||
| Chicken meat | 79 | 87 | 67 | 65 | 85 | 78 | 461 |
| Minerals | 84 | 81 | 33 | 36 | 63 | 54 | 351 |
| Vitamins | 76 | 60 | 33 | 36 | 66 | 58 | 329 |
| Preservatives | 44 | 61 | 30 | 40 | 58 | 49 | 282 |
| Food colours | 62 | 48 | 29 | 33 | 52 | 36 | 260 |
| Total Pack size | |||||||
| 100.00 grams | 15 | 17 | 8 | 14 | 23 | 21 | 98 |
| 70.00 grams | 13 | 20 | 7 | 17 | 24 | 7 | 88 |
| 1000.00 grams | 21 | 13 | 7 | 11 | 12 | 16 | 80 |
| 400.00 grams | 13 | 10 | 4 | 5 | 14 | 9 | 55 |
| 500.00 grams | 9 | 13 | 2 | 7 | 10 | 5 | 46 |
| Source: Mintel GNPD, 2024 | |||||||
| Sub-Category | Number of products | Average price per product (in US$) |
|---|---|---|
| Total | 1,139 | 4.55 |
| Dog Snacks and Treats | 570 | 3.59 |
| Dog Food Dry | 168 | 8.13 |
| Dog Food Wet | 107 | 2.81 |
| Cat Food Dry | 107 | 8.12 |
| Cat Food Wet | 101 | 3.57 |
| Other | 86 | 2.84 |
| Source: Mintel Global New Product Database (GNPD), 2024 | ||
Examples of new products
Berry Bites
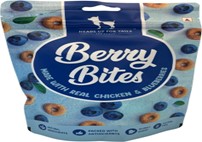
Source: Mintel Global New Products Database, 2024
| Company | CC Pet Foods |
|---|---|
| Brand | Heads Up for Tails |
| Category | Pet food |
| Sub-category | Dog snacks and treats |
| Market | India |
| Store type | Internet / Mail order |
| Date published | October 2023 |
| Launch type | New variety / range extension |
| Price in US dollars | 3.59 |
Heads Up for Tails Berry Bites are now available, and retail in a 140 gram pack. - Made with real chicken and blueberries - Natural ingredients- Packed with antioxidants - Slowly baked - Gluten free - All-natural treats made with limited, healthy ingredients - Perfect for training purposes or to be given as a snack - These bite sized treats have been slowly dehydrated to make them crunchy and to preserve maximum nutrition - Maintain healthy immunity - Promote dental hygiene - Improve bone health - Feeding instructions
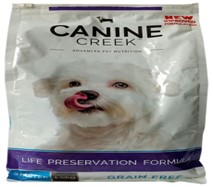
Grain Free Life Preservation Formula Starter Pet Food with Cage Free Chicken
Source: Mintel Global New Products Database, 2024
| Company | Abis Exports |
|---|---|
| Brand | Canine Creek Advanced Pet Nutrition |
| Category | Pet food |
| Sub-category | Dog food dry |
| Market | India |
| Store type | Specialist retailer |
| Date published | February 2022 |
| Launch type | New formulation |
| Price in US dollars | 10.58 |
Canine Creek Advanced Pet Nutrition Grain Free Life Preservation Formula Starter Pet Food with Cage Free Chicken is now available with and improved formulation, now enhanced with seven antioxidants: apples, blackberries, blueberries, cranberries, pomegranate, pumpkin and spinach, and retails in a 1.5 kilogram pack. The dog food is grain-free, contains 48% real meat of cage free chicken and cold formed life preservation kibbles. This pet food is said to be ideal for transition from milk. The nutritional response helps to facilitate the transition from mother's milk to solid food. Nutritional profile is specifically adapted for the mother dog's high energy needs at the end of gestation and during lactation. DHA, an important fatty acid found in mother's milk along with choline support healthy development of cognitive learning and retina function. It has an optimal balance of Omega 3 and Omega 6 fatty acids which help in developing a shiny coat and healthy skin. The essential vitamins, chelated minerals and combination of seven super antioxidants help support the immune system. This product is formulated in the United States.
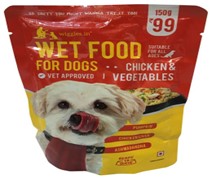
Chicken & Vegetables Wet Food for Dogs
Source: Mintel Global New Products Database, 2024
| Company | Sixth Sense Retail |
|---|---|
| Brand | Wiggles.in |
| Category | Pet food |
| Sub-category | Dog food wet |
| Market | India |
| Import status | Not imported |
| Store type | Internet / Mail order |
| Date published | November 2021 |
| Launch type | New product |
| Price in US dollars | 1.32 |
Wiggles.in Chicken and Vegetables Wet Food for Dogs is said to be suitable for all ages, and comprises pumpkin, chicken liver and ashwagandha. The vet approved product consists of human grade ingredients, is said to be a complete and balanced meal, contains infused prebiotics and antioxidants, and is good for skin and joints. This ready to serve product with an AAFCO Dog Food Nutrient Profile contains no artificial flavours, food fillers, GMO or preservatives, and retails in a 150 gram pack.
Salmon, Turkey & Chicken Recipe for Cat and Kitten

Source: Mintel Global New Products Database, 2024
| Company | Pawsitive Pets |
|---|---|
| Brand | Wag & Love |
| Category | Pet food |
| Sub-category | Cat food dry |
| Market | India |
| Import status | Imported product |
| Store type | Internet / Mail order |
| Date published | September 2020 |
| Launch type | New product |
| Price in US dollars | 14.80 |
Wag & Love Salmon, Turkey and Chicken Recipe for Cat and Kitten is said to be made using the goodness of premium meat, herbs and veggies, and to offer the following features: chicken, turkey and salmon eggs which are an excellent mix of lean proteins, vitamins, minerals for growth and wellbeing; chicken fat which is essential fatty acids that support healthy heart growth and maintenance; Norwegian salmon oil, salmon meat and flax seed that provide omega 3s, EPA, DHA to support healthy heart, shiny coat, anti-inflammatory, brain and vision; brewer's yeast that offers probiotics and rich source B vitamins to aid digestion; beet pulp and inulin (FOS) that offer probiotics and support colon health and digestion; basil and thyme that are ayurvedic herbs to offer anti-microbial, digestive and pro-health properties; zinc that is an anti-oxidant and promotes shiny coat; and taurine that supports healthy heart, digestion, vision and reproduction. The natural cat food is free from artificial preservatives, colours, flavours and GMO, is packed with nitrogen-flushed to preserve nutrients, and is metal coated to preserve aroma and palatability. It retails in a 1.6 kilogram pack featuring feeding guidelines.
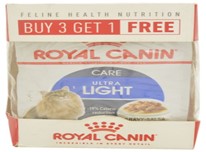
Care Ultra Light Thin Slices in Gravy
Source: Mintel Global New Products Database, 2024
| Company | Royal Canin |
|---|---|
| Brand | Royal Canin Feline Health Nutrition |
| Category | Pet food |
| Sub-category | Cat food wet |
| Market | India |
| Store type | Specialist retailer |
| Date published | April 2018 |
| Launch type | New packaging |
| Price in US dollars | 3.91 |
Royal Canin Feline Care Ultra Light Thin Slices in Gravy Complete Feed for Adult Cats has been repackaged with a new design. The product contains thin slices in gravy and has 19% less calories to promote the reduction of calorie intake for cats. The product also contains L-carnitine and retails in a pack containing four 85 gram wet pouches as part of buy one get one free promotion.
For more information
The Canadian Trade Commissioner Service:
International Trade Commissioners can provide Canadian industry with on-the-ground expertise regarding market potential, current conditions and local business contacts, and are an excellent point of contact for export advice.
More agri-food market intelligence:
International agri-food market intelligence
Discover global agriculture and food opportunities, the complete library of Global Analysis reports, market trends and forecasts, and information on Canada's free trade agreements.
Agri-food market intelligence service
Canadian agri-food and seafood businesses can take advantage of a customized service of reports and analysis, and join our email subscription service to have the latest reports delivered directly to their inbox.
More on Canada's agriculture and agri-food sectors:
Canada's agriculture sectors
Information on the agriculture industry by sector. Data on international markets. Initiatives to support awareness of the industry in Canada. How the department engages with the industry.
For information on upcoming trade shows such as the India International Pet Trade Fair (IIPTF), please contact:
Nitin Verma [he/him]
Counsellor (Agriculture and Food) and Trade Commissioner
High Commission of Canada
Government of Canada
CanadainIndia.Agri@international.gc.ca
Resources
- Euromonitor International, 2023
- Country Report: Pet Care in India, July 2023
- Country Report: Dog Food in India, July 2023
- Country Report: Cat Food in India, July 2023
- Country Report: Other Pet food in India, July 2023
- FSSAI (Food Safety Standards Authority of India), Government of India; Food Regulatory Portal - Regulatory Requirements and Procedure for Food Imports)
- Global Trade Tracker, 2024
- Mintel Global New Products Database, 2024
- Pet Webinar; Pet Food Import Requirements – India, Dr. Mwate Mulenga, Counsellor Agriculture & Technical Specialist Abroad – CFIA, August 29, 2022
Sector Trend Analysis – Pet food trends in India
Global Analysis Report
Prepared by: Laurie Bernardi, International Market Research Analyst
© His Majesty the King in Right of Canada, represented by the Minister of Agriculture and Agri-Food (2024).
Photo credits
All photographs reproduced in this publication are used by permission of the rights holders.
All images, unless otherwise noted, are copyright His Majesty the King in Right of Canada.
To join our distribution list or to suggest additional report topics or markets, please contact:
Agriculture and Agri-Food Canada, Global Analysis1341 Baseline Rd, Tower 5, 3rd floor
Ottawa ON K1A 0C5
Canada
Email: aafc.mas-sam.aac@agr.gc.ca
The Government of Canada has prepared this report based on primary and secondary sources of information. Although every effort has been made to ensure that the information is accurate, Agriculture and Agri-Food Canada (AAFC) assumes no liability for any actions taken based on the information contained herein.
Reproduction or redistribution of this document, in whole or in part, must include acknowledgement of agriculture and agri-food Canada as the owner of the copyright in the document, through a reference citing AAFC, the title of the document and the year. Where the reproduction or redistribution includes data from this document, it must also include an acknowledgement of the specific data source(s), as noted in this document.
Agriculture and Agri-Food Canada provides this document and other report services to agriculture and food industry clients free of charge.