

Note: This report includes forecasting data that is based on baseline historical data.
Executive summary
In 2023, Vietnam imported a total of US$1.5 billion (783.8 thousand tonnes) of fresh and processed meat products from the world (27th largest market). Top suppliers of meat to Vietnam over the year, were China at a market share of 15.9%, the United States (8.3%), and Japan (7.7%).
Canada was Vietnam's 7th largest supplier for fresh and processed meat products in 2023, accounting for an import value of US$63.9 million and increasing by a compound annual growth rate (CAGR) of 88.3% (2019-2023). Top meat products exported to Vietnam consisted of frozen edible bovine offal (excl. tongues and livers) at a value of US$29.6 million (7,253.5 tonnes), frozen meat of bovine, boneless at US$23.2 million (4,144.8 tonnes), and frozen meat of swine, bone-in at US$7.0 million (3,693.6 tonnes) in 2023.
Internationally, Euromonitor reports that retail sales of processed meat in the Asia Pacific (APAC) region was the third largest global market, consuming a total of US$35.2 billion in 2023. However, the APAC region is better known to consume a much higher level of fresh meat over processed meat. Vietnam was the 4th largest consumer of fresh & processed meat products in the region after China, Japan, and India at a sales value of US$13.9 billion in 2023 - consisting of 98.5% of fresh meat and 1.5% of processed meat sales.
In 2023, leading processed meat food companies (brands) in Vietnam included Saigon Trading Group - SATRA (Vissan) at almost half of the market share by 46.1%, the Charoen Pokphand Group (CP) at 13.3%, and Halong Canned Food JSC (Ha Long) at 3.4%. There are no Private label companies reporting in Vietnam.
Vietnamese store-based grocery retailers distributed most of the processed meat, seafood and alternatives to meat market at US$532.2 million (99.6%) versus non-store retailing or e-commerce sales of US$2.3 million (0.4%) in 2023. Small local grocers registered the largest sales, followed by supermarkets and hypermarkets. Grocery store-based convenience stores and supermarkets in Vietnam experienced the highest growths (2018 to 2023), while e-commerce online sales has increased dramatically by a CAGR of 35.7%.
Meat and livestock production in Vietnam
Chickens were Vietnam's largest produced livestock at volumes of 400.5 million live animals in 2022, representing the largest growth at a CAGR of 6.0% from 316.9 million in 2018. Over the year, ducks were Vietnam's second largest livestock animals (83.7 million), followed by swine/pigs that has been declining the most by a CAGR of -3.2% from volumes of 28.2 million in 2018 to 24.7 million in 2022. Remaining 2022 livestock production in Vietnam consisted of cattle (6.3 million), goats (2.9 million), buffalo (2.2 million), and horses (52.1 thousand).
In 2022, meat of pig with the bone in (fresh or chilled) was Vietnam's primary meat, producing 3.1 million tonnes, followed by fresh/chilled meat of chickens (1.1 million tonnes), edible offal of pigs (incl. fresh, chilled, frozen) at 357.2 thousand tonnes), fresh/chilled meat of cattle (incl. bone) (264.8 thousand tonnes), and fresh/chilled meat of duck (182.2 thousand tonnes). Production of fresh/chilled meat of cattle (incl. bone) and edible offal of cattle (incl. frozen), experienced the highest growths with CAGRs of 9.5% within both categories between 2018 and 2022.
| Livestock | 2018 | 2019 | 2020 | 2021 | 2022 | CAGR* % 2018-2022 |
|---|---|---|---|---|---|---|
| Buffalo | 2,425,105 | 2,387,887 | 2,332,754 | 2,264,700 | 2,231,600 | −2.1 |
| Cattle | 5,802,907 | 6,060,024 | 6,230,519 | 6,365,300 | 6,339,400 | 2.2 |
| Chickens ('000) | 316,916 | 382,597 | 409,500 | 441,818[a] | 400,467[a] | 6.0 |
| Ducks ('000) | 76,911 | 82,536 | 86,563 | 82,003[b] | 83,700[b] | 2.1 |
| Goats | 2,683,942 | 2,609,198 | 2,654,573 | 2,699,623[a] | 2,852,566[a] | 1.5 |
| Horses | 53,473 | 50,692 | 50,941 | 51,616[a] | 52,148[a] | −0.6 |
| Swine / pigs | 28,151,948 | 19,615,526 | 22,027,858 | 23,533,400 | 24,684,900 | −3.2 |
|
Source: FAOSTAT Livestock Production, 2024 *CAGR: Compound Annual Growth Rate a: Imputed value b: Estimated value |
||||||
| Meat | 2018 | 2019 | 2020 | 2021 | 2022 | CAGR* % 2018-2022 |
|---|---|---|---|---|---|---|
| Edible offal of buffalo, fresh, chilled or frozen[a] | 5,374.2 | 5,512.0 | 10,253.6 | 6,964.2 | 6,974.8 | 6.7 |
| Edible offal of cattle, fresh, chilled or frozen[a] | 34,074.1 | 36,185.2 | 38,055.6 | 47,463.0 | 49,037.0 | 9.5 |
| Edible offal of goat, fresh, chilled or frozen[a] | 3,811.7 | 4,244.5 | 4,310.9 | 4,261.5 | 4,394.0 | 3.6 |
| Edible offal of pigs, fresh, chilled or frozen[a] | 323,690.9 | 279,818.2 | 284,078.8 | 336,933.3 | 357,200.0 | 2.5 |
| Edible offals of horses and other equines, fresh, chilled or frozen[a] | 191.3 | 186.7 | 199.1 | 186.8 | 186.4 | −0.6 |
| Horse meat, fresh or chilled | 1,383.3 | 1,350.2 | 1,439.4 | 1,350.6[a] | 1,347.8[a] | −0.6 |
| Meat of buffalo, fresh or chilled | 50,700 | 52,000 | 96,732.1 | 65,700 | 65,800 | 6.7 |
| Meat of cattle with the bone, fresh or chilled | 184,000 | 195,400 | 205,500 | 256,300 | 264,800 | 9.5 |
| Meat of chickens, fresh or chilled | 839,573.5 | 990,378.6 | 1,146,318 | 1,277,361[a] | 1,066,854[a] | 6.2 |
| Meat of ducks, fresh or chilled[a] | 134,588.6 | 154,174.8 | 172,919.8 | 181,756.0 | 182,248.6 | 7.9 |
| Meat of goat, fresh or chilled[a] | 18,848.9 | 20,989.4 | 21,317.8 | 21,073.3 | 21,728.7 | 3.6 |
| Meat of pig with the bone, fresh or chilled | 2,811,000 | 2,430,000 | 2,467,000 | 2,926,000 | 3,102,000 | 2.5 |
| Other meat, nowhere else calculated (excluding mammals), fresh, chilled or frozen[a] | 25,030.3 | 25,767.8 | 25,552.5 | 25,606.1 | 25,659.7 | 0.6 |
|
Source: FAOSTAT Agricultural Production, 2024 *CAGR: Compound Annual Growth Rate a: Imputed value |
||||||
Trade overview
In 2023, Vietnam was the 27th largest importer in the world for fresh and processed meat products at an import value of US$1.5 billion (783.8 thousand tonnes). The top global importers of meat were China at a market share of 15.9%, followed by the United States (8.3%), Japan (7.7%), Germany (7.8%), and the United Kingdom (5.5%) in 2023. Canada was the 11th largest importer over the year at a global value of US$3.6 billion (694.1 thousand tonnes), which has been increasing by a CAGR of 7.3% (2019-2023) compared to global value imports of US$169.1 billion (50.9 million tonnes) growing at a CAGR of 2.5% during the same period.
| Country | 2019 | 2020 | 2021 | 2022 | 2023 | CAGR* % 2019-2023 |
|---|---|---|---|---|---|---|
| Total - global importers | 153,353.3 | 155,212.6 | 172,702.1 | 187,590.3 | 169,145.4 | 2.5 |
| 1. China | 18,888.9 | 30,332.2 | 31,636.3 | 30,906.1 | 26,879.1 | 9.2 |
| 2. United States | 9,836.3 | 10,543.8 | 13,397.8 | 14,568.8 | 13,996.9 | 9.2 |
| 3. Japan | 14,198.5 | 13,488.4 | 14,194.2 | 14,700.1 | 13,100.3 | −2.0 |
| 4. Germany | 9,355.1 | 8,776.0 | 9,191.1 | 10,035.4 | 9,602.4 | 2.4 |
| 5. United Kingdom | 8,465.3 | 7,966.3 | 7,867.5 | 9,597.7 | 9,367.7 | 4.3 |
| 6. France | 6,017.3 | 5,661.6 | 6,806.5 | 8,040.2 | 8,004.5 | 10.1 |
| 7. South Korea | 5,499.9 | 5,212.6 | 6,300.7 | 7,645.7 | 6,920.0 | 5.9 |
| 8. Netherlands | 5,906.0 | 5,549.0 | 6,148.5 | 7,460.2 | 6,736.8 | 8.1 |
| 9. Mexico | 4,551.2 | 3,836.6 | 5,577.5 | 6,307.9 | 6,074.0 | 11.5 |
| 10. Italy | 5,553.7 | 5,032.5 | 5,354.4 | 6,201.9 | 6,058.8 | 3.8 |
| Subtotal - top 10 importers | 88,272.3 | 96,398.9 | 106,474.5 | 115,464.1 | 106,740.5 | 4.9 |
| Canada (11th) | 2,684.4 | 2,934.6 | 3,270.8 | 3,621.4 | 3,553.9 | 7.3 |
| Vietnam (27th) | 2,787.3 | 1,412.4 | 1,400.6 | 1,591.4 | 1,518.4 | −17.0 |
|
Source: Global trade tracker, 2024 1: Meat defined by HS codes 02 (meat and edible meat offal), 1602 (prepared or preserved meat, offal or blood) and 1601 (sausages and similar products, of meat, offal or blood) *CAGR: Compound Annual Growth Rate |
||||||
| Country | 2019 | 2020 | 2021 | 2022 | 2023 | CAGR* % 2019-2023 |
|---|---|---|---|---|---|---|
| Total - global importers | 50,033.7 | 49,622.2 | 51,183.3 | 49,859.0 | 50,920.2 | 0.4 |
| 1. Egypt | 90.6 | 936.5 | 525.6 | 614.5 | 7,604.6 | 202.7 |
| 2. China | 6,052.9 | 9,765.9 | 9,217.7 | 7,218.8 | 7,235.9 | 4.6 |
| 3. Japan | 3,088.7 | 2,921.8 | 2,962.2 | 3,063.7 | 2,915.0 | −1.4 |
| 4. Mexico | 3,841.6 | 2,328.7 | 2,656.6 | 2,685.4 | 2,624.9 | −9.1 |
| 5. United States | 1,811.0 | 1,899.8 | 2,102.4 | 2,258.3 | 2,187.5 | 4.8 |
| 6. Germany | 2,733.6 | 2,515.1 | 2,467.8 | 2,458.7 | 2,165.2 | −5.7 |
| 7. United Kingdom | 2,249.8 | 2,052.5 | 1,918.8 | 2,158.8 | 1,981.3 | −3.1 |
| 8. Netherlands | 1,939.6 | 1,858.7 | 1,987.6 | 2,188.5 | 1,924.3 | −0.2 |
| 9. France | 1,519.4 | 1,414.3 | 1,605.0 | 1,748.1 | 1,582.8 | 1.0 |
| 10. Italy | 1,617.1 | 1,493.8 | 1,612.6 | 1,649.5 | 1,396.9 | −3.6 |
| Subtotal - top 10 importers | 24,944.3 | 27,187.0 | 27,056.3 | 26,044.2 | 31,618.3 | 6.1 |
| Vietnam (15th) | 1,389.5 | 764.5 | 724. | 930.0 | 783.8 | −13.3 |
| Canada (18th) | 616.8 | 689.5 | 652.0 | 644.8 | 694.1 | 3.0 |
|
Source: Global trade tracker, 2024 *CAGR: Compound Annual Growth Rate |
||||||
Vietnam's top suppliers of meat products were India at an import value of US$510.8 million (market share: 33.6%), followed by Russia at US$171.4 million (11.3%), the United States at US$167.2 million (11.0%), Brazil at US$126.2 million (8.4%), and Australia at US$119.0 million (7.8%) in 2023. Canada was Vietnam's 7th largest supplier for fresh and processed meat products in 2023, with Vietnam importing a value of US$63.9 million.
In 2023, top imported meat products to Vietnam were frozen, boneless meat of bovine (HS: 020230) valued at US$617.3 million (194.9 thousand tonnes); followed by frozen meat of swine, boneless (HS: 020329) at US$254.9 million (102.1 thousand tonnes), and frozen cuts and edible offal of fowls (HS: 020714) at US$238.6 million (232.3 thousand tonnes).
| Country | 2019 | 2020 | 2021 | 2022 | 2023 | CAGR* % 2019-2023 |
|---|---|---|---|---|---|---|
| Total - global suppliers | 2,787.3 | 1,412.4 | 1,400.6 | 1,591.4 | 1,518.4 | −17.0 |
| 1. India | 1,322.7 | 481.1 | 398.9 | 519.6 | 510.8 | −26.8 |
| 2. Russia | 20.1 | 100.2 | 209.4 | 113.0 | 171.4 | 77.8 |
| 3. United States | 252.6 | 227.2 | 128.9 | 199.5 | 167.2 | −7.6 |
| 4. Brazil | 51.9 | 124.4 | 109.4 | 186.0 | 126.9 | 53.0 |
| 5. Australia | 394.9 | 100.6 | 120.3 | 134.1 | 119.0 | −30.2 |
| 6. Argentina | 232.3 | 13.4 | 33.5 | 8.2 | 74.1 | −67.2 |
| 7. Canada | 18.4 | 74.4 | 94.1 | 122.9 | 63.9 | 88.3 |
| 8. South Korea | 44.9 | 46.9 | 40.5 | 80.5 | 61.9 | 21.5 |
| 9. Germany | 50.9 | 31.6 | 85.2 | 69.4 | 60.9 | 10.9 |
| 10. Poland | 61.8 | 54.8 | 47.9 | 46.5 | 54.0 | −9.1 |
| Subtotal - top 10 suppliers | 2,450.5 | 1,254.7 | 1,268.0 | 1,479.7 | 1,410.1 | −12.9 |
|
Source: Global trade tracker, 2024 *CAGR: Compound Annual Growth Rate |
||||||
| Country | 2019 | 2020 | 2021 | 2022 | 2023 | CAGR* % 2019-2023 |
|---|---|---|---|---|---|---|
| Total - global suppliers |
1,389.5 |
764.5 | 724.0 | 930.0 | 783.8 | −13.3 |
| 1. India | 450.5 | 145.4 | 139.6 | 169.6 | 188.9 | −19.5 |
| 2. United States | 186.5 | 183.6 | 90.7 | 118.9 | 114.1 | −11.6 |
| 3. Russia | 19.6 | 47.1 | 101.4 | 86.3 | 84.7 | 44.2 |
| 4. Brazil | 37.9 | 77.3 | 64.4 | 114.3 | 74.8 | 18.5 |
| 5. Poland | 55.6 | 43.0 | 40.1 | 60.4 | 50.1 | −2.6 |
| 6. Germany | 51.3 | 24.6 | 60.6 | 50.9 | 47.6 | −1.9 |
| 7. South Korea | 47.2 | 45.3 | 36.2 | 196.2 | 45.5 | −0.9 |
| 8. Australia | 148.5 | 33.4 | 35.3 | 32.6 | 42.2 | −27.0 |
| 9. Argentina | 115.4 | 8.1 | 14.6 | 3.5 | 40.9 | −22.8 |
| 10. Spain | 58.8 | 17.8 | 11.9 | 18.3 | 18.0 | −25.6 |
| Subtotal - top 10 suppliers | 1,171.2 | 625.6 | 594.9 | 850.9 | 706.8 | −11.9 |
| Canada - (11th) | 10.6 | 32.5 | 28.8 | 27.0 | 16.8 | 12.3 |
|
Source: Global trade tracker, 2024 *CAGR: Compound Annual Growth Rate |
||||||
| HS code | Description | Import value (US$M) | Import volume (kilotonnes) | Top suppliers and market value share | Canada share % | ||
|---|---|---|---|---|---|---|---|
| 1 | 2 | 3 | |||||
| Total - meat imports | 1,518.4 | 783.8 | India: 33.6 | Russia: 11.3 | United States: 11.0 | 4.2 | |
| 020230 | Frozen boneless meat of bovine | 617.3 | 194.9 | India: 74.5 | Australia: 9.4 | Canada: 7.8 | 7.8 |
| 020329 | Frozen meat of swine, boneless (excluding carcases) | 254.9 | 102.1 | Russia: 47.0 | Brazil: 36.3 | Germany: 5.6 | 2.0 |
| 020714 | Frozen cuts and edible offal of fowls | 238.6 | 232.3 | United States: 46.7 | Poland: 14.7 | Brazil: 12.1 | 0.01 |
| 020649 | Frozen edible offal of swine,: (excluding livers) | 141.3 | 118.2 | Spain: 35.2 | Russia: 25.9 | Poland: 10.2 | 1.4 |
| 020629 | Frozen edible bovine offal: (excluding tongues and livers) | 115.3 | 67.8 | Argentina: 39.8 | India: 34.8 | Australia: 20.2 | 0.3 |
| 020712 | Frozen fowls, not cut in pieces | 49.3 | 33.6 | South Korea: 99.6 | Australia: 0.2 | United States: 0.1 | 0.0 |
| 020910 | Fresh/chilled/frozen pig fat, salted, in brine, dried or smoked (not lean) | 23.4 | 14.7 | Spain: 53.6 | Germany: 10.4 | Canada: 8.8 | 8.8 |
| 020130 | Fresh/chilled bovine meat, boneless | 17.1 | 0.947 | Australia: 82.5 | New Zealand: 7.6 | Japan: 5.9 | 0.1 |
| 020220 | Frozen bovine cuts, with bone-in (excluding carcases) | 14.7 | 2.8 | Canada: 34.5 | United States: 24.6 | Spain: 18.0 | 34.5 |
| 020621 | Frozen edible bovine tongues | 12.3 | 6.4 | India: 69.5 | Argentina: 20.9 | Australia: 2.9 | 0.0 |
| Source: Global Trade Tracker, 2024 | |||||||
Canada's performance
In 2023, Canada exported a total of Can$93.4 million (18,643.9 tonnes) of fresh or processed meat products to Vietnam. Exports to Vietnam have been growing by a 5-year CAGR of 26.8%, increasing from Can$36.1 million in 2019.
Canadian provinces exporting meat to Vietnam were Alberta at a total value of Can$72.7 million and a market share of 77.7%, followed by Ontario at Can$9.5 million (10.2%), Québec at Can$8.6 million (9.2%), Manitoba at Can$1.5 million (1.7%), and British Columbia at Can$1.1 million (1.2%) in 2023.
Top meat products being exported to Vietnam were frozen edible bovine offal, excluding tongues and livers (HS: 020629) at a value of Can$40.1 million (7,253.5 tonnes), frozen meat of bovine, boneless at Can$31.3 million (4,144.8 tonnes), and frozen meat of swine, bone-in at Can$9.4 million (3,693.6 tonnes) in 2023.
| Country | 2019 | 2020 | 2021 | 2022 | 2023 | CAGR* % 2019-2023 |
|---|---|---|---|---|---|---|
| Total - meat exports | 36.1 | 100.9 | 135.6 | 147.0 | 93.4 | 26.8 |
| 1. Alberta | 8.6 | 49.3 | 77.7 | 121.5 | 72.7 | 70.4 |
| 2. Ontario | 5.9 | 8.4 | 10.5 | 10.7 | 9.5 | 12.7 |
| 3. Québec | 17.0 | 35.3 | 42.7 | 11.8 | 8.6 | −15.6 |
| 4. Manitoba | 1.8 | 1.8 | 0.801 | 2.1 | 1.5 | −3.2 |
| 5. British Columbia | 2.7 | 5.3 | 3.4 | 0.887 | 1.1 | −20.9 |
| 6. Saskatchewan | 0.123 | 0.0 | 0.165 | 16.2 | ||
| 7. Prince Edward Island | 0.037 | |||||
| 8. Nova Scotia | 0.710 | 0.364 | −48.7 | |||
|
Source: Global trade tracker, 2024 *CAGR: Compound Annual Growth Rate |
||||||
| HS code | Description | Export value (Can$M) | Export volume (metric tonnes) | Top provincial suppliers and market value share | ||
|---|---|---|---|---|---|---|
| Total - meat exports | 93.4 | 18,643.9 | Alberta: 77.7 | Ontario: 10.2 | Québec: 9.3 | |
| 020629 | Frozen edible bovine offal: (excluding tongues and livers) | 40.1 | 7,253.5 | Alberta: 91.7 | Ontario: 8.3 | |
| 020230 | Frozen meat of bovine, boneless | 31.3 | 4,144.8 | Alberta: 95.2 | Ontario: 4.6 | British Columbia: 0.2 |
| 020329 | Frozen meat of swine: (excluding carcases, bone in) | 9.4 | 3,693.6 | Québec: 60.9 | Ontario: 16.2 | Alberta: 12.8 |
| 020220 | Frozen bovine cuts, bone-in (excluding carcases) | 7.2 | 795.1 | Alberta: 61.6 | Ontario: 38.4 | |
| 020322 | Frozen hams, shoulders and cuts of swine, bone in | 2.3 | 1,112.7 | Manitoba: 56.9 | Québec: 29.0 | BC: 11.6 |
| 020910 | Pig fat, fresh/chilled/frozen, salted, in brine, dried or smoked, free of lean meat | 1.9 | 987.3 | Québec: 83.0 | Ontario: 17.0 | |
| 020714 | Frozen cuts and edible offal of fowls | 0.376 | 382.3 | Québec: 93.0 | BC: 7.0 | |
| 020621 | Frozen edible bovine tongues | 0.274 | 22.2 | Alberta: 100.0 | ||
| 020649 | Frozen edible offal of swine (excluding livers) | 0.206 | 91.7 | Québec: 64.6 | Ontario: 35.4 | |
| 020727 | Frozen cuts and edible offal of turkeys | 0.153 | 104.7 | Québec: 100.0 | ||
| 020610 | Fresh/chilled edible offal of bovine | 0.113 | 24.5 | Alberta: 100.0 | ||
| 020500 | Fresh/chilled/frozen meat of horses, asses, mules or hinnies | 0.067 | 5.4 | Alberta: 100.0 | ||
| 020312 | Fresh/chilled hams, shoulders and cuts of swine, bone in | 0.057 | 24.9 | Québec: 100.0 | ||
| 020130 | Fresh/chilled bovine meat, boneless | 0.021 | 1.2 | Alberta: 100.0 | ||
| 160241 | Prepared or preserved hams of swine and cuts thereof | 0.009 | 2.5 | Alberta: 100.0 | ||
|
Source: Global Trade Tracker, 2024 1: As reported by Canada |
||||||
Market size
Per capita consumption of fresh and processed meat by Vietnamese consumers was 44.4 kilograms (kg) in 2022, slightly up from 43.7 kg in 2018, projected to reach 56.5 kg by 2028. Compared to Canada, Canadians consumed 32 kg per capita more fresh meat than Vietnamese consumers reaching 76.4 kg per capita in Canada in 2022; Canadian consumption of fresh meat projected to grow at a lower CAGR of 1.2% to reach 82.2 kg by 2028, over Vietnam at a projected CAGR of 3.8% (2023-2028).
Per capita consumption of fresh pork (28 kg) was the most popular fresh meat in Vietnam, while per capita consumption of fresh poultry (37.4 kg) was the number one choice amongst Canadian consumers in 2022. In Vietnam the most popular frozen poultry by category type was processed chicken wings (39.6%), followed by chicken nuggets (36.7%), and other frozen poultry products (23.7%) in 2023.
Vietnamese consumers prefer consumption of fresh meat over processed meat at a low per capita consumption of 0.4 kg compared to 23.6 kg in Canada in 2022. Consumption of processed meat in Vietnam, however, has increased (especially during the pandemic) by a CAGR of 7.5% between 2018 and 2022, and is expected to continue to grow by a CAGR of 4.6% (2023-2028).
| Category | 2018 | 2022 | CAGR* % 2018-2022 | 2023 | 2028 | CAGR* % 2023-2028 |
|---|---|---|---|---|---|---|
| Total - fresh meat | 43.7 | 44.4 | 0.4 | 47.0 | 56.5 | 3.8 |
| Beef and veal | 3.6 | 3.8 | 1.4 | 4.1 | 5.4 | 5.7 |
| Lamb, mutton and goat | 0.2 | 0.3 | 10.7 | 0.3 | 0.4 | 5.9 |
| Pork | 28.9 | 28.0 | −0.8 | 29.6 | 35.0 | 3.4 |
| Poultry | 10.0 | 11.4 | 3.3 | 12.0 | 14.6 | 4.0 |
| Other meat | 1.0 | 0.9 | −2.6 | 1.0 | 1.1 | 1.9 |
| Total - processed meat | 0.3 | 0.4 | 7.5 | 0.4 | 0.5 | 4.6 |
|
Source: Euromonitor International, 2024 *CAGR: Compound Annual Growth Rate |
||||||
| Category | Unit | 2018 | 2019 | 2020 | 2022 | 2023 |
|---|---|---|---|---|---|---|
| Total - frozen poultry | Value (US$M) | 12.7 | 13.5 | 14.5 | 15.5 | 15.9 |
| % Breakdown | 100.0 | 100.0 | 100.0 | 100.0 | 100.0 | |
| Chicken nuggets | Value (US$M) | 4.5 | 4.9 | 5.3 | 5.7 | 5.8 |
| % Breakdown | 35.7 | 35.9 | 36.2 | 36.4 | 36.7 | |
| Processed chicken wings | Value (US$M) | 5.3 | 5.6 | 5.9 | 6.2 | 6.3 |
| % Breakdown | 41.5 | 41.2 | 40.7 | 40.3 | 39.6 | |
| Other poultry | Value (US$M) | 2.9 | 3.1 | 3.4 | 3.6 | 3.8 |
| % Breakdown | 22.8 | 22.9 | 23.1 | 23.3 | 23.7 | |
| Source: Euromonitor International, 2024 | ||||||
| Category | 2018 | 2022 | CAGR* % 2018-2022 | 2023 | 2028 | CAGR* % 2023-2028 |
|---|---|---|---|---|---|---|
| Total - fresh meat | 72.1 | 76.4 | 1.5 | 77.4 | 82.2 | 1.2 |
| Beef and veal | 19.1 | 18.3 | −1.1 | 17.8 | 16.4 | −1.6 |
| Lamb, mutton and goat | 0.7 | 0.8 | 3.4 | 0.8 | 0.8 | 0.0 |
| Pork | 17.6 | 19.9 | 3.1 | 20.2 | 21.3 | 1.1 |
| Poultry | 34.6 | 37.4 | 2.0 | 38.6 | 43.6 | 2.5 |
| Other meat | 0.0 | 0.0 | 0.0 | 0.0 | 0.0 | 0.0 |
| Total - processed meat | 25.1 | 23.6 | −1.5 | 23.5 | 25.1 | 1.3 |
|
Source: Euromonitor International, 2024 *CAGR: Compound Annual Growth Rate |
||||||
Retail sales
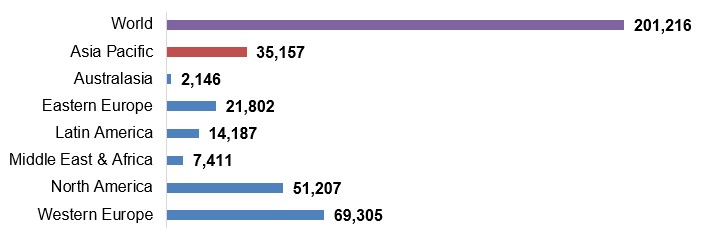
On an International context, Euromonitor reports that retail sales of processed meat totalled US$201.2 billion worldwide. The Asia Pacific (APAC) region had the third largest global retail sales value of processed meat at a total of US$35.2 billion - consuming a total global value of 17.5% in 2023. Albeit, the APAC region is better known to consume a higher level of fresh meat over processed meat. Overall, there were 12 countriesFootnote 1 that reported high retail sales for the consumption of fresh meat that totalled a value of US$336.2 billion in 2023.
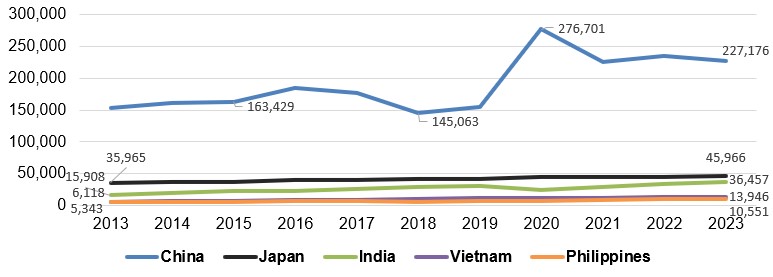
Within the APAC region, China was the largest consumer of both fresh and processed meat products at a total of US$227.2 billion in 2023. Japan was the 2nd largest market at sales of US$46.0 billion over last year, followed by India (US$36.5 billion), Vietnam (US$13.9 billion), and the Philippines (US$10.6 billion).
Description of above image
- World: 201,216
- Asia Pacific: 35,157
- Australasia: 2,146
- Eastern Europe: 21,802
- Latin America: 14,187
- Middle East and Africa: 7,411
- North America: 51,207
- Western Europe: 69,305
Source: Euromonitor International, 2024
Description of above image
| Country | 2,013 | 2,014 | 2,015 | 2,016 | 2,017 | 2,018 | 2,019 | 2,020 | 2,021 | 2,022 | 2,023 |
|---|---|---|---|---|---|---|---|---|---|---|---|
| China | 153,557 | 161,155 | 163,429 | 184,208 | 176,101 | 145,063 | 155,256 | 276,701 | 225,253 | 234,929 | 227,176 |
| Japan | 35,965 | 36,803 | 37,457 | 39,431 | 40,750 | 41,582 | 41,275 | 44,755 | 45,233 | 45,506 | 45,966 |
| India | 15,908 | 19,294 | 22,958 | 22,985 | 25,406 | 29,118 | 30,199 | 24,902 | 29,618 | 33,163 | 36,457 |
| Vietnam | 6,118 | 6,807 | 7,345 | 8,066 | 9,488 | 10,749 | 12,407 | 12,615 | 12,132 | 13,200 | 13,946 |
| Philippines | 5,343 | 5,822 | 6,178 | 6,973 | 6,907 | 6,283 | 6,605 | 7,950 | 8,814 | 9,577 | 10,551 |
Source: Euromonitor International, 2024
Total fresh meat: US$336.2 billion
Total processed meat: US$35.2 billion
In 2023, the fresh and processed meat category in Vietnam was negatively impacted by inflation and an economic slowdown. Sales value and volume registered slower growth than in the previous year, since Vietnamese consumers reduced their frequency of eating out more than ever in efforts to save money. This had a notable impact on overall meat consumption, most notably in the more premium, higher cost segments - which is primarily served by the foodservice sector - like lamb, mutton, and goat.Footnote 2
Bolstered by a growing concern for health and wellness, Vietnamese consumers are reducing their consumption of foods containing more fat like pork, while sales of beef and chicken have recorded stronger growth rates in value and volume terms in 2023. The price of meat is carefully managed by the government to better control the market, incentizing the consumption of domestic meat that is generally priced lower than that of imported meat - with domestic beef being less expensive than imported beef, for instance. Moreover, consumer preference is for fresh "hot meat" (slaughtered within a day) over chilled or frozen imported meat - only turning to these products during the pandemic, due to a lack of fresh meat.Footnote 2
Fresh meat
Retail value sales - fresh meat
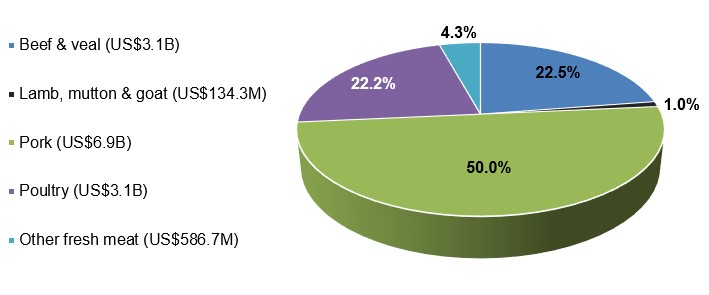
In Vietnam, sales of fresh meat totalled US$13.7 billion in 2023. Fresh pork was the highest in demand, registering a sales of US$6.9 billion (50.0%) over the year, followed by fresh beef and veal at US$3.1 billion (22.5%), fresh poultry at US$3.0 (22.2%), fresh lamb, mutton and goat at US$134.4 million (1.0%), and other fresh meat products at US$586.7 million (4.3%).
Description of above image
- Beef and veal: US$3.1 billion
- Lamb, mutton and goat: US$134.3 million
- Pork: US$6.9 billion
- Poultry: US$3.1 billion
- Other fresh meat: US$586.7 million
Source: Euromonitor International, 2024
Total value sales of fresh meat grew by a CAGR of 5.3% between 2018 and 2023. Although being a smaller segment in the fresh meat category, lamb, mutton and goat was the best performing category in 2023, growing at a value sales that has been increasing by a CAGR of 14.2% (2018-2023). Fresh pork in value sales was the largest segment in the fresh meat category growing the slowest by a CAGR of 2.6% over the historic period. Total value sales of fresh meat are set to grow at a CAGR of 8.0% over the forecast period (2023 to 2028), to reach US$20.2 billion by 2028.
| Category | 2018 | 2019 | 2020 | 2021 | 2022 | 2023 |
|---|---|---|---|---|---|---|
| Total - fresh meat | 10,596.5 | 12,243.0 | 12,439.0 | 11,951.0 | 13,003.7 | 13,737.0 |
| Beef and veal | 1,992.4 | 2,271.3 | 2,475.7 | 2,611.9 | 2,860.0 | 3,097.1 |
| Lamb, mutton and goat | 69.3 | 81.1 | 90.9 | 113.4 | 121.8 | 134.4 |
| Pork | 6,044.8 | 7,132.8 | 6,804.7 | 6,035.4 | 6,593.0 | 6,868.5 |
| Poultry | 2,028.6 | 2,272.0 | 2,567.4 | 2,670.1 | 2,872.1 | 3,050.3 |
| Other meat | 461.4 | 485.7 | 500.3 | 520.3 | 556.7 | 586.7 |
| Source: Euromonitor International, 2024 | ||||||
| Category | Annual growth % 2023/2022 | CAGR* % 2018-2023 | Total growth % 2018-2023 |
|---|---|---|---|
| Total - fresh meat | 5.6 | 5.3 | 29.6 |
| Beef and veal | 8.3 | 9.2 | 55.4 |
| Lamb, mutton and goat | 10.3 | 14.2 | 93.9 |
| Pork | 4.2 | 2.6 | 13.6 |
| Poultry | 6.2 | 8.5 | 50.4 |
| Other meat | 5.4 | 4.9 | 27.2 |
|
Source: Euromonitor International, 2024 *CAGR: Compound Annual Growth Rate |
|||
| Category | 2023 | 2024 | 2025 | 2026 | 2027 | 2028 |
|---|---|---|---|---|---|---|
| Total - fresh meat | 13,737.0 | 14,650.5 | 15,742.2 | 17,043.4 | 18,503.2 | 20,159.2 |
| Beef and veal | 3,097.1 | 3,340.3 | 3,633.6 | 3,986.7 | 4,390.6 | 4,857.6 |
| Lamb, mutton and goat | 134.4 | 147.8 | 163.8 | 183.1 | 205.5 | 231.2 |
| Pork | 6,868.5 | 7,322.8 | 7,859.5 | 8,492.5 | 9,194.1 | 9,981.0 |
| Poultry | 3,050.3 | 3,223.8 | 3,433.3 | 3,684.8 | 3,966.3 | 4,285.1 |
| Other meat | 586.7 | 615.8 | 652.0 | 696.3 | 746.6 | 804.3 |
| Source: Euromonitor International, 2024 | ||||||
| Category | Annual growth % 2024/2023 | CAGR* % 2018-2023 | Total growth % 2023-2028 |
|---|---|---|---|
| Total - fresh meat | 6.6 | 8.0 | 46.8 |
| Beef and veal | 7.9 | 9.4 | 56.8 |
| Lamb, mutton and goat | 10.0 | 11.5 | 72.0 |
| Pork | 6.6 | 7.8 | 45.3 |
| Poultry | 5.7 | 7.0 | 40.5 |
| Other meat | 5.0 | 6.5 | 37.1 |
|
Source: Euromonitor International, 2024 *CAGR: Compound Annual Growth Rate |
|||
Retail volume sales - fresh meat
Total volume sales of fresh meat grew by a CAGR of 2.5% (2018 to 2023) to 2.8 million tonnes in 2023. Lamb, mutton and goat was the best performing category in 2023, growing at a volume sales that has been increasing by a CAGR of 7.4% (2018 to 2023), to reach 10.3 thousand tonnes. Fresh pork volume sales was the largest segment in the fresh meat category growing the slowest by a CAGR of 1.2% over the historic period, to 1.7 million tonnes in 2023. Total volume sales of fresh meat are set to grow at a CAGR of 3.5% by 2028 over the forecast period (2023 to 2028) to reach 3.3 million tonnes.
| Category | 2018 | 2019 | 2020 | 2021 | 2022 | 2023 |
|---|---|---|---|---|---|---|
| Total - fresh meat | 2,429.9 | 2,413.4 | 2,589.0 | 2,624.8 | 2,684.5 | 2,754.5 |
| Beef and veal | 198.8 | 208.7 | 217.1 | 225.1 | 234.8 | 245.3 |
| Lamb, mutton and goat | 7.2 | 8.4 | 9.1 | 9.8 | 9.6 | 10.3 |
| Pork | 1,599.4 | 1,519.5 | 1,610.6 | 1,623.3 | 1,655.8 | 1,693.9 |
| Poultry | 569.4 | 620.7 | 695.2 | 709.1 | 726.1 | 745.7 |
| Other meat | 55.0 | 56.2 | 57.1 | 57.6 | 58.4 | 59.3 |
| Source: Euromonitor International, 2024 | ||||||
| Category | Annual growth % 2023/2022 | CAGR* % 2018-2023 | Total growth % 2018-2023 |
|---|---|---|---|
| Total - fresh meat | 2.6 | 2.5 | 13.4 |
| Beef and veal | 4.5 | 4.3 | 23.4 |
| Lamb, mutton and goat | 7.3 | 7.4 | 43.1 |
| Pork | 2.3 | 1.2 | 5.9 |
| Poultry | 2.7 | 5.5 | 31.0 |
| Other meat | 1.5 | 1.5 | 7.8 |
|
Source: Euromonitor International, 2024 *CAGR: Compound Annual Growth Rate |
|||
| Category | 2023 | 2024 | 2025 | 2026 | 2027 | 2028 |
|---|---|---|---|---|---|---|
| Total - fresh meat | 2,754.5 | 2,834.4 | 2,925.2 | 3,027.6 | 3,142.6 | 3,271.3 |
| Beef and veal | 245.3 | 256.8 | 269.4 | 283.2 | 298.2 | 314.6 |
| Lamb, mutton and goat | 10.3 | 11.1 | 12.0 | 13.1 | 14.2 | 15.3 |
| Pork | 1,693.9 | 1,737.9 | 1,788.3 | 1,845.5 | 1,910.1 | 1,982.7 |
| Poultry | 745.7 | 768.0 | 793.4 | 822.0 | 854.0 | 889.9 |
| Other meat | 59.3 | 60.5 | 62.0 | 63.9 | 66.1 | 68.7 |
|
Source: Euromonitor International, 2024 |
||||||
| Category | Annual growth % 2024/2023 | CAGR* % 2018-2023 | Total growth % 2023-2028 |
|---|---|---|---|
| Total - fresh meat | 2.9 | 3.5 | 18.8 |
| Beef and veal | 4.7 | 5.1 | 28.3 |
| Lamb, mutton and goat | 7.8 | 8.2 | 48.5 |
| Pork | 2.6 | 3.2 | 17.0 |
| Poultry | 3.0 | 3.6 | 19.3 |
| Other meat | 2.0 | 3.0 | 15.9 |
|
Source: Euromonitor International, 2024 *CAGR: Compound Annual Growth Rate |
|||
Processed meat
Retail sales value- processed meat
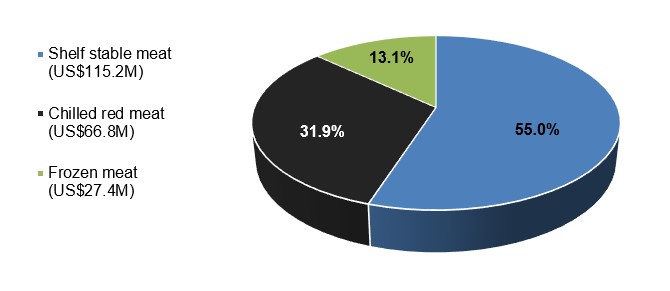
In Vietnam, sales of processed meat totalled US$209.4 million in 2023. Processed shelf stable red meat was the highest in demand, registering a sales of US$109.9 million (52.5%) over the year, followed by processed chilled red meat at US$66.8 million (31.9%), processed frozen poultry at US$17.1 million (8.2%), processed frozen red meat at US$10.3 million (4.9%), and processed shelf stable poultry at US$5.2 million (2.5%).
Description of above image
- Shelf stable: US$115.2 million
- Chilled: US$66.8 million
- Frozen: US$27.4 million
Source: Euromonitor International, 2024
Total value sales of processed meat grew by a CAGR of 6.6% between 2018 and 2023. Shelf stable processed meat (especially shelf stable red meat) was the largest segment and best performing category in 2023, growing at a value sales that has been increasing by a CAGR of 7.0% (2018-2023). The other processed categories registered moderate value sales growth over the historic period, including processed chilled red meat (CAGR: 6.3%) and frozen red meat/poultry (CAGR: 5.9%). Total value sales of processed meat are set to grow by a CAGR of 11.0% over the forecast period (2023-2028), to reach 352.6 million by 2028.
| Category | 2018 | 2019 | 2020 | 2021 | 2022 | 2023 |
|---|---|---|---|---|---|---|
| Total - processed meat | 152.1 | 163.6 | 175.8 | 181.1 | 196.0 | 209.4 |
| Subtotal - shelf stable meat | 82.1 | 87.8 | 94.7 | 96.6 | 106.0 | 115.2 |
| Processed red meat | 78.2 | 83.7 | 90.4 | 92.2 | 101.2 | 109.9 |
| Processed poultry | 3.9 | 4.0 | 4.3 | 4.4 | 4.8 | 5.2 |
| Subtotal - chilled red meat | 49.3 | 53.8 | 57.5 | 59.8 | 64.2 | 66.8 |
| Subtotal - frozen meat | 20.6 | 22.0 | 23.6 | 24.8 | 25.8 | 27.4 |
| Processed red meat | 7.9 | 8.5 | 9.1 | 9.3 | 9.9 | 10.3 |
| Processed poultry | 12.7 | 13.5 | 14.5 | 15.5 | 15.9 | 17.1 |
| Source: Euromonitor International, 2024 | ||||||
| Category | Annual growth % 2023/2022 | CAGR* % 2018-2023 | Total growth % 2018-2023 |
|---|---|---|---|
| Total - processed meat | 6.8 | 6.6 | 37.7 |
| Subtotal - shelf stable meat | 8.7 | 7.0 | 40.3 |
| Processed red meat | 8.6 | 7.0 | 40.5 |
| Processed poultry | 8.3 | 5.9 | 33.3 |
| Subtotal - chilled red meat | 4.0 | 6.3 | 35.5 |
| Subtotal - frozen meat | 6.2 | 5.9 | 33.0 |
| Processed red meat | 4.0 | 5.4 | 30.4 |
| Processed poultry | 7.5 | 6.1 | 34.6 |
|
Source: Euromonitor International, 2024 *CAGR: Compound Annual Growth Rate |
|||
| Category | 2023 | 2024 | 2025 | 2026 | 2027 | 2028 |
|---|---|---|---|---|---|---|
| Total - processed meat | 209.4 | 233.2 | 259.0 | 287.3 | 318.3 | 352.6 |
| Subtotal - shelf stable meat | 115.2 | 129.8 | 145.7 | 163.0 | 181.3 | 201.1 |
| Processed red meat | 109.9 | 123.9 | 139.0 | 155.5 | 172.9 | 191.9 |
| Processed poultry | 5.2 | 5.9 | 6.7 | 7.5 | 8.4 | 9.3 |
| Subtotal - chilled red meat | 66.8 | 72.8 | 79.7 | 87.5 | 96.6 | 106.9 |
| Subtotal - frozen meat | 27.4 | 30.7 | 33.6 | 36.8 | 40.4 | 44.6 |
| Processed red meat | 10.3 | 11.2 | 12.3 | 13.5 | 14.8 | 16.2 |
| Processed poultry | 17.1 | 19.4 | 21.3 | 23.4 | 25.7 | 28.4 |
| Source: Euromonitor International, 2024 | ||||||
| Category | Annual growth % 2024/2023 | CAGR* % 2018-2023 | Total growth % 2023-2028 |
|---|---|---|---|
| Total - processed meat | 10.8 | 11.0 | 68.4 |
| Subtotal - shelf stable meat | 10.9 | 11.8 | 74.6 |
| Processed red meat | 11.0 | 11.8 | 74.6 |
| Processed poultry | 10.7 | 12.3 | 78.8 |
| Subtotal - chilled red meat | 10.7 | 9.9 | 60.0 |
| Subtotal - frozen meat | 10.4 | 10.2 | 62.8 |
| Processed red meat | 9.5 | 9.5 | 57.3 |
| Processed poultry | 10.5 | 10.7 | 66.1 |
|
Source: Euromonitor International, 2024 *CAGR: Compound Annual Growth Rate |
|||
Retail volume sales - processed meat
Total volume sales of processed meat grew by a CAGR of 2.4% (2018 to 2023) to 29.1 million tonnes in 2023. The processed frozen poultry category was the best performing category over the historical period (2018-2023), growing at a volume sales that has been increasing by a CAGR of 3.5%. Volume sales of processed shelf stable red meat was the largest segment in the processed meat category at sales of 16.6 thousand tonnes in 2023. Total volume sales of processed meat are set to grow at a CAGR of 4.4% over the forecast period (2023 to 2028) to reach 36.1 thousand tonnes by 2028.
| Category | 2018 | 2019 | 2020 | 2021 | 2022 | 2023 |
|---|---|---|---|---|---|---|
| Total - processed meat | 25.8 | 26.6 | 27.5 | 27.7 | 28.3 | 29.1 |
| Subtotal - shelf stable meat | 15.3 | 15.6 | 16.2 | 16.3 | 16.8 | 17.3 |
| Processed red meat | 14.6 | 14.9 | 15.4 | 15.6 | 16.0 | 16.6 |
| Processed poultry | 0.7 | 0.7 | 0.7 | 0.7 | 0.8 | 0.8 |
| Subtotal - chilled red meat | 8.2 | 8.6 | 8.8 | 8.9 | 9.0 | 9.2 |
| Subtotal - frozen meat | 2.3 | 2.4 | 2.5 | 2.5 | 2.6 | 2.6 |
| Processed red meat | 0.7 | 0.7 | 0.7 | 0.7 | 0.7 | 0.8 |
| Processed poultry | 1.6 | 1.7 | 1.8 | 1.8 | 1.8 | 1.9 |
| Source: Euromonitor International, 2024 | ||||||
| Category | Annual growth % 2023/2022 | CAGR* % 2018-2023 | Total growth % 2018-2023 |
|---|---|---|---|
| Total - processed meat | 2.8 | 2.4 | 12.8 |
| Subtotal - shelf stable meat | 3.0 | 2.5 | 13.1 |
| Processed red meat | 3.8 | 2.6 | 13.7 |
| Processed poultry | 0.0 | 2.7 | 14.3 |
| Subtotal - chilled red meat | 2.2 | 2.3 | 12.2 |
| Subtotal - frozen meat | 0.0 | 2.5 | 13.0 |
| Processed red meat | 14.3 | 2.7 | 14.3 |
| Processed poultry | 5.6 | 3.5 | 18.8 |
|
Source: Euromonitor International, 2024 *CAGR: Compound Annual Growth Rate |
|||
| Category | 2023 | 2024 | 2025 | 2026 | 2027 | 2028 |
|---|---|---|---|---|---|---|
| Total - processed meat | 29.1 | 30.1 | 31.3 | 32.6 | 34.3 | 36.1 |
| Subtotal - shelf stable meat | 17.3 | 18.0 | 18.8 | 19.8 | 21.0 | 22.3 |
| Processed red meat | 16.6 | 17.2 | 18.0 | 19.0 | 20.1 | 21.3 |
| Processed poultry | 0.8 | 0.8 | 0.8 | 0.9 | 0.9 | 1.0 |
| Subtotal - chilled red meat | 9.2 | 9.4 | 9.6 | 9.9 | 10.2 | 10.5 |
| Subtotal - frozen meat | 2.6 | 2.7 | 2.8 | 3.0 | 3.1 | 3.2 |
| Processed red meat | 0.8 | 0.8 | 0.8 | 0.8 | 0.9 | 0.9 |
| Processed poultry | 1.9 | 2.0 | 2.0 | 2.1 | 2.2 | 2.3 |
| Source: Euromonitor International, 2024 | ||||||
| Category | Annual growth % 2024/2023 | CAGR* % 2018-2023 | Total growth % 2023-2028 |
|---|---|---|---|
| Total - processed meat | 5.2 | 4.4 | 24.1 |
| Subtotal - shelf stable meat | 6.2 | 5.2 | 28.9 |
| Processed red meat | 6.0 | 5.1 | 28.3 |
| Processed poultry | 11.1 | 4.6 | 25.0 |
| Subtotal - chilled red meat | 2.9 | 2.7 | 14.1 |
| Subtotal - frozen meat | 3.2 | 4.2 | 23.1 |
| Processed red meat | 0.0 | 2.4 | 12.5 |
| Processed poultry | 4.5 | 3.9 | 21.1 |
|
Source: Euromonitor International, 2024 *CAGR: Compound Annual Growth Rate |
|||
Competitive landscape
In 2023, leading processed meat companies (brands) in Vietnam included Saigon Trading Group - SATRA (Vissan) at almost half of the market share of 46.1% (US$96.6 million), the Charoen Pokphand Group (CP) at 13.3% (US$27.8 million), and Halong Canned Food JSC (Ha Long) at 3.4% (US$7.1 million). There are no private label companies reporting in Vietnam.
Branded meat accounts for only a small share of sales in Vietnam, however, is starting to gain popularity towards the end of the review period. Branded meat is seeing more investment by brand owners, especially in urban areas, such as Vissan, CP, G Kitchen and MeatDeli. There is an increase in marketing activities, such as TV commercials and in-store advertising. Since the emergence and spread of COVID-19, consumers view branded meat to be safer and of higher-quality than regular meat and despite the slightly higher price, people are increasingly opting for these branded products. QR codes on packaging of branded fresh meat products are leading to consumers building increased trust in their quality, which allows people to easily verify a variety of valuable information such as the origin and date of the products, certification, the producers involved, and farm/slaughter information etc. This trend can be attributed to recent publicity about low-quality meat used in restaurants and traditional markets.Footnote 2
| Company | Top brand(s) | Retail sales (US$ million) | Market share % in 2023 |
|---|---|---|---|
| Saigon Trading Group (SATRA) | Vissan | 96.6 | 46.1 |
| Charoen Pokphand Group | CP | 27.8 | 13.3 |
| Halong Canned Food JSC | Ha Long | 7.1 | 3.4 |
| San Miguel Corporation | Le Gourmet | 7.0 | 3.3 |
| La Cusina Food Company Ltd. | La Cusina | 6.1 | 2.9 |
| Daesang Corporation | Duc Viet | 6.0 | 2.9 |
| Tuyen Ky Company Ltd. | Tuyen Ky | 3.7 | 1.8 |
| Special Aquatic Joint-stock Co. (SEASPIMEX-VIETNAM) | Seaspimex | 2.6 | 1.2 |
| CJ Corporation | Minh Dat | 1.7 | 0.8 |
| Tan Viet Sin Foods JSC | Tan Viet Sin | 1.0 | 0.5 |
| Viet Sin Food JSC | Viet Sin | 0.6 | 0.3 |
| Hien Thanh Company Ltd. | Hien Thanh | 0.4 | 0.2 |
| Others | Others | 48.9 | 23.4 |
| Total - processed meat | 209.4 | 100.0 | |
| Source: Euromonitor International, 2024 | |||
Retail distribution channels
The majority of Vietnam's processed meat, seafood and alternatives to meat market was distributed through store-based grocery retailers at US$532.2 million (99.6%) versus non-store retailing or e-commerce sales of US$2.3 million (0.4%) in 2023. Small local grocers registered the largest sales at US$394.2 million (73.8%), followed by supermarkets and hypermarkets with combined sales of US$90.5 million (16.9%), food/drink tobacco specialists at US$37.8 million (7.1%), and convenience stores at US$9.6 million (1.8%).
Between 2018 and 2023, grocery retailers in Vietnam such as convenience stores and supermarkets experienced the highest growths at CAGRs of 51.6% and 13.1% respectively. Over this same period, e-commerce online sales increased by a CAGR of 35.7% in Vietnam. Recently, there have been an expansion in distribution via butchers that are opening in residential areas.Footnote 2
| Outlet Type | 2018 | 2023 | CAGR* % 2018-2023 | ||
|---|---|---|---|---|---|
| Actual | Share (%) | Actual | Share (%) | ||
| Total - retail channels | 363.6 | 100.0 | 534.5 | 100.0 | 8.0 |
| Store-based retail - offline (grocery retailers) | 363.2 | 99.9 | 532.2 | 99.6 | 7.9 |
| Convenience retail stores | 1.2 | 0.3 | 9.6 | 1.8 | 51.6 |
| Supermarkets | 32.3 | 8.9 | 59.9 | 11.2 | 13.1 |
| Hypermarkets | 21.8 | 6.0 | 30.6 | 5.7 | 7.0 |
| Food/drink tobacco specialists | 30.2 | 8.3 | 37.8 | 7.1 | 4.6 |
| Small local grocers | 277.7 | 76.4 | 394.2 | 73.8 | 7.3 |
| Non-store retail - e-commerce | 0.5 | 0.1 | 2.3 | 0.4 | 35.7 |
|
Source: Euromonitor International, 2024 *CAGR: Compound Annual Growth Rate |
|||||
New product launches
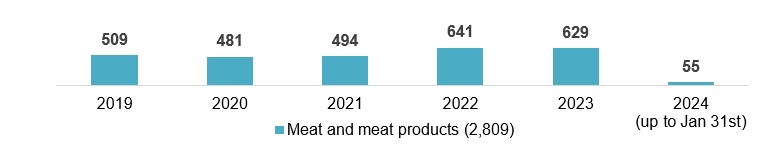
Mintel indicated that there were 2,809 new processed meat and meat food products launched in Vietnam's grocery retailer outlets (including new variety/range extension, packaging, formulation or relaunched) between the period of January 2019 and January 31st, 2024. The leading locations of manufacturer (countries reported: n=18) launching products in Vietnam (745) during this period were Japan (20), South Korea (20), Thailand (11), New Zealand (7), Malaysia (5), Italy (5), USA (5), France (4), and Argentina (2). Canada produced one frozen beef rib product imported by Thu Do, Vietnam in March 2019.
Description of above image
| 2019 | 2020 | 2021 | 2022 | 2023 | 2024 (up to January 31) | Total | |
|---|---|---|---|---|---|---|---|
| Meat and meat products launches | 509 | 481 | 494 | 641 | 629 | 55 | 2,809 |
Source: Mintel, 2024
Overall, Vietnam doesn't tend to import many new processed meat products from the world, importing (when reported) a total of 93 products (3.3%) over the 5-year period (Jan 2019 - Jan 2024); while importing only six meat products (0.9%) in 2023, and one meat product (1.8%) in the first month of 2024. Alternatively, Vietnam manufactured 745 domestically made meat products (26.5%) over the 5-year period.
Leading parent companies launching these new processed meat products (690) in Vietnam between Q1-2023 and Q1-2024 were FamilyMart (35), Acecook (23), Saigon Food (22), Vifon (18), Circle K Stores (16), and Daesang (16). New domestically made meat brands appearing for the first time launched in the Vietnamese market within the last 6 months, included Do's Bakery (traditional paté breadsticks), TVP Food (ham cheese breadsticks), Hoa Hy (beef jerky with tiny shrimp sauce) and Omachi House GuMi (beef noodles flavoured instant noodles).
Top growing categories for processed meat products in Vietnam were processed fish, meat and egg products (+56.8%), snacks (+27.3%), bakery (+25%), and meals and meal centers (+2.5%) between Q1-2023 and Q1-2024. During this same period, declining categories were baby food and dairy (−100%), soup (−88.9%), and sauces and seasonings (−30.8%). Top growing claims (Q4-2022 vs Q4-2023) were free from added/artificial colorings (+366.7%), ethical - recycling (+300%), functional - energy (+200%), all-natural product (+125%), and ethical - environmentally friendly package (+100%). Declining claims over this period by −100% were GMO free, cobranded, functional - skin, nails and hair, babies and toddlers (0-4), and economy.
New ingredients found within these meat products appearing within the last 12 months included coconut fat, artificial hazelnut flavour, and Papaya. The fastest growing or most common flavours used were egg (+500%), rib, crab, mushroom or cream/crème/whipped cream (+300%), and tomato (+200%) between Q1-2022 and Q1-2024.
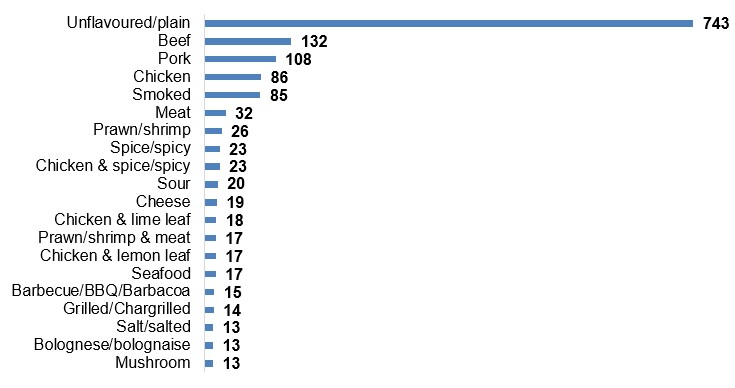
Between January 2019 and January 31st 2024, top flavour components or blends found in meat products were unflavoured/plain, beef, pork, chicken, smoked, meat, prawn/shrimp, spice/spicy, chicken and spice, sour, cheese, chicken and lime leaf, prawn/shrimp and meat, chicken and lemon leaf, and seafood. Common format types of these new meat and meat products were sausage, sliced, block/cubed, whole, fillet, burger, ball, shredded/minced, wings/thighs/drumsticks, and bone-in pieces.
Description of above image
- Unflavoured/plain: 743
- Beef: 132
- Pork: 108
- Chicken: 86
- Smoked: 85
- Meat: 32
- Prawn/shrimp: 26
- Chicken and spice/spicy: 23
- Spice/spicy: 23
- Sour: 20
- Cheese: 19
- Chicken and lime leaf: 18
- Prawn/shrimp and meat: 17
- Chicken and lemon leaf: 17
- Seafood: 17
- Barbecue/BBQ/Barbacoa: 15
- Grilled/Chargrilled: 14
- Salt/salted: 13
- Bolognese/bolognaise: 13
- Mushroom: 13
Source: Mintel, 2024
Total item count: 2,809
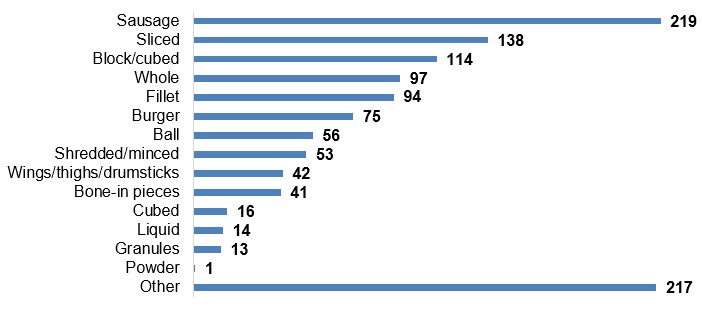
Description of above image
- Sausage: 219
- Sliced: 138
- Block/cubed: 114
- Whole: 97
- Fillet: 94
- Burger: 75
- Ball: 56
- Shredded/minced: 53
- Wings/thighs/drumsticks: 42
- Bone-in pieces: 41
- Cubed: 16
- Liquid: 14
- Granules: 13
- Powder: 1
- Other: 217
Source: Mintel, 2024
Total item count: 2,809
| Product attributes | Yearly launch - item count | ||||||
|---|---|---|---|---|---|---|---|
| 2019 | 2020 | 2021 | 2022 | 2023 | 2024 | Total | |
| Yearly product launches | 509 | 481 | 494 | 641 | 629 | 55 | 2,809 |
| Top launch types | |||||||
| New variety/range extension | 158 | 180 | 154 | 260 | 241 | 14 | 1,007 |
| New packaging | 172 | 115 | 143 | 180 | 192 | 20 | 822 |
| New product | 139 | 163 | 164 | 133 | 146 | 17 | 762 |
| Relaunch | 40 | 22 | 32 | 68 | 49 | 4 | 215 |
| New formulation | 0 | 1 | 1 | 0 | 1 | 0 | 3 |
| Top sub-categories | |||||||
| Meat products | 172 | 191 | 143 | 196 | 147 | 15 | 864 |
| Meat snacks | 48 | 41 | 39 | 67 | 60 | 13 | 268 |
| Instant noodles | 52 | 39 | 31 | 54 | 77 | 10 | 263 |
| Hors d'oeuvres/canapes | 43 | 33 | 47 | 41 | 47 | 1 | 212 |
| Poultry products | 24 | 23 | 66 | 46 | 42 | 2 | 203 |
| Top five companies | |||||||
| Acecook | 13 | 7 | 12 | 14 | 22 | 0 | 68 |
| FamilyMart | 2 | 0 | 1 | 22 | 35 | 0 | 60 |
| Masan | 7 | 11 | 10 | 11 | 15 | 0 | 54 |
| Vissan | 24 | 11 | 6 | 3 | 5 | 0 | 49 |
| Feddy | 1 | 22 | 7 | 14 | 4 | 0 | 48 |
| Top five brands | |||||||
| CP | 7 | 16 | 29 | 9 | 12 | 0 | 73 |
| Vifon | 12 | 13 | 11 | 7 | 9 | 3 | 55 |
| FamilyMart | 2 | 0 | 0 | 17 | 32 | 0 | 51 |
| Circle K | 4 | 4 | 0 | 19 | 16 | 0 | 43 |
| Vissan | 17 | 11 | 4 | 2 | 6 | 0 | 40 |
| Import status (if reported) | |||||||
| Not imported | 98 | 90 | 116 | 202 | 208 | 31 | 745 |
| Imported | 32 | 19 | 12 | 23 | 6 | 0 | 92 |
| Top five price groups (US dollars) | |||||||
| 0.10 - 4.09 | 418 | 355 | 409 | 504 | 502 | 37 | 2,225 |
| 4.10 - 8.09 | 71 | 104 | 69 | 111 | 99 | 15 | 469 |
| 8.10 - 12.09 | 13 | 17 | 13 | 17 | 15 | 4 | 79 |
| 12.10 - 16.09 | 6 | 1 | 1 | 6 | 8 | 0 | 22 |
| 16.10 - 23.00 | 1 | 3 | 2 | 1 | 4 | 0 | 11 |
| Top five flavours (including blend) | |||||||
| Unflavoured/plain | 146 | 147 | 138 | 164 | 138 | 10 | 743 |
| Beef | 28 | 19 | 18 | 32 | 32 | 3 | 132 |
| Pork | 19 | 21 | 24 | 13 | 30 | 1 | 108 |
| Chicken | 22 | 12 | 14 | 15 | 20 | 3 | 86 |
| Smoke | 22 | 15 | 13 | 20 | 15 | 0 | 85 |
| Top claims | |||||||
| Ease of use | 250 | 202 | 214 | 238 | 115 | 20 | 1,039 |
| No additives/artificial preservatives | 164 | 173 | 162 | 162 | 164 | 19 | 844 |
| Microwaveable | 39 | 47 | 61 | 94 | 102 | 4 | 347 |
| Time/speed | 54 | 43 | 35 | 85 | 86 | 16 | 319 |
| Premium | 32 | 31 | 57 | 79 | 65 | 13 | 277 |
| Source: Mintel; Global New Product Database, 2024 | |||||||
Examples of new products
Rib Finger
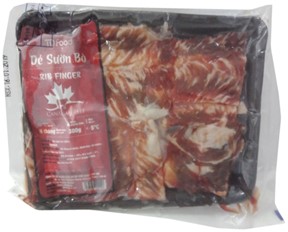
Source: Mintel, 2024
| Company / importer | Thu Do |
|---|---|
| Brand | TD Food |
| Category | Processed fish, meat and egg products |
| Market | Vietnam, imported from Canada |
| Store name | Big C |
| Store type | Mass merchandise / hypermarket |
| Store location | Hanoi 100000 |
| Date published | March 2019 |
| Launch type | New variety / range extension |
| Price in US dollars | 6.63 |
The product is made of Canadian beef and retails in a 250 gram pack.
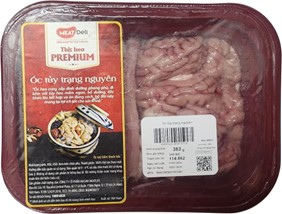
Pork Brain and Marrow
Source: Mintel, 2024
| Company | Masan Meatlife |
|---|---|
| Brand | Meat Deli Premium |
| Category | Processed fish, meat and egg products |
| Market | Vietnam, not imported |
| Claims | Premium |
| Store name | WinMart Vietnam |
| Store type | Supermarket |
| Store location | Hanoi, 100000 |
| Date published | January 2024 |
| Launch type | New variety / range extension |
| Price in US dollars | 4.68 |
This product retails in a 383 gram pack. 100% fresh pork. Rich in nutrition. Premium product. Logos and certifications: QR code
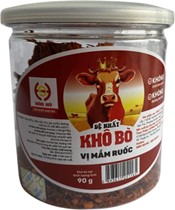
Beef Jerky with Tiny Shrimp
Source: Mintel, 2024
| Company | Hoa Hy Import-Export |
|---|---|
| Brand | Hoa Hy |
| Category | Meat snacks |
| Market | Vietnam |
| Store name | Emart |
| Store type | Mass merchandise / hypermarket |
| Store location | Ho Chi Minh 700000 |
| Date published | January 2024 |
| Launch type | New product |
| Price in US dollars | 3.71 |
This product retails in a 90 gram pack. No chemicals, sugar or preservatives.
Pig Head Pie

Source: Mintel, 2024
| Company | Dong Nai Food Processing |
|---|---|
| Brand / distributor | Seamix |
| Category | Processed fish, meat and egg products |
| Market | Vietnam, not imported |
| Store name | Emart |
| Store type | Mass merchandise / hypermarket |
| Store location | Ho Chi Minh 700000 |
| Date published | January 2024 |
| Launch type | New packaging |
| Price in US dollars | 3.23 |
This product has been repackaged in a new look, and retails in a 475 gram pack. Sweet meat, tough fibers. Delicious dishes do not just stop at unique flavors, but the source of raw materials must be truly clean and nutritious. Logos and certificates: HACCP, ISO 22000, QR code
Shredded Chicken with BBQ Sauce Breadsticks

Source: Mintel, 2024
| Company | Sun Do Food |
|---|---|
| Brand | Do's bakery |
| Category | Meals and meal centers, sandwiches / wraps |
| Market | Vietnam, not imported |
| Store name | Annam Gourmet Market |
| Store type | Gourmet store |
| Store location | Ho Chi Minh 700000 |
| Date published | Janaury 2024 |
| Launch type | New product |
| Price in US dollars | 2.01 |
This product retails in a 189 gram pack containing three 63 gram pieces. Can be prepared in an oven or air fryer for three to four minutes, or pan on low heat for five to six minutes. Convenient, quick and easy, and nutritious. Logos and certifications: QR code, ISO 22000, HACCP. Also, available in ham or sausage cheese breadsticks.
Luncheon Meat

Source: Mintel, 2024
| Company | SPC Samlip Seocheon Plant |
|---|---|
| Importer | Masan Jinju |
| Brand | Pönnie |
| Category | Processed fish, meat and egg products |
| Market | Vietnam, imported from South Korea |
| Store name | WinMart Vietnam |
| Store type | Supermarket |
| Store location | Ho Chi Minh 700000 |
| Date published | March 2023 |
| Launch type | New packaging |
| Price in US dollars | 2.83 |
This product has been repackaged, and retails in a newly designed 200 gram pack. It is also available in a 320 gram pack. Ready to eat. Can be served with hot rice, bread, or salad. Pack featuring preparation instructions.
For more information
The Canadian Trade Commissioner Service:
International Trade Commissioners can provide Canadian industry with on-the-ground expertise regarding market potential, current conditions and local business contacts, and are an excellent point of contact for export advice.
More agri-food market intelligence:
International agri-food market intelligence
Discover global agriculture and food opportunities, the complete library of Global Analysis reports, market trends and forecasts, and information on Canada's free trade agreements.
Agri-food market intelligence service
Canadian agri-food and seafood businesses can take advantage of a customized service of reports and analysis, and join our email subscription service to have the latest reports delivered directly to their inbox.
More on Canada's agriculture and agri-food sectors:
Canada's agriculture sectors
Information on the agriculture industry by sector. Data on international markets. Initiatives to support awareness of the industry in Canada. How the department engages with the industry.
For additional information on the Food & Hotel Vietnam 2024 held from March 19 to 21, please contact:
Ben Berry, Deputy Director
Trade Show Strategy and Delivery
Agriculture and agri-food Canada
ben.berry@agr.gc.ca
Resources
- Euromonitor International | December 2023. Country Report: Meat in Vietnam
- Global Trade Tracker (GTT), 2024
- Mintel Global New Products Database, 2024
Sector Trend Analysis – Meat in Vietnam
Global Analysis Report
Prepared by: Erin-Ann Chauvin, Senior Market Analyst
© His Majesty the King in Right of Canada, represented by the Minister of Agriculture and Agri-Food (2024).
Photo credits
All photographs reproduced in this publication are used by permission of the rights holders.
All images, unless otherwise noted, are copyright His Majesty the King in Right of Canada.
To join our distribution list or to suggest additional report topics or markets, please contact:
Agriculture and Agri-Food Canada, Global Analysis1341 Baseline Rd, Tower 5, 3rd floor
Ottawa ON K1A 0C5
Canada
Email: aafc.mas-sam.aac@agr.gc.ca
The Government of Canada has prepared this report based on primary and secondary sources of information. Although every effort has been made to ensure that the information is accurate, Agriculture and Agri-Food Canada (AAFC) assumes no liability for any actions taken based on the information contained herein.
Reproduction or redistribution of this document, in whole or in part, must include acknowledgement of agriculture and agri-food Canada as the owner of the copyright in the document, through a reference citing AAFC, the title of the document and the year. Where the reproduction or redistribution includes data from this document, it must also include an acknowledgement of the specific data source(s), as noted in this document.
Agriculture and Agri-Food Canada provides this document and other report services to agriculture and food industry clients free of charge.