
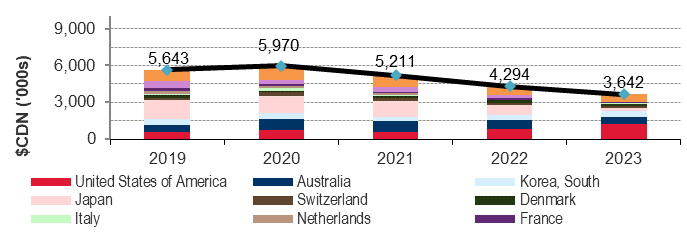
This section host statistics on Export of bovine embryos in Canada.
| Top trading partners | 2019 | 2020 | 2021 | 2022 | 2023 |
|---|---|---|---|---|---|
| 1 - United States of America | 569,196 | 766,369 | 604,301 | 781,307 | 1,227,218 |
| 2 - Australia | 581,655 | 832,249 | 846,831 | 730,672 | 531,854 |
| 3 - Korea, South | 444,874 | 521,801 | 364,047 | 485,023 | 518,571 |
| 4 - Japan | 1,561,849 | 1,379,242 | 1,287,136 | 810,905 | 261,270 |
| 5 - Switzerland | 216,115 | 340,718 | 268,231 | 118,930 | 191,740 |
| 6 - Denmark | 185,700 | 65,201 | 120,271 | 222,411 | 110,575 |
| 7 - Italy | 97,461 | 247,978 | 140,519 | 30,207 | 62,364 |
| 8 - Netherlands | 233,678 | 163,755 | 136,677 | 25,320 | 44,259 |
| 9 - France | 246,194 | 135,054 | 92,212 | 149,150 | 32,912 |
| 10 - Germany | 572,332 | 351,383 | 411,486 | 238,448 | 27,735 |
| Others | 934,020 | 1,166,257 | 939,410 | 701,756 | 633,366 |
| Total | 5,643,074 | 5,970,007 | 5,211,121 | 4,294,129 | 3,641,864 |
| Top trading partners | 2019 | 2020 | 2021 | 2022 | 2023 |
|---|---|---|---|---|---|
| 1 - United States of America | 837 | 1,243 | 1,017 | 1,202 | 1,419 |
| 2 - Australia | 1,298 | 1,115 | 2,315 | 1,948 | 1,175 |
| 3 - Korea, South | 235 | 499 | 331 | 459 | 302 |
| 4 - Japan | 1,135 | 1,026 | 936 | 597 | 175 |
| 5 - Switzerland | 261 | 361 | 267 | 143 | 191 |
| 6 - Denmark | 185 | 85 | 113 | 207 | 115 |
| 7 - Italy | 148 | 307 | 212 | 81 | 131 |
| 8 - Netherlands | 289 | 215 | 1,617 | 83 | 106 |
| 9 - France | 227 | 114 | 71 | 93 | 81 |
| 10 - Germany | 580 | 347 | 357 | 226 | 150 |
| Others | 2,046 | 2,144 | 1,297 | 1,227 | 1,087 |
| Total | 7,241 | 7,456 | 8,533 | 6,266 | 4,932 |
Source: Statistics Canada
For your convenience, this report is available in the following format:
PDF (17364 KB)
If you have any questions or require additional information, please send an e-mail to aafc.cdic-ccil.aac@agr.gc.ca