
This section host statistics on export of breeding swine in Canada.
| Top trading partners | 2019 | 2020 | 2021 | 2022 | 2023 |
|---|---|---|---|---|---|
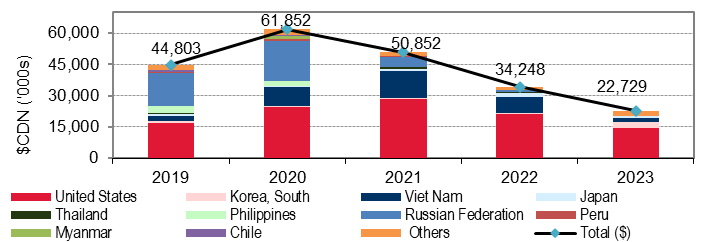
| 1 - United States | 16,963,404 | 24,541,028 | 28,494,624 | 21,106,554 | 14,537,290 |
| 2 - Korea, South | 747,883 | 615,949 | 568,095 | 717,387 | 2,993,470 |
| 3 - Viet Nam | 2,389,682 | 9,166,632 | 12,714,778 | 7,663,814 | 1,565,081 |
| 4 - Japan | 829,107 | 429,007 | 946,054 | 1,812,638 | 906,879 |
| 5 - Thailand | 625,102 | 88,565 | 836,220 | 365,823 | 272,298 |
| 6 - Philippines | 3,625,484 | 2,053,588 | 232,067 | - | 22,714 |
| 7 - Russian Federation | 15,499,457 | 19,421,644 | 4,872,975 | 973,400 | - |
| 8 - Peru | 770,281 | 1,086,119 | 182,398 | 144,398 | - |
| 9 - Myanmar | - | 1,319,530 | - | - | - |
| 10 - Chile | 673,180 | 586,139 | - | - | - |
| Others | 2,679,843 | 2,544,165 | 2,004,413 | 1,464,474 | 2,430,906 |
| Total | 44,803,423 | 61,852,366 | 50,851,624 | 34,248,488 | 22,728,638 |
| Top trading partners | 2019 | 2020 | 2021 | 2022 | 2023 |
|---|---|---|---|---|---|
| 1 - United States | 36,328 | 53,510 | 68,148 | 52,232 | 57,110 |
| 2 - Korea, South | 558 | 392 | 244 | 304 | 2,503 |
| 3 - Viet Nam | 1,964 | 5,821 | 5,275 | 1,823 | 649 |
| 4 - Japan | 302 | 199 | 367 | 812 | 408 |
| 5 - Thailand | 319 | 40 | 316 | 113 | 91 |
| 6 - Philippines | 3,487 | 2,441 | 90 | - | 21 |
| 7 - Russian Federation | 9,021 | 10,931 | 2,829 | 473 | - |
| 8 - Peru | 443 | 461 | 124 | 52 | - |
| 9 - Myanmar | - | 712 | - | - | - |
| 10 - Chile | 548 | 401 | - | - | - |
| Others | 2,226 | 1,857 | 1,926 | 820 | 1,105 |
| Total | 55,196 | 76,765 | 79,319 | 56,629 | 61,887 |
Source: Statistics Canada
For your convenience, this report is available in the following format:
PDF (671 KB)
If you have any questions or require additional information, please send an e-mail to aafc.cdic-ccil.aac@agr.gc.ca