
This page contains relevant information and data on the state of labour in the agriculture and agri-food sector. If you have any comments or questions, please e-mail aafc.labour-main-doeuvre.aac@agr.gc.ca.
Labour Strategy (2023)
On May 18, 2023, the Government released a report that summarizes what Agriculture and Agri-Food Canada (AAFC) heard during consultations with stakeholders on the development of the Agricultural Labour Strategy.
Job vacancies in the sector
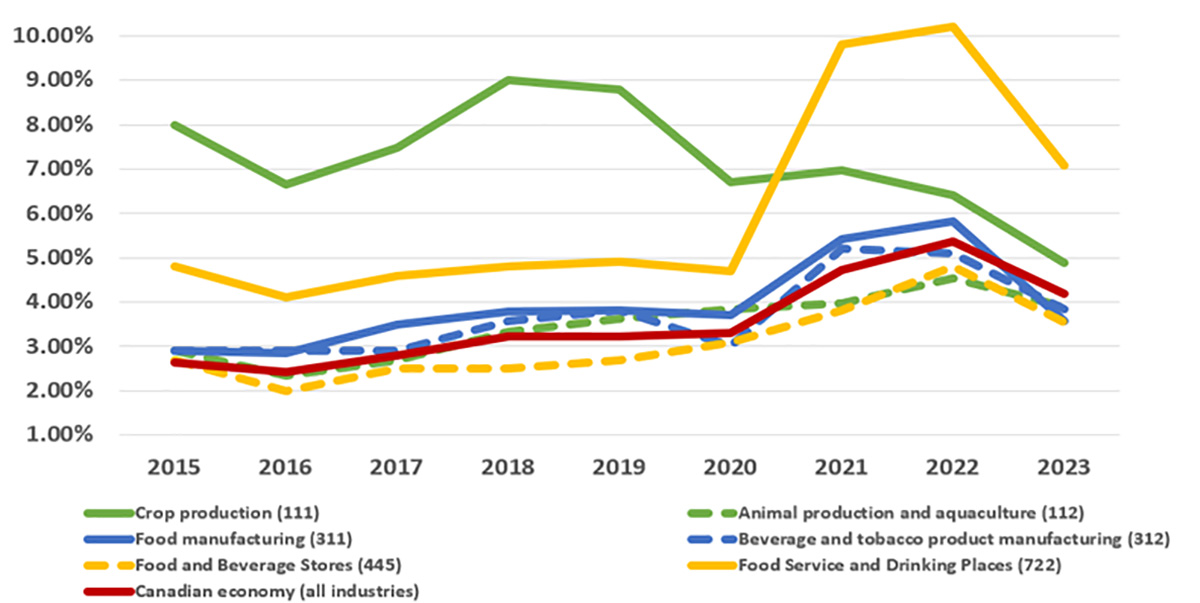
Job vacancy rates for each of the agriculture and agri-food subsectors decreased in 2023 relative to 2022 (an average decline of 27%). 2023 job vacancy rates for animal production and agriculture (3.9%), food manufacturing (3.6%), beverage and tobacco product manufacturing (3.8%), and food and beverage retailers (3.6%), were below the job vacancy rate for the entire economy (4.2%). The job vacancy rate for food service and drinking places remains high relative to historic trends but declined 30% in 2023 compared to 2022 (to 7.1% from 10.2%). Finally, crop production has continued its very strong job vacancy rate decline since 2015, and is now just 17% higher than the rate for the entire economy (compared with 252% higher in 2015).
Overview of job vacancy rates for 2023
| Category | Subsector (three-digit North American Industry Classification System code) | Job vacancy rate in 2023 (%)Table 1 note 1 |
|---|---|---|
| Primary agriculture | Crop production (111) | 4.9 |
| Animal production and aquaculture (112) | 3.9 | |
| Food and beverage processing | Food manufacturing (311) | 3.6 |
| Beverage and tobacco product manufacturing (312) | 3.8 | |
| Retail and food service | Food and beverage retailers (445) | 3.6 |
| Food services and drinking places (722) | 7.1 | |
| Canadian economy | All industries | 4.2 |
|
||
Job vacancy rate trends (2015-2023)
Description of above image
| Year | Crop production (111)(%) | Animal production and aquaculture (112)(%) | Food manufacturing (311)(%) | Beverage and tobacco product manufacturing (312)(%) | Food and beverage stores (445)(%) | Food service and drinking places (722)(%) | Canadian economy (all industries)(%) |
|---|---|---|---|---|---|---|---|
| 2015 | 8.0 | 2.9 | 2.9 | 2.9 | 2.7 | 4.8 | 2.6 |
| 2016 | 6.7 | 2.4 | 2.9 | 2.9 | 2.0 | 4.1 | 2.4 |
| 2017 | 7.5 | 2.7 | 3.5 | 2.9 | 2.5 | 4.6 | 2.8 |
| 2018 | 9.00 | 3.3 | 3.8 | 3.6 | 2.5 | 4.8 | 3.2 |
| 2019 | 8.8 | 3.6 | 3.8 | 3.8 | 2.7 | 4.9 | 3.2 |
| 2020 | 6.7 | 3.9 | 3.7 | 3.0 | 3.1 | 4.7 | 3.3 |
| 2021 | 7.0 | 4.0 | 5.4 | 5.2 | 3.8 | 9.8 | 4.7 |
| 2022 | 6.4 | 4.5 | 5.8 | 5.1 | 4.8 | 10.2 | 5.4 |
| 2023 | 4.9 | 3.9 | 3.6 | 3.8 | 3.6 | 7.1 | 4.2 |
Greater variation is observed as industries are further broken down, with the largest vacancy rates concentrated in food service and horticulture. Data quality varies at the four-digit NAICS level, resulting in some four-digit industries being excluded from this list. This includes Fruit and Tree Nut Farming (1113) which likely had the highest job vacancy rate among four-digit industry groups, but was excluded because of insufficient fourth quarter data for that industry.
Industry group job vacancy rates in 2023 (four-digit NAICS code)
| Industry group (four-digit NAICS code) | Job vacancy rates in 2023 (%)Table 3 note 1 |
|---|---|
| Full-service restaurants and limited service eating places (7225) | 7.2 |
| Other animal production (1129) | 7.1 |
| Other crop farming (1119) | 6.3 |
| Vegetable and melon farming (1112) | 6.0 |
| Support activities for animal production (1152) | 5.9 |
| Special food services (7223) | 5.5 |
| Support activities for crop production (1151) | 5.2 |
| Specialty food stores (4452) | 4.9 |
| Seafood product preparation and packaging (3117) | 4.9 |
| Farm, lawn and garden machinery and equipment merchant wholesalers (4171) | 4.7 |
|
Note: Full list of industries and job vacancy numbers.
|
|
About the Job Vacancy and Wage Survey
The data in this section comes from the Job Vacancy and Wage Survey (JVWS), which is conducted by Statistics Canada. The JVWS provides reliable, comparable data on job vacancies and wages to support decision making by job seekers, employers, and policymakers. It is conducted on a stratified random sample of approximately 100,000 business locations drawn quarterly. Find more information about the survey.
The job vacancy rate is the share of vacancies from total labour need (vacancies plus the employed).
Data is presented by North American Industry Classification System (NAICS) codes at the three-digit and four-digit levels. Find more information on NAICS codes.
Additional JVWS data is available by occupation.
The role of temporary foreign workersEndnote 2
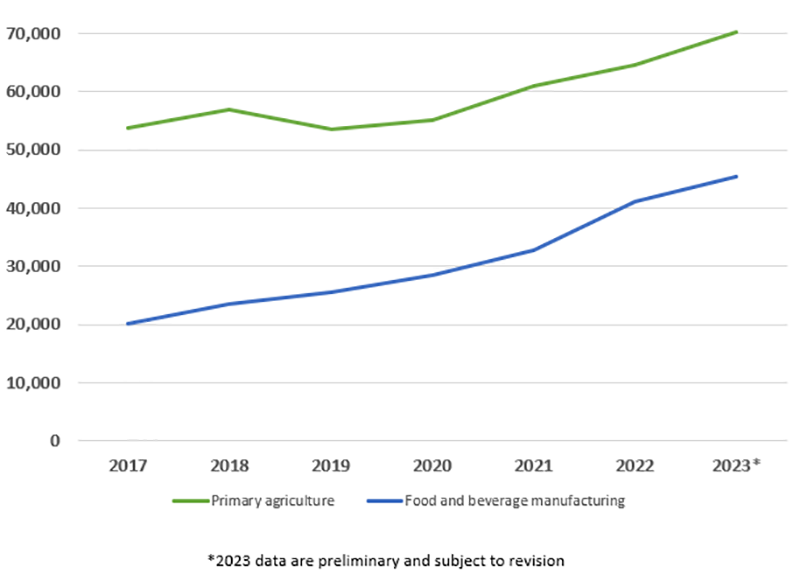
The Temporary Foreign Worker Program (TFWP) has provided a reliable source of labour for Canadian agriculture since the 1960s. In recent years, the number of Temporary Foreign WorkersEndnote 2 (TFWs) working in primary agriculture and food and beverage manufacturing have grown steadily, allowing employers to fill labour needs when Canadians and permanent residents are not available. In 2023, just over 70,000 TFWs worked in primary agriculture industries in Canada, and just over 45,000 TFWs worked in food and beverage manufacturing industries.
Temporary foreign workers in primary agriculture and food and beverage manufacturing (2017-2023)
Description of above image
| Year | 2017 | 2018 | 2019 | 2020 | 2021 | 2022 | 2023 |
|---|---|---|---|---|---|---|---|
| Primary agriculture | 53,842 | 56,919 | 53,605 | 55,171 | 60,992 | 64,660 | 70,267 |
| Food and beverage manufacturing | 20,115 | 23,635 | 25,555 | 28,384 | 32,740 | 41,204 | 45,428 |
Temporary foreign workers by province (2023)
Temporary foreign workers were welcomed to every province in 2023, but most were employed in Ontario, Quebec, and British Columbia.
Figure 3: Temporary foreign workers by province in primary agriculture and food and beverage manufacturing (2023)Table 4 note 1
| Canada | NL | PEI | NS | NB | QC | ON | MB | SK | AB | BC | |
|---|---|---|---|---|---|---|---|---|---|---|---|
| Primary agriculture | 70,267 | 82 | 492 | 1,579 | 388 | 23,295 | 29,048 | 809 | 813 | 2,791 | 10,970 |
| Food and beverage manufacturing | 45,428 | 373 | 704 | 1,330 | 2,746 | 11,523 | 16,739 | 1,875 | 398 | 2,790 | 6,996 |
|
|||||||||||
Additional data on temporary foreign workers
Temporary foreign worker data is published annually by Statistics Canada. Additional data on TFWs by industry, farm revenues, and countries of citizenship for TFWs in the agricultural sector are available.
Annex A: All industries with four-digit NAICS codes
| Industries with four-digit NAICS codes | Job vacancy rate in 2023(%)Table 5 note 1 | Job vacancies in 2023 (approximate)Table 5 note 1 |
|---|---|---|
| 7225 - Full-service restaurants and limited service eating places | 7.2 | 79316 |
| 1129 - Other animal production | 7.1 | 544 |
| 1119 - Other crop farming | 6.3 | 949 |
| 1112 - Vegetable and melon farming | 6.0 | 983 |
| 1152 - Support activities for animal production | 5.9 | 396 |
| 7223 - Special food services | 5.5 | 2679 |
| 1151 - Support activities for crop production | 5.2 | 485 |
| 3117 - Seafood product preparation and packaging | 4.9 | 945 |
| 4452 - Specialty food stores | 4.9 | 3013 |
| 4171 - Farm, lawn and garden machinery and equipment merchant wholesalers | 4.7 | 1081 |
| 1122 - Hog and pig farming | 4.5 | 396 |
| 4453 - Beer, wine and liquor stores | 4.4 | 2483 |
| 1114 - Greenhouse, nursery and floriculture production | 4.3 | 2233 |
| 7224 - Drinking places (alcoholic beverages) | 4.3 | 1136 |
| 3116 - Meat product manufacturing | 4.2 | 3145 |
| 3121 - Beverage manufacturing | 3.9 | 1316 |
| 4183 - Agricultural supplies merchant wholesalers | 3.9 | 643 |
| 3114 - Fruit and vegetable preserving and specialty food manufacturing | 3.8 | 999 |
| 3119 - Other food manufacturing | 3.7 | 1438 |
| 4131 - Food merchant wholesalers | 3.5 | 4041 |
| 3113 - Sugar and confectionary product manufacturing | 3.4 | 478 |
| 3118 - Bakeries and tortilla manufacturing | 3.4 | 1489 |
| 1123 - Poultry and egg production | 3.3 | 396 |
| 4451 - Grocery stores | 3.3 | 14618 |
| 3111 - Animal food manufacturing | 3.2 | 344 |
| 3112 - Grain and oilseed milling | 2.9 | 235 |
| 1121 - Cattle ranching and farming | 2.9 | 919 |
| 1111- Oilseed and grain farming | 2.8 | 599 |
|
Note: Insufficient data to report the following industries: 1113, 1124, 1125, 3122, 3123, 3253, 4132, 4133, 4134.
|
||