
For your convenience, this report is available in the following format: PDF (709 KB)
Table of contents
- Overview
- 1. Production
- 2. Canadian potato storage holdings
- 3. Revenue and prices
- 4. Potato availability
- 5. Trade
- 5.1. Canadian potatoes trade balance
- 5.2. Canadian potato exports
- 5.3. Canadian potato imports
- 6. World data
- 7. Key Resources
Overview
Potatoes are the fifth largest primary agriculture crop in Canada (after canola, wheat, soybean, and corn), contributing approximately $1.7 billion in farm cash receipts in 2022 and $3.4 billion dollars in exports of potatoes and potato products in 2022/2023Endnote 1.
In addition, potatoes are the largest vegetable crop grown in Canada, accounting for 28% of all vegetable receiptsEndnote 2 and 15% of all horticulturalEndnote 3 receipts. Potatoes also make a significant contribution to the agricultural sector in some provinces; for example, in 2022, potatoes contributed over 44% of the total farm cash receipts in Prince Edward Island, and 20% of the total farm cash receipts in New Brunswick. Manitoba and Alberta also have sizable potato sectors with higher total potato farm cash receipts than both Prince Edward Island and New Brunswick; however, potato farm cash receipts represent only 4% and 2%, respectively, of the total farm cash receipts for Manitoba and Alberta.
In Canada, potatoes are generally planted in the spring and harvested throughout the late-summer and fall. Potatoes are produced for three uses: seed, table market, and processing (frying, chipping, dehydration and others) and the relative importance of each sector differs greatly by province. Each category is comprised of unique end-uses and markets.
In 2022, potato growers across Canada produced approximately 5.7 million metric tons of potatoes. Canadian potato production is truly national, with production distributed across the country from coast-to-coast. Production on an area basis is distributed as 35.7% in Atlantic Canada, 18.7% in Central Canada, and 45.6% in the Prairie Provinces and British Columbia. The main producing provinces by volume were Prince Edward Island (21.6%), Manitoba (21.3%), Alberta (21.8%), New Brunswick (13.8%), Quebec (12.1%), and Ontario (6.6%).
Approximately 65% of the total production in 2022 was destined for the processing sector, 22% for the fresh/table sector, and 13% for the seed sector. Most processing potatoes are used to produce French fries, chips, and other processed potato products. The main French fry processing provinces, by volume, are Alberta, Manitoba, New Brunswick, and Prince Edward Island, while Ontario has the largest potato chip sector. Processing plants are usually located close to where production occurs. These processors offer contracts to potato growers for production of the quantities and varieties required, in advance of the growing season. Most growers have state-of-the-art storage and are responsible for keeping good quality potatoes as required by the retailers and processors.
Approximately 150 seed potato varieties are registered in Canada for commercial production. Prince Edward Island (24%), Alberta (25%), Quebec (13%), Manitoba (16.5%), and New Brunswick (10.5%) were the largest seed potato producing provinces in 2022.
Canada is a net exporter of potato and potato products and the U.S. is by far the most important market for Canadian potatoes. In 2022/2023, Canada exported $57 million for seed potatoes, $617 million for fresh potatoes, $2.3 billion worth of french fries and 339 million for other processed potato exports to all countries.
In 2022/2023, the U.S. market represented 87% ($50 million) for seed, 97% ($601 million) for fresh and 91% ($2.1 billion) for French fry exports. During the same period, Canada imported a total value of $528 million worth of potato and potato products from the U.S., accounting for 87% of total imports from all countries. Of that total imported value, $293 million was in processed potatoes ($112 million for frozen French fry and $281 million for other processed potatoes). The remaining $135 million was in fresh potatoes ($121.8 million for table stock potatoes and $12.8 million for seed potatoes).
Canada accounts for approximately 2% of global potato production. China is by far the leading producer of potatoes with 25% of world production, followed by India (14%) and Ukraine (6%).
Worldwide, Canada is among the top ten exporting countries for table stock and seed potatoes. In 2022, in terms of value, Canada ranked 4th in table potato exports, totalling $517 million, and ranked 6th in exports of seed potatoes with a value of $39 million.
Conversely, Canada ranked as the 12th largest importer of table potatoes in terms of value at $103 million, and ranked 17st globally for seed potatoes with imports totaling $13 million.
Belgium was the largest importer of table and Egypt was the largest importer of seed potatoes in terms of value, while France was the largest exporter for table potatoes and Netherlands was the largest exporter of seed potatoes.
1. Production
1.1. Canadian potato production
1.1.1. Seeded area by province (hectares)
| 2018 | 2019 | 2020 | 2021 | 2022 | 2022 % Share |
|
|---|---|---|---|---|---|---|
| Newfoundland and Labrador | 162 | 172 | 172 | 192 | 168 | 0.1% |
| Prince Edward Island | 34,803 | 34,601 | 33,832 | 34,398 | 33,467 | 21.4% |
| Nova Scotia | 567 | 583 | 486 | 486 | 324 | 0.2% |
| New Brunswick | 21,044 | 21,408 | 19,643 | 21,448 | 21,125 | 13.5% |
| Quebec | 16,979 | 17,607 | 18,585 | 18,711 | 19,396 | 12.4% |
| Ontario | 13,759 | 13,770 | 14,771 | 15,509 | 15,046 | 9.6% |
| Manitoba | 25,940 | 28,328 | 28,935 | 31,565 | 32,577 | 20.8% |
| Saskatchewan | 2,550 | 2,711 | 2,833 | 2,954 | 2,873 | 1.8% |
| Alberta | 22,519 | 24,781 | 24,150 | 27,701 | 29,574 | 18.9% |
| British Columbia | 2,671 | 2,711 | 2,630 | 2,550 | 2,104 | 1.3% |
| CanadaNote 1 | 140,993 | 146,672 | 146,037 | 155,515 | 156,655 | 100.0% |
|
||||||
1.1.2. Harvested area by province (hectares)
| 2018 | 2019 | 2020 | 2021 | 2022 | 2022 % Share |
|
|---|---|---|---|---|---|---|
| Newfoundland and Labrador | 138 | 132 | 148 | 152 | 142 | 0.1% |
| Prince Edward Island | 32,051 | 33,994 | 33,791 | 34,196 | 33,144 | 21.5% |
| Nova Scotia | 534 | 567 | 486 | 465 | 324 | 0.2% |
| New Brunswick | 20,639 | 21,367 | 19,607 | 21,044 | 20,882 | 13.5% |
| Quebec | 16,255 | 17,469 | 18,044 | 18,525 | 19,233 | 12.5% |
| Ontario | 13,658 | 13,568 | 14,488 | 15,096 | 15,014 | 9.7% |
| Manitoba | 23,796 | 23,067 | 28,814 | 31,565 | 32,071 | 20.8% |
| Saskatchewan | 2,388 | 2,509 | 2,550 | 2,752 | 2,630 | 1.7% |
| Alberta | 21,605 | 23,006 | 23,446 | 27,438 | 28,864 | 18.7% |
| British Columbia | 2,671 | 2,671 | 2,630 | 2,550 | 2,023 | 1.3% |
| CanadaNote 1 | 133,734 | 138,349 | 144,003 | 153,782 | 154,327 | 100.0% |
|
||||||
1.1.3. Potato production by province (metric tons)
| 2018 | 2019 | 2020 | 2021 | 2022 | 2022 % Share |
|
|---|---|---|---|---|---|---|
| Newfoundland and Labrador | 2,540 | 2,449 | 2,495 | 2,495 | 2,359 | 0.0% |
| Prince Edward Island | 1,025,119 | 1,102,320 | 952,544 | 1,234,180 | 1,206,556 | 21.6% |
| Nova Scotia | 16,556 | 18,869 | 13,608 | 16,193 | 10,886 | 0.2% |
| New Brunswick | 710,779 | 743,892 | 521,631 | 825,538 | 771,107 | 13.8% |
| Quebec | 508,976 | 573,704 | 577,468 | 639,565 | 673,313 | 12.1% |
| Ontario | 313,841 | 304,134 | 341,011 | 406,101 | 370,131 | 6.6% |
| Manitoba | 920,793 | 893,577 | 1,088,622 | 1,089,710 | 1,185,645 | 21.3% |
| Saskatchewan | 65,952 | 68,039 | 63,503 | 68,901 | 65,771 | 1.2% |
| Alberta | 987,108 | 985,112 | 1,061,724 | 1,116,472 | 1,216,217 | 21.8% |
| British Columbia | 95,254 | 97,296 | 97,749 | 94,347 | 72,575 | 1.3% |
| CanadaNote 1 | 4,646,918 | 4,789,437 | 4,720,355 | 5,493,503 | 5,574,560 | 100.0% |
|
||||||
1.1.4. Average yield by province (metric tons per harvested hectare)
| 018 | 2019 | 2020 | 2021 | 2022 | |
|---|---|---|---|---|---|
| Newfoundland and Labrador | 18.46 | 18.62 | 16.89 | 16.44 | 16.65 |
| Prince Edward Island | 31.98 | 32.43 | 28.19 | 36.09 | 36.40 |
| Nova Scotia | 30.99 | 33.31 | 28.02 | 34.80 | 33.63 |
| New Brunswick | 34.44 | 34.81 | 26.60 | 39.23 | 36.93 |
| Quebec | 31.31 | 32.84 | 32.00 | 34.52 | 35.01 |
| Ontario | 22.98 | 22.42 | 23.54 | 26.90 | 24.65 |
| Manitoba | 38.70 | 38.74 | 37.78 | 34.52 | 36.97 |
| Saskatchewan | 27.62 | 27.12 | 24.91 | 25.04 | 25.00 |
| Alberta | 45.69 | 42.82 | 45.28 | 40.69 | 42.14 |
| British Columbia | 35.66 | 36.43 | 37.16 | 37.01 | 35.87 |
| Canada | 34.75 | 34.62 | 32.78 | 35.72 | 36.12 |
| Source: Statistics Canada. Table 32-10-0358-01 Area, production and farm value of potatoes | |||||
1.2. Number of potato farmsNote 1 in Canada (2011, 2016 and 2021)
| 2011 | 2016 | 2021 | 2021 % Share | |
|---|---|---|---|---|
| Newfoundland and Labrador | 25 | 5 | 8 | 0.8% |
| Prince Edward Island | 262 | 202 | 175 | 18.4% |
| Nova Scotia | 13 | 7 | 9 | 0.9% |
| New Brunswick | 193 | 144 | 111 | 11.7% |
| Quebec | 224 | 191 | 198 | 20.8% |
| Ontario | 170 | 147 | 132 | 13.9% |
| Manitoba | 99 | 77 | 77 | 8.1% |
| Saskatchewan | 61 | 33 | 34 | 3.6% |
| Alberta | 149 | 125 | 123 | 12.9% |
| British Columbia | 127 | 74 | 84 | 8.8% |
| Canada | 1,323 | 1,005 | 951 | 100.0% |
|
||||
1.3. Top 50 registered seed potato varieties grown in Canada, total area accepted in 2022 (hectares)
| NFL | PEI | NS | NB | QC | ON | MB | SK | AB | BC | Total | |
|---|---|---|---|---|---|---|---|---|---|---|---|
| Russet Burbank | 426 | 29 | 862 | 39 | 1,508 | 57 | 1,810 | 0 | 4,731 | ||
| Goldrush | 4 | 189 | 84 | 882 | 13 | 14 | 3 | 56 | 2 | 1,246 | |
| Ho2000 | 458 | 120 | 321 | 899 | |||||||
| Ranger Russet | 107 | 1 | 0 | 377 | 23 | 368 | 0 | 876 | |||
| Norland | 0 | 138 | 46 | 139 | 1 | 110 | 141 | 66 | 2 | 642 | |
| Mountain Gem Russet | 477 | 29 | 24 | 35 | 9 | 574 | |||||
| Eva | 551 | 551 | |||||||||
| Dakota Russet | 441 | 16 | 0 | 67 | 1 | 12 | 537 | ||||
| Chieftain | 1 | 57 | 66 | 258 | 8 | 57 | 35 | 483 | |||
| Colomba | 21 | 144 | 30 | 80 | 9 | 126 | 409 | ||||
| Shepody | 150 | 19 | 95 | 3 | 2 | 4 | 21 | 102 | 0 | 396 | |
| Innovator | 100 | 118 | 0 | 117 | 16 | 351 | |||||
| Ciklamen | 11 | 10 | 14 | 225 | 66 | 9 | 334 | ||||
| Caribou Russet | 83 | 122 | 9 | 88 | 31 | 333 | |||||
| Russet Norkotah | 59 | 0 | 37 | 213 | 16 | 325 | |||||
| Satina | 205 | 0 | 104 | 7 | 317 | ||||||
| Milva | 19 | 46 | 249 | 2 | 315 | ||||||
| Prospect | 235 | 34 | 38 | 307 | |||||||
| Ivory Russet | 34 | 5 | 0 | 18 | 17 | 211 | 284 | ||||
| Envol | 1 | 214 | 40 | 255 | |||||||
| Superior | 2 | 106 | 18 | 118 | 5 | 249 | |||||
| Umatilla Russet | 121 | 7 | 117 | 246 | |||||||
| Sangre | 13 | 0 | 0 | 137 | 18 | 77 | 245 | ||||
| Atlantic | 0 | 1 | 153 | 6 | 9 | 66 | 235 | ||||
| Anouk | 0 | 155 | 1 | 75 | 231 | ||||||
| Bintje | 0 | 0 | 5 | 212 | 216 | ||||||
| Highland Russet | 57 | 116 | 34 | 2 | 209 | ||||||
| Clearwater Russet | 58 | 4 | 0 | 0 | 9 | 34 | 85 | 1 | 193 | ||
| Dakota Pearl | 27 | 0 | 54 | 30 | 80 | 0 | 190 | ||||
| Lamoka | 49 | 45 | 32 | 20 | 33 | 180 | |||||
| Orchestra | 140 | 5 | 22 | 167 | |||||||
| Perline | 81 | 26 | 59 | 165 | |||||||
| Kennebec | 61 | 42 | 3 | 7 | 1 | 1 | 10 | 37 | 162 | ||
| Whitney | 17 | 15 | 105 | 3 | 20 | 161 | |||||
| Sifra | 12 | 34 | 67 | 38 | 5 | 156 | |||||
| Targhee Russet | 117 | 9 | 1 | 19 | 146 | ||||||
| Tt-08-024/2010-06 | 25 | 98 | 12 | 135 | |||||||
| Yellow Star | 1 | 11 | 70 | 49 | 131 | ||||||
| Frisian Gold | 80 | 22 | 27 | 129 | |||||||
| Purple Prince | 62 | 12 | 46 | 120 | |||||||
| Alverstone Russet | 107 | 5 | 1 | 4 | 117 | ||||||
| Yukon Gold | 0 | 4 | 20 | 13 | 1 | 5 | 4 | 27 | 31 | 105 | |
| Actrice | 0 | 44 | 27 | 9 | 18 | 2 | 100 | ||||
| Volare | 56 | 16 | 25 | 97 | |||||||
| Reveille Russet | 24 | 71 | 94 | ||||||||
| Althea | 82 | 3 | 0 | 8 | 94 | ||||||
| Penni | 23 | 27 | 44 | 93 | |||||||
| Constance | 3 | 6 | 5 | 51 | 24 | 90 | |||||
| Vivaldi | 0 | 90 | 90 | ||||||||
| Vigor | 19 | 67 | 0 | 86 | |||||||
| Total top 50 registered varieties | 8 | 4,690 | 154 | 1,983 | 2,203 | 382 | 3,352 | 1,066 | 4,801 | 163 | 18,801 |
| Total other varietiesNote 1 | 3 | 890 | 7 | 454 | 822 | 287 | 479 | 360 | 1,045 | 63 | 4,409 |
| Total all | 11 | 5,580 | 161 | 2,437 | 3,025 | 669 | 3,831 | 1,426 | 5,846 | 225 | 23,210 |
|
|||||||||||
1.4. Total area of registered seed potato varieties grown in Canada – hectares accepted 2018-2022
| 2018 | 2019 | 2020 | 2021 | 2022 | 2022 % Share |
|
|---|---|---|---|---|---|---|
| Newfoundland and Labrador | 27 | 7 | 28 | 33 | 11 | 0.0% |
| Prince Edward Island | 6,387 | 6,858 | 6,555 | 6,982 | 5,580 | 24.0% |
| Nova Scotia | 149 | 131 | 152 | 159 | 161 | 0.7% |
| New Brunswick | 3,107 | 2,982 | 2,754 | 2,742 | 2,437 | 10.5% |
| Quebec | 2,728 | 2,917 | 3,108 | 3,293 | 3,025 | 13.0% |
| Ontario | 318 | 247 | 351 | 467 | 669 | 2.9% |
| Manitoba | 2,873 | 3,226 | 3,081 | 3,447 | 3,831 | 16.5% |
| Saskatchewan | 1,167 | 1,230 | 1,170 | 1,260 | 1,426 | 6.1% |
| Alberta | 4,864 | 5,268 | 5,477 | 5,860 | 5,846 | 25.2% |
| British Columbia | 308 | 297 | 275 | 266 | 225 | 1.0% |
| Total | 21,928 | 23,163 | 22,952 | 24,509 | 23,210 | 100.0% |
| Source: Canadian Food Inspection Agency, Potatoes Section | ||||||
2. Canadian potato storage holdings
2.1. Canadian potato storage by provinceNote 1 (hundreds of metric tons)
| Dec-22 | Jan-23 | Feb-23 | Mar-23 | Apr-23 | May-23 | Jun-23 | Jul-23 | |
|---|---|---|---|---|---|---|---|---|
| Prince Edward Island | 10,093 | 8,990 | 7,970 | 6,949 | 5,718 | 4,636 | 2,755 | 1,628 |
| New Brunswick | 5,256 | 4,734 | 4,085 | 3,475 | 2,785 | 2,095 | 1,105 | N/A |
| Quebec | 4,484 | 3,923 | 3,403 | 2,818 | 2,272 | 1,525 | 853 | 434 |
| Ontario | 2,577 | 2,233 | 1,843 | 1,552 | 1,102 | 786 | 449 | 61 |
| Manitoba | 7,956 | 7,033 | 5,923 | 4,967 | 4,024 | 2,931 | 1,277 | 368 |
| Alberta | 9,184 | 8,305 | 7,065 | 5,982 | 4,617 | 2,790 | 1,798 | 767 |
| British Columbia | 329 | 232 | 176 | 132 | 87 | 35 | 4 | 0 |
| Canada | 39,880 | 35,450 | 30,464 | 25,875 | 20,604 | 14,798 | 8,242 | 3,257 |
|
||||||||
2.2. Canadian potato storage
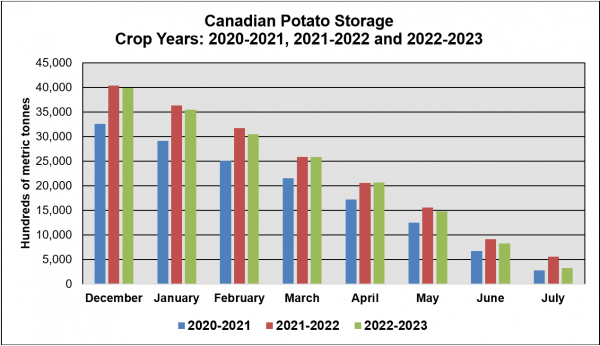
Description of above image
Canadian Potato Storage Crop Years: 2020-2021, 2021-2022 and 2022-2023 (hundreds of metric tonnes per month)
| December | January | February | March | April | May | June | July | |
|---|---|---|---|---|---|---|---|---|
| 2020-2021 | 32,548 | 29,112 | 25,106 | 21,480 | 17,238 | 12,444 | 6,760 | 2,764 |
| 2021-2022 | 40,319 | 36,358 | 31,687 | 25,882 | 20,572 | 15,576 | 9,109 | 5,587 |
| 2022-2023 | 39,880 | 35,450 | 30,464 | 25,875 | 20,604 | 14,798 | 8,242 | 3,257 |
2.3. Intended utilization of potatoes by province (hundreds of metric tons)
| Dec-22 | Jan-23 | Feb-23 | Mar-23 | Apr-23 | May-23 | Jun-23 | Jul-23 | ||
|---|---|---|---|---|---|---|---|---|---|
| Prince Edward Island | Fresh | 3,283 | 2,783 | 2,345 | 1,925 | 1,376 | 940 | 507 | 185 |
| Processed | 6,040 | 5,437 | 4,866 | 4,271 | 3,591 | 2,947 | 2,201 | 1,439 | |
| Seed | 771 | 770 | 759 | 753 | 751 | 749 | 48 | 5 | |
| New Brunswick | Fresh | 1,067 | 987 | 908 | 827 | 710 | 582 | 505 | N/A |
| Processed | 3,401 | 2,988 | 2,446 | 1,944 | 1,401 | 894 | 366 | N/A | |
| Seed | 788 | 759 | 731 | 704 | 674 | 620 | 233 | N/A | |
| Quebec | Fresh | 2,038 | 1,746 | 1,437 | 1,143 | 842 | 597 | 343 | 116 |
| Processed | 1,837 | 1,659 | 1,454 | 1,202 | 1,032 | 731 | 500 | 318 | |
| Seed | 609 | 517 | 513 | 473 | 398 | 197 | 11 | 0 | |
| Ontario | Fresh | 634 | 479 | 375 | 298 | 233 | 152 | 80 | 9 |
| Processed | 1,853 | 1,664 | 1,378 | 1,163 | 816 | 611 | 367 | 52 | |
| Seed | 90 | 89 | 90 | 91 | 53 | 24 | 1 | 0 | |
| Manitoba | Fresh | 834 | 719 | 590 | 483 | 348 | 274 | 180 | 100 |
| Processed | 6,220 | 5,412 | 4,431 | 3,581 | 2,774 | 1,809 | 1,098 | 268 | |
| Seed | 902 | 902 | 902 | 902 | 902 | 848 | 0 | 0 | |
| Alberta | Fresh | 731 | 650 | 447 | 283 | 176 | 34 | 0 | 0 |
| Processed | 6,699 | 5,945 | 5,052 | 4,345 | 3,413 | 2,643 | 1,796 | 767 | |
| Seed | 1,754 | 1,711 | 1,565 | 1,354 | 1,029 | 113 | 2 | 0 | |
| British Columbia | Fresh | 275 | 187 | 137 | 93 | 48 | 20 | 4 | 0 |
| Processed | 0 | 0 | 0 | 0 | 0 | 0 | 0 | 0 | |
| Seed | 54 | 45 | 39 | 39 | 39 | 15 | 0 | 0 | |
| Notes: 1. Storage data for Newfoundland and Labrador, Nova Scotia and Saskatchewan are not available. N/A: Not available. This table is done in conjunction with the storage holdings and indicates the intended utilization as reported by the storage operators of either the fresh market, seed market or processing market. The storage operator's intent may change during the month depending on the demand. Source: AAFC (Infohort) |
|||||||||
2.4. Percentage of intended utilization of potatoes – total
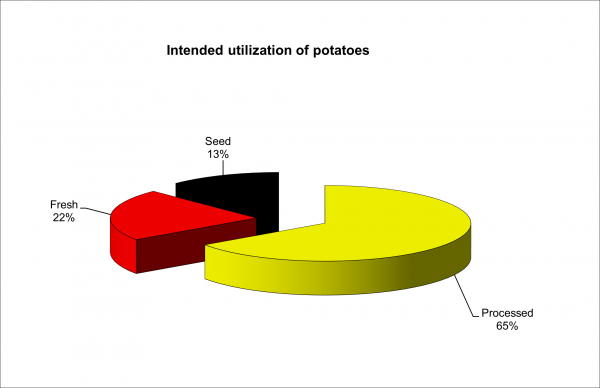
Storage holdings as of December 1, 2022.
Source: AAFC (Infohort)
Description of above image
2022/2023 Intended utilization of potatoes
| Processed | 65% |
|---|---|
| Fresh | 22% |
| Seed | 13% |
2.5. Percentage of intended utilization of potatoes by province
| % Fresh | % Processed | % Seed | |
|---|---|---|---|
| Prince Edward Island | 32.5% | 59.8% | 7.6% |
| New Brunswick | 20.3% | 64.7% | 15.0% |
| Quebec | 45.5% | 41.0% | 13.6% |
| Ontario | 24.6% | 71.9% | 3.5% |
| Manitoba | 10.5% | 78.2% | 11.3% |
| Alberta | 8.0% | 72.9% | 19.1% |
| British Columbia | 83.6% | 0.0% | 16.4% |
| Note: Details of intended utilization are not available for Newfoundland and Labrador, Nova Scotia, Saskatchewan, and have therefore not been used in this section. Source: AAFC (Infohort) |
|||
3. Revenue and prices
3.1. Potato farm cash receipts (CAN$ ‘000)
| 2018 | 2019 | 2020 | 2021 | 2022 | 2022 % Share |
|
|---|---|---|---|---|---|---|
| Newfoundland and Labrador | 1,349 | 1,307 | 1,305 | 1,317 | 1,246 | 0.1% |
| Prince Edward Island | 229,778 | 234,237 | 252,085 | 218,187 | 330,798 | 19.2% |
| Nova Scotia | 6,220 | 6,873 | 5,227 | 6,115 | 4,661 | 0.3% |
| New Brunswick | 171,654 | 166,836 | 153,504 | 166,152 | 233,418 | 13.5% |
| Quebec | 157,809 | 176,429 | 181,109 | 185,203 | 246,238 | 14.3% |
| Ontario | 123,280 | 108,099 | 112,123 | 132,602 | 148,188 | 8.6% |
| Manitoba | 256,440 | 240,296 | 283,621 | 305,802 | 357,417 | 20.7% |
| Saskatchewan | 30,992 | 34,254 | 32,046 | 31,585 | 35,004 | 2.0% |
| Alberta | 252,853 | 253,847 | 271,918 | 287,888 | 312,175 | 18.1% |
| British Columbia | 48,842 | 61,391 | 60,732 | 62,886 | 55,896 | 3.2% |
| Canada | 1,279,217 | 1,283,570 | 1,353,669 | 1,397,736 | 1,725,041 | 100.0% |
| Note: Potato farm cash receipts refer to market receipts, excluding program payments. They represent the income received from the sale of potatoes. Source: Statistics Canada. Table 32-10-0045-01 Farm cash receipts, annual (x 1,000) |
||||||
3.2. Canadian potato farm average pricesNote 1 (CAN$ per ton metric)
| 2018 | 2019 | 2020 | 2021 | 2022 | |
|---|---|---|---|---|---|
| Newfoundland and Labrador | .. | .. | .. | .. | .. |
| Prince Edward Island | 254.85 | 281.31 | 295.86 | 313.28 | 320.99 |
| Nova Scotia | .. | .. | .. | .. | .. |
| New Brunswick | 274.48 | 285.50 | 303.36 | 310.63 | 341.50 |
| Quebec | 350.53 | 380.96 | 371.92 | 390.22 | 409.84 |
| Ontario | 401.90 | 406.97 | 406.09 | 406.31 | 427.26 |
| Manitoba | 293.66 | 313.72 | 338.85 | 326.50 | 354.94 |
| Saskatchewan | .. | .. | .. | .. | .. |
| Alberta | 276.46 | 297.84 | 299.17 | 310.19 | 330.03 |
| British Columbia | 649.26 | 682.33 | 736.56 | 757.51 | 789.25 |
| Canada | 302.92 | 326.50 | 336.65 | 344.80 | 362.44 |
|
|||||
4. Potato availability
4.1. Potatoes availableNote 1 in CanadaNote 2 (kilograms per person)
| 2018 | 2019 | 2020 | 2021 | 2022 | |
|---|---|---|---|---|---|
| Potatoes-chips | 3.65 | 3.60 | 3.70 | 3.90 | 3.94 |
| Potatoes-chips, fresh equivalent | 12.77 | 12.62 | 12.96 | 13.65 | 13.77 |
| Potatoes-frozen | 4.12 | 5.82 | 6.11 | 6.47 | 4.30 |
| Potatoes-frozen, fresh equivalent | 7.00 | 9.89 | 10.38 | 11.00 | 7.31 |
| Potatoes-other processed | 4.02 | 4.26 | 4.12 | 4.63 | 4.46 |
| Potatoes-other processed, fresh equivalent | 10.61 | 11.24 | 10.88 | 12.21 | 11.78 |
| Potatoes-total processed | 11.78 | 13.68 | 13.93 | 15.00 | 12.70 |
| Potatoes-total processed, fresh equivalent | 30.38 | 33.74 | 34.22 | 36.87 | 32.87 |
| Potatoes-white fresh | 20.30 | 27.34 | 23.24 | 30.56 | 32.37 |
| Potatoes-white fresh and processed, fresh equivalent | 50.68 | 61.08 | 57.46 | 67.44 | 65.24 |
|
|||||
4.2. Potatoes availableNote 1 in Canada adjusted for lossesNote 2 (kilograms per person)
| 2018 | 2019 | 2020 | 2021 | 2022 | |
|---|---|---|---|---|---|
| Potatoes-chips | 3.29 | 3.25 | 3.34 | 3.52 | 3.55 |
| Potatoes-frozen | 3.25 | 4.59 | 4.82 | 5.11 | 3.40 |
| Potatoes-other processed | 3.37 | 3.57 | 3.46 | 3.88 | 3.74 |
| Potatoes-total processed | 9.91 | 11.42 | 11.62 | 12.51 | 10.69 |
| Potatoes-white fresh | 14.07 | 18.95 | 16.11 | 21.19 | 22.44 |
| Potatoes-white fresh and processed | 35.40 | 42.66 | 40.13 | 47.10 | 45.57 |
|
|||||
5. TradeEndnote 4
5.1. Canadian potatoes trade balance (CAN$)
| 2018/19 | 2019/20 | 2020/21 | 2021/22 | 2022/23 | ||
|---|---|---|---|---|---|---|
| Exports | Fresh potatoes | 257,480,222 | 334,997,298 | 319,745,891 | 421,163,753 | 616,958,193 |
| Seed potatoes | 37,885,858 | 41,834,238 | 42,300,310 | 37,262,407 | 57,508,036 | |
| Frozen potatoes | 1,418,605,108 | 1,366,479,307 | 1,506,488,493 | 1,883,597,424 | 2,355,247,482 | |
| Other processed potatoes | 165,580,910 | 187,237,056 | 203,535,080 | 212,937,530 | 339,095,721 | |
| Total exports | 1,879,552,098 | 1,930,547,899 | 2,072,069,774 | 2,554,961,114 | 3,368,809,432 | |
| Imports | Fresh potatoes | 130,115,564 | 113,747,014 | 117,513,628 | 99,195,542 | 121,833,558 |
| Seed potatoes | 9,102,473 | 9,143,410 | 10,903,293 | 12,423,274 | 12,801,061 | |
| Frozen potatoes | 103,897,675 | 103,169,142 | 85,817,618 | 109,363,357 | 112,225,015 | |
| Other processed potatoes | 204,565,972 | 207,177,153 | 217,609,372 | 230,712,504 | 280,939,841 | |
| Total imports | 447,681,684 | 433,236,719 | 431,843,911 | 451,694,677 | 527,799,475 | |
| Trade balance (exports - imports) | Fresh potatoes | 127,364,658 | 221,250,284 | 202,232,263 | 321,968,211 | 495,124,635 |
| Seed potatoes | 28,783,385 | 32,690,828 | 31,397,017 | 24,839,133 | 44,706,975 | |
| Frozen potatoes | 1,314,707,433 | 1,263,310,165 | 1,420,670,875 | 1,774,234,067 | 2,243,022,467 | |
| Other processed potatoes | -38,985,062 | -19,940,097 | -14,074,292 | -17,774,974 | 58,155,880 | |
| Overall trade balance | 1,431,870,414 | 1,497,311,180 | 1,640,225,863 | 2,103,266,437 | 2,841,009,957 | |
| Notes: Fresh potatoes do not include seed potatoes. Frozen potatoes include uncooked potatoes, potatoes cooked by steaming or boiling water, prepared or preserved potatoes (other than by vinegar or acetic acid) in the frozen state. Other processed potatoes include potato chips; potato starch, flakes, granules and pellets; potato flour, meal and powder; and dried potatoes. Source: Statistics Canada (CATSnet, September 2023) |
||||||
5.2. Canadian potato exports
5.2.1. Fresh potatoes
5.2.1.1. Fresh potato exports by province, value (CAN$)
| 2018/19 | 2019/20 | 2020/21 | 2021/22 | 2022/23 | 2022/23 % Share |
|
|---|---|---|---|---|---|---|
| Newfoundland and Labrador | 0 | 85 | 347 | 0 | 1,017 | 0.0% |
| Prince Edward Island | 77,244,751 | 98,824,358 | 112,935,876 | 102,866,225 | 224,933,018 | 36.5% |
| Nova Scotia | 217,710 | 330,623 | 481,902 | 120,128 | 267,174 | 0.0% |
| New Brunswick | 43,966,821 | 66,554,067 | 53,114,079 | 86,417,520 | 107,807,055 | 17.5% |
| Quebec | 26,221,084 | 46,784,393 | 45,279,179 | 80,538,124 | 103,205,795 | 16.7% |
| Ontario | 31,045,138 | 30,456,995 | 42,751,958 | 58,411,270 | 86,543,337 | 14.0% |
| Manitoba | 38,985,126 | 55,555,468 | 31,407,104 | 36,766,266 | 40,219,176 | 6.5% |
| Saskatchewan | 6,146,558 | 7,999,071 | 6,701,487 | 16,843,732 | 14,026,140 | 2.3% |
| Alberta | 26,884,315 | 21,561,786 | 19,376,531 | 30,489,375 | 34,313,222 | 5.6% |
| British Columbia | 6,768,719 | 6,930,452 | 7,697,428 | 8,711,113 | 5,642,259 | 0.9% |
| Canada | 257,480,222 | 334,997,298 | 319,745,891 | 421,163,753 | 616,958,193 | 100.0% |
| Note: Does not include seed potatoes. Source: Statistics Canada (CATSnet, September 2023) |
||||||
5.2.1.2. Fresh potato exports by province, quantity (metric tons)
| 2018/19 | 2019/20 | 2020/21 | 2021/22 | 2022/23 | 2022/23 % Share |
|
|---|---|---|---|---|---|---|
| Newfoundland and Labrador | 0 | 0 | 1 | 0 | 2 | 0.0% |
| Prince Edward Island | 100,834 | 127,666 | 134,179 | 112,080 | 213,211 | 33.4% |
| Nova Scotia | 242 | 444 | 720 | 176 | 237 | 0.0% |
| New Brunswick | 74,523 | 89,021 | 73,109 | 109,252 | 121,930 | 19.1% |
| Quebec | 34,205 | 54,876 | 61,351 | 97,955 | 100,419 | 15.7% |
| Ontario | 72,733 | 69,058 | 87,886 | 117,599 | 108,748 | 17.0% |
| Manitoba | 62,794 | 65,857 | 42,260 | 40,692 | 43,639 | 6.8% |
| Saskatchewan | 6,689 | 7,591 | 6,509 | 12,117 | 10,108 | 1.6% |
| Alberta | 17,317 | 17,206 | 13,504 | 20,260 | 36,091 | 5.7% |
| British Columbia | 5,914 | 6,225 | 6,667 | 7,284 | 3,710 | 0.6% |
| Canada | 375,251 | 437,944 | 426,186 | 517,415 | 638,095 | 100.0% |
| Note: Does not include seed potatoes. Source: Statistics Canada (CATSnet, September 2023) |
||||||
5.2.1.3. Fresh potato export destinations, value (CAN$)
| 2018/19 | 2019/20 | 2020/21 | 2021/22 | 2022/23 | 2022/23 % Share |
|
|---|---|---|---|---|---|---|
| United States | 240,360,436 | 318,897,712 | 306,922,831 | 402,481,783 | 586,085,081 | 95.0% |
| Indonesia | 974,894 | 2,093,904 | 1,405,396 | 2,737,543 | 8,030,718 | 1.3% |
| Guatemala | 1,000,991 | 2,472,377 | 516,422 | 1,154,295 | 5,665,268 | 0.9% |
| Dominican Republic | 368,003 | 979,927 | 1,206,895 | 3,025,991 | 4,796,868 | 0.8% |
| Thailand | 7,124,286 | 4,542,762 | 4,764,688 | 5,072,000 | 3,504,924 | 0.6% |
| Others | 7,651,612 | 6,010,616 | 4,929,659 | 6,692,141 | 8,875,334 | 1.4% |
| Total | 257,480,222 | 334,997,298 | 319,745,891 | 421,163,753 | 616,958,193 | 100.0% |
| Note: Does not include seed potatoes. Source: Statistics Canada (CATSnet, September 2023) |
||||||
5.2.1.4. Fresh potato export destinations, quantity (metric tons)
| 2018/19 | 2019/20 | 2020/21 | 2021/22 | 2022/23 | 2022/23 % Share |
|
|---|---|---|---|---|---|---|
| United States | 342,421 | 407,659 | 406,538 | 486,844 | 601,064 | 94.2% |
| Indonesia | 2,016 | 4,032 | 2,828 | 5,544 | 9,490 | 1.5% |
| Guatemala | 1,752 | 4,176 | 960 | 1,968 | 5,250 | 0.8% |
| Dominican Republic | 574 | 2,045 | 1,873 | 4,857 | 5,589 | 0.9% |
| Thailand | 15,082 | 8,977 | 6,339 | 7,331 | 4,482 | 0.7% |
| Others | 13,406 | 11,055 | 7,648 | 10,871 | 12,220 | 1.9% |
| Total | 375,251 | 437,944 | 426,186 | 517,415 | 638,095 | 100.0% |
| Note: Does not include seed potatoes. Source: Statistics Canada (CATSnet, September 2023) |
||||||
5.2.2. Seed potatoes
5.2.2.1. Seed potato exports by province, value (CAN$)
| 2018/19 | 2019/20 | 2020/21 | 2021/22 | 2022/23 | 2022/23 % Share |
|
|---|---|---|---|---|---|---|
| Newfoundland and Labrador | 0 | 0 | 0 | 0 | 0 | 0.0% |
| Prince Edward Island | 5,197,556 | 5,096,054 | 4,103,626 | F | F | N/A |
| Nova Scotia | 155,912 | 11,355 | 24,079 | 0 | 0 | 0.0% |
| New Brunswick | 5,756,362 | 6,940,529 | 5,821,203 | 5,721,320 | 7,535,681 | 13.1% |
| Quebec | 1,005,200 | 1,230,448 | 1,748,454 | 1,457,243 | 1,770,900 | 3.1% |
| Ontario | 342,937 | 217,230 | 173,810 | 226,551 | 139,224 | 0.2% |
| Manitoba | 1,303,400 | 3,171,214 | 6,590,733 | 2,099,561 | 5,823,627 | 10.1% |
| Saskatchewan | 2,803,377 | 2,838,745 | 3,672,105 | 3,675,425 | 4,877,165 | 8.5% |
| Alberta | 19,181,227 | 20,354,137 | 18,531,778 | 19,644,649 | 28,153,080 | 49.0% |
| British Columbia | 2,139,887 | 1,974,526 | 1,634,522 | 1,569,910 | 1,344,381 | 2.3% |
| Canada | 37,885,858 | 41,834,238 | 42,300,310 | 37,262,407 | 57,508,036 | 100.0% |
| F: Too unreliable to be published. N/A: Not applicable. Source: Statistics Canada (CATSnet, September 2023) |
||||||
5.2.2.2. Seed potato exports by province, quantity (metric tons)
| 2018/19 | 2019/20 | 2020/21 | 2021/22 | 2022/23 | 2022/23 % Share |
|
|---|---|---|---|---|---|---|
| Newfoundland and Labrador | 0 | 0 | 0 | 0 | 0 | 0.0% |
| Prince Edward Island | 7,736 | 7,262 | 7,204 | F | F | N/A |
| Nova Scotia | 416 | 10 | 43 | 0 | 0 | 0.0% |
| New Brunswick | 11,478 | 12,361 | 10,487 | 9,593 | 10,959 | 13.6% |
| Quebec | 1,537 | 1,687 | 2,645 | 2,164 | 2,448 | 3.0% |
| Ontario | 601 | 390 | 253 | 325 | 180 | 0.2% |
| Manitoba | 2,222 | 4,712 | 13,410 | 3,074 | 4,244 | 5.3% |
| Saskatchewan | 5,406 | 4,830 | 5,810 | 6,320 | 7,360 | 9.1% |
| Alberta | 40,605 | 39,224 | 37,245 | 35,852 | 42,780 | 53.0% |
| British Columbia | 3,237 | 2,863 | 2,603 | 2,474 | 1,600 | 2.0% |
| Canada | 73,238 | 73,339 | 79,700 | 65,820 | 80,743 | 100.0% |
| F: Too unreliable to be published. N/A: Not applicable. Source: Statistics Canada (CATSnet, September 2023) |
||||||
5.2.2.3. Seed potato export destinations, value (CAN$)
| 2018/19 | 2019/20 | 2020/21 | 2021/22 | 2022/23 | 2022/23 % Share |
|
|---|---|---|---|---|---|---|
| United States | 35,585,150 | 39,488,591 | 38,377,629 | 34,053,088 | 50,279,560 | 87.4% |
| Trinidad and Tobago | 80,826 | 20,749 | 784,902 | 1,230,702 | 3,335,599 | 5.8% |
| Thailand | 341,366 | 591,049 | 382,489 | 531,654 | 1,453,262 | 2.5% |
| Panama | 0 | 0 | 310,783 | 223,312 | 869,084 | 1.5% |
| Dominican Republic | 343,072 | 197,684 | 506,429 | 331,106 | 637,081 | 1.1% |
| Others | 1,535,444 | 1,536,165 | 1,938,078 | 892,545 | 933,450 | 1.6% |
| Total | 37,885,858 | 41,834,238 | 42,300,310 | 37,262,407 | 57,508,036 | 100.0% |
| Source: Statistics Canada (CATSnet, September 2023) | ||||||
5.2.2.4. Seed potato export destinations, quantity (metric tons)
| 2018/19 | 2019/20 | 2020/21 | 2021/22 | 2022/23 | 2022/23 % Share |
|
|---|---|---|---|---|---|---|
| United States | 70,047 | 70,249 | 72,896 | 59,339 | 70,484 | 87.3% |
| Trinidad and Tobago | 165 | 55 | 2,155 | 3,001 | 4,997 | 6.2% |
| Thailand | 422 | 700 | 504 | 675 | 2,252 | 2.8% |
| Panama | 0 | 0 | 590 | 372 | 952 | 1.2% |
| Dominican Republic | 455 | 258 | 741 | 888 | 803 | 1.0% |
| Others | 2,149 | 2,077 | 2,814 | 1,545 | 1,255 | 1.6% |
| Total | 73,238 | 73,339 | 79,700 | 65,820 | 80,743 | 100.0% |
| Source: Statistics Canada (CATSnet, September 2023) | ||||||
5.2.3. Frozen potatoes
5.2.3.1. Frozen potato exports by province, value (CAN$)
| 2018/19 | 2019/20 | 2020/21 | 2021/22 | 2022/23 | 2022/23 % Share |
|
|---|---|---|---|---|---|---|
| Newfoundland and Labrador | 105,155 | 106 | 0 | 44,021 | 0 | 0.0% |
| Prince Edward Island | 286,514,421 | 369,208,454 | 359,030,258 | 437,116,118 | 584,241,534 | 24.8% |
| Nova Scotia | 785,448 | 282,889 | 1,077,865 | 2,700,255 | 58,160 | 0.0% |
| New Brunswick | 256,189,818 | 155,109,786 | 113,808,549 | 185,242,256 | 339,391,227 | 14.4% |
| Quebec | 3,360,014 | 2,339,389 | 628,584 | 2,120,509 | 9,547,016 | 0.4% |
| Ontario | 65,989,330 | 45,282,359 | 35,495,549 | 52,350,343 | 68,579,129 | 2.9% |
| Manitoba | 416,671,362 | 438,234,618 | 574,931,268 | 698,588,551 | 644,326,627 | 27.4% |
| Saskatchewan | 280,243 | 24,245 | 0 | 0 | 0 | 0.0% |
| Alberta | 387,654,704 | 352,490,824 | 406,697,583 | 486,000,814 | 688,816,964 | 29.2% |
| British Columbia | 1,054,613 | 3,506,637 | 14,818,837 | 19,434,557 | 20,286,825 | 0.9% |
| Canada | 1,418,605,108 | 1,366,479,307 | 1,506,488,493 | 1,883,597,424 | 2,355,247,482 | 100.0% |
| Source: Statistics Canada (CATSnet, September 2023) | ||||||
5.2.3.2. Frozen potato exports by province, quantity (kilograms)
| 2018/19 | 2019/20 | 2020/21 | 2021/22 | 2022/23 | 2022/23 % Share |
|
|---|---|---|---|---|---|---|
| Newfoundland and Labrador | 45,237 | 86 | 0 | 35,555 | 0 | 0.0% |
| Prince Edward Island | 200,951,240 | 242,908,391 | 239,362,606 | 260,691,952 | 271,093,104 | 20.2% |
| Nova Scotia | 574,429 | 396,477 | 866,365 | 1,754,831 | 56,409 | 0.0% |
| New Brunswick | 169,669,294 | 107,531,072 | 81,123,625 | 126,448,237 | 233,051,417 | 17.4% |
| Quebec | 2,716,079 | 1,852,653 | 558,791 | 1,538,117 | 4,174,930 | 0.3% |
| Ontario | 44,316,281 | 28,776,464 | 23,757,969 | 32,536,647 | 32,829,303 | 2.4% |
| Manitoba | 391,822,273 | 385,658,012 | 483,363,076 | 561,246,043 | 465,065,890 | 34.7% |
| Saskatchewan | 229,487 | 17,636 | 0 | 0 | 0 | 0.0% |
| Alberta | 244,790,570 | 227,956,596 | 283,794,191 | 308,450,501 | 322,146,456 | 24.0% |
| British Columbia | 504,871 | 2,459,812 | 11,651,723 | 13,817,770 | 12,788,465 | 1.0% |
| Canada | 1,055,619,761 | 997,557,199 | 1,124,478,346 | 1,306,519,653 | 1,341,205,974 | 100.0% |
| Source: Statistics Canada (CATSnet, September 2023) | ||||||
5.2.3.3. Frozen potato export destinations, value (CAN$)
| 2018/19 | 2019/20 | 2020/21 | 2021/22 | 2022/23 | 2022/23 % Share |
|
|---|---|---|---|---|---|---|
| United States | 1,196,225,951 | 1,208,034,290 | 1,348,789,076 | 1,683,653,434 | 2,142,187,416 | 91.0% |
| Mexico | 58,780,824 | 34,340,576 | 29,491,110 | 46,631,839 | 49,412,962 | 2.1% |
| Japan | 29,561,769 | 20,139,472 | 48,627,027 | 43,638,173 | 40,337,351 | 1.7% |
| Taiwan | 15,018,732 | 14,930,402 | 16,797,221 | 18,704,289 | 18,651,472 | 0.8% |
| Panama | 2,664,963 | 6,123,730 | 12,155,968 | 14,089,954 | 17,438,075 | 0.7% |
| Others | 116,352,869 | 82,910,837 | 50,628,091 | 76,879,735 | 87,220,206 | 3.7% |
| Total | 1,418,605,108 | 1,366,479,307 | 1,506,488,493 | 1,883,597,424 | 2,355,247,482 | 100.0% |
| Source: Statistics Canada (CATSnet, September 2023) | ||||||
5.2.3.4. Frozen potato export destinations, quantity (kilograms)
| 2018/19 | 2019/20 | 2020/21 | 2021/22 | 2022/23 | 2022/23 % Share |
|
|---|---|---|---|---|---|---|
| United States | 905,818,858 | 876,332,692 | 995,166,748 | 1,151,376,187 | 1,184,837,367 | 88.3% |
| Mexico | 46,448,006 | 31,156,628 | 26,020,515 | 38,368,166 | 36,018,730 | 2.7% |
| Japan | 19,939,108 | 18,324,559 | 41,857,145 | 34,779,684 | 27,629,399 | 2.1% |
| Taiwan | 8,191,838 | 10,344,807 | 12,797,180 | 14,230,298 | 13,948,936 | 1.0% |
| Panama | 1,891,352 | 5,081,565 | 10,417,835 | 11,871,259 | 12,278,924 | 0.9% |
| Others | 73,330,599 | 56,316,948 | 38,218,923 | 55,894,059 | 66,492,618 | 5.0% |
| Total | 1,055,619,761 | 997,557,199 | 1,124,478,346 | 1,306,519,653 | 1,341,205,974 | 100.0% |
| Source: Statistics Canada (CATSnet, September 2023) | ||||||
5.2.4. Other processed potatoes
5.2.4.1. Other processed potatoNote 1 exports by province, value (CAN$)
| 2018/19 | 2019/20 | 2020/21 | 2021/22 | 2022/23 | 2022/23 % Share |
|
|---|---|---|---|---|---|---|
| Newfoundland and Labrador | 5,266 | 3,260 | 4,976 | 6,114 | 5,895 | 0.0% |
| Prince Edward Island | 13,229,504 | 16,754,417 | 21,966,175 | 19,426,923 | 38,069,273 | 11.2% |
| Nova Scotia | 517,814 | 432,575 | 696,361 | 440,984 | 968,144 | 0.3% |
| New Brunswick | 20,623,752 | 30,540,012 | 25,244,053 | 34,309,661 | 49,444,591 | 14.6% |
| Quebec | 1,644,866 | 5,399,590 | 9,736,066 | 6,252,784 | 6,653,573 | 2.0% |
| Ontario | 111,707,245 | 120,240,690 | 126,655,469 | 129,345,824 | 184,105,112 | 54.3% |
| Manitoba | 4,340,106 | 1,997,643 | 3,806,047 | 7,262,390 | 11,250,345 | 3.3% |
| Saskatchewan | 4,438 | 0 | 0 | 0 | 9,969 | 0.0% |
| Alberta | 12,737,367 | 10,130,554 | 9,420,140 | 9,692,539 | 39,715,804 | 11.7% |
| British Columbia | 770,552 | 1,738,315 | 6,005,793 | 6,200,311 | 8,873,015 | 2.6% |
| Canada | 165,580,910 | 187,237,056 | 203,535,080 | 212,937,530 | 339,095,721 | 100.0% |
|
||||||
5.2.4.2. Other processed potatoNote 1 exports by province, quantity (kilograms)
| 2018/19 | 2019/20 | 2020/21 | 2021/22 | 2022/23 | 2022/23 % Share |
|
|---|---|---|---|---|---|---|
| Newfoundland and Labrador | 837 | 597 | 913 | 1,123 | 1,082 | 0.0% |
| Prince Edward Island | 8,987,785 | 9,292,923 | 11,861,757 | 11,522,634 | 16,893,120 | 20.2% |
| Nova Scotia | 531,916 | 386,266 | 580,217 | 531,297 | 948,026 | 1.1% |
| New Brunswick | 12,427,787 | 15,931,168 | 11,664,688 | 16,324,159 | 17,367,478 | 20.8% |
| Quebec | 1,454,874 | 2,042,204 | 2,569,720 | 1,900,833 | 2,028,126 | 2.4% |
| Ontario | 22,374,262 | 23,493,787 | 25,395,619 | 24,048,849 | 26,047,851 | 31.2% |
| Manitoba | 2,431,466 | 848,565 | 1,811,783 | 4,611,079 | 5,799,621 | 7.0% |
| Saskatchewan | 35,835 | 0 | 0 | 0 | 3,100 | 0.0% |
| Alberta | 11,654,391 | 10,058,435 | 11,764,401 | 11,829,298 | 13,280,695 | 15.9% |
| British Columbia | 112,958 | 233,239 | 753,634 | 802,452 | 1,056,744 | 1.3% |
| Canada | 60,012,111 | 62,287,184 | 66,402,732 | 71,571,724 | 83,425,843 | 100.0% |
|
||||||
5.2.4.3. Other processed potatoNote 1 export destinations, value (CAN$)
| 2018/19 | 2019/20 | 2020/21 | 2021/22 | 2022/23 | 2022/23 % Share |
|
|---|---|---|---|---|---|---|
| United States | 154,214,610 | 176,472,944 | 193,913,708 | 205,156,793 | 331,580,285 | 97.8% |
| Japan | 212,183 | 175,543 | 42,737 | 1,436,971 | 1,778,164 | 0.5% |
| Chile | 522,983 | 1,425,037 | 1,771,460 | 1,732,839 | 1,440,691 | 0.4% |
| Belgium | 120,179 | 199,360 | 217,982 | 247,082 | 681,235 | 0.2% |
| Argentina | 395,205 | 0 | 311,752 | 212,922 | 632,256 | 0.2% |
| Others | 10,115,750 | 8,964,172 | 7,277,441 | 4,150,923 | 2,983,090 | 0.9% |
| Total | 165,580,910 | 187,237,056 | 203,535,080 | 212,937,530 | 339,095,721 | 100.0% |
|
||||||
5.2.4.4. Other processed potatoNote 1 export destinations, quantity (kilograms)
| 2018/19 | 2019/20 | 2020/21 | 2021/22 | 2022/23 | 2022/23 % Share |
|
|---|---|---|---|---|---|---|
| United States | 57,635,936 | 60,412,857 | 64,524,573 | 69,883,240 | 81,621,042 | 97.8% |
| Japan | 44,952 | 35,088 | 7,846 | 289,568 | 248,681 | 0.3% |
| Chile | 73,671 | 205,383 | 234,679 | 290,153 | 267,961 | 0.3% |
| Belgium | 50,907 | 65,767 | 46,357 | 42,500 | 355,933 | 0.4% |
| Argentina | 232,093 | 0 | 174,325 | 156,726 | 188,828 | 0.2% |
| Others | 1,974,552 | 1,568,089 | 1,414,952 | 909,537 | 743,398 | 0.9% |
| Total | 60,012,111 | 62,287,184 | 66,402,732 | 71,571,724 | 83,425,843 | 100.0% |
|
||||||
5.2.5. All potato products
5.2.5.1. Exports of all potato products by province, value (CAN$)
| 2018/19 | 2019/20 | 2020/21 | 2021/22 | 2022/23 | 2022/23 % Share |
|
|---|---|---|---|---|---|---|
| Newfoundland and Labrador | 110,421 | 3,451 | 5,323 | 50,135 | 6,912 | 0.0% |
| Prince Edward Island | 382,186,232 | 489,883,283 | 498,035,935 | 562,277,014 | 855,107,803 | 25.4% |
| Nova Scotia | 1,676,884 | 1,057,442 | 2,280,207 | 3,261,367 | 1,293,478 | 0.0% |
| New Brunswick | 326,536,753 | 259,144,394 | 197,987,884 | 311,690,757 | 504,178,554 | 15.0% |
| Quebec | 32,231,164 | 55,753,820 | 57,392,283 | 90,368,660 | 121,177,284 | 3.6% |
| Ontario | 209,084,650 | 196,197,274 | 205,076,786 | 240,333,988 | 339,366,802 | 10.1% |
| Manitoba | 461,299,994 | 498,958,943 | 616,735,152 | 744,716,768 | 701,619,775 | 20.8% |
| Saskatchewan | 9,234,616 | 10,862,061 | 10,373,592 | 20,519,157 | 18,913,274 | 0.6% |
| Alberta | 446,457,613 | 404,537,301 | 454,026,032 | 545,827,377 | 790,999,070 | 23.5% |
| British Columbia | 10,733,771 | 14,149,930 | 30,156,580 | 35,915,891 | 36,146,480 | 1.1% |
| Canada | 1,879,552,098 | 1,930,547,899 | 2,072,069,774 | 2,554,961,114 | 3,368,809,432 | 100.0% |
| Source: Statistics Canada (CATSnet, September 2023) | ||||||
5.2.5.2. Destinations of overall potato exports, value (CAN$)
| 2018/19 | 2019/20 | 2020/21 | 2021/22 | 2022/23 | 2022/23 % Share |
|
|---|---|---|---|---|---|---|
| United States | 1,626,386,147 | 1,742,893,537 | 1,888,003,244 | 2,325,345,098 | 3,110,132,342 | 443.3% |
| Mexico | 58,780,824 | 34,340,576 | 29,491,110 | 46,631,839 | 49,412,962 | 7.0% |
| Japan | 30,084,752 | 21,564,509 | 50,398,487 | 45,371,012 | 41,778,042 | 6.0% |
| Taiwan | 15,067,116 | 14,954,938 | 17,068,736 | 19,050,395 | 18,722,056 | 2.7% |
| Panama | 2,794,247 | 6,437,773 | 12,674,944 | 14,411,610 | 18,647,493 | 2.7% |
| Others | 146,439,012 | 110,356,566 | 74,433,253 | 104,151,160 | 130,116,537 | 18.5% |
| Total | 1,879,552,098 | 1,930,547,899 | 2,072,069,774 | 2,554,961,114 | 3,368,809,432 | 480.1% |
| Source: Statistics Canada (CATSnet, September 2023) | ||||||
5.3. Canadian potato imports
5.3.1. Fresh potatoes
5.3.1.1. Fresh potato imports by province, value (CAN$)
| 2018/19 | 2019/20 | 2020/21 | 2021/22 | 2022/23 | 2022/23 % Share |
|
|---|---|---|---|---|---|---|
| Newfoundland and Labrador | 0 | 0 | 0 | 0 | 0 | 0.0% |
| Prince Edward Island | 0 | 0 | 0 | 0 | 0 | 0.0% |
| Nova Scotia | 8,180,696 | 0 | 0 | 0 | 0 | 0.0% |
| New Brunswick | 10,654,876 | 6,705,085 | 8,523,177 | 4,187,497 | 3,519,469 | 2.9% |
| Quebec | 1,494,210 | 1,432,384 | 391,016 | 317,975 | 854,626 | 0.7% |
| Ontario | 35,509,865 | 37,594,995 | 30,952,730 | 25,042,440 | 30,894,058 | 25.4% |
| Manitoba | 7,149,596 | 5,286,371 | 23,983,888 | 20,680,035 | 26,503,357 | 21.8% |
| Saskatchewan | 755,249 | 556,118 | 1,012,809 | 1,799,373 | 626,554 | 0.5% |
| Alberta | 16,097,235 | 10,376,043 | 8,193,073 | 3,738,995 | 4,138,536 | 3.4% |
| British Columbia | 50,273,837 | 51,796,018 | 44,456,935 | 43,429,227 | 55,296,958 | 45.4% |
| Canada | 130,115,564 | 113,747,014 | 117,513,628 | 99,195,542 | 121,833,558 | 100.0% |
| Note: Does not include seed potatoes. Source: Statistics Canada (CATSnet, September 2023) |
||||||
5.3.1.2. Fresh potato imports by province, quantity (metric tons)
| 2018/19 | 2019/20 | 2020/21 | 2021/22 | 2022/23 | 2022/23 % Share |
|
|---|---|---|---|---|---|---|
| Newfoundland and Labrador | 0 | 0 | 0 | 0 | 0 | 0.0% |
| Prince Edward Island | 0 | 0 | 0 | 0 | 0 | 0.0% |
| Nova Scotia | 4,126 | 0 | 0 | 0 | 0 | 0.0% |
| New Brunswick | 29,018 | 14,603 | 20,499 | 8,261 | 10,844 | 4.5% |
| Quebec | 2,750 | 3,657 | 713 | 257 | 1,462 | 0.6% |
| Ontario | 48,006 | 49,746 | 39,406 | 22,071 | 43,065 | 17.8% |
| Manitoba | 22,019 | 15,098 | 74,570 | 60,504 | 68,563 | 28.3% |
| Saskatchewan | 2,205 | 668 | 1,742 | 5,335 | 551 | 0.2% |
| Alberta | 37,155 | 24,763 | 19,633 | 4,424 | 4,704 | 1.9% |
| British Columbia | 63,222 | 57,752 | 54,628 | 54,118 | 112,837 | 46.6% |
| Canada | 208,501 | 166,287 | 211,191 | 154,970 | 242,026 | 100.0% |
| Note: Does not include seed potatoes. Source: Statistics Canada (CATSnet, September 2023) |
||||||
5.3.1.3. Fresh potato imports by country of origin, value (CAN$)
| 2018/19 | 2019/20 | 2020/21 | 2021/22 | 2022/23 | 2022/23 % Share |
|
|---|---|---|---|---|---|---|
| United States | 129,869,702 | 113,636,921 | 117,447,317 | 98,999,752 | 121,451,025 | 99.7% |
| Others | 245,862 | 110,093 | 66,311 | 195,790 | 382,533 | 0.1% |
| Total | 130,115,564 | 113,747,014 | 117,513,628 | 99,195,542 | 121,833,558 | 100.0% |
| Note: Does not include seed potatoes. Source: Statistics Canada (CATSnet, September 2023) |
||||||
5.3.1.4. Fresh potato imports by country of origin, quantity (metric tons)
| 2018/19 | 2019/20 | 2020/21 | 2021/22 | 2022/23 | 2022/23 % Share |
|
|---|---|---|---|---|---|---|
| United States | 208,185 | 166,149 | 211,129 | 154,781 | 241,704 | 99.9% |
| Others | 316 | 138 | 62 | 189 | 322 | 0.1% |
| Total | 208,501 | 166,287 | 211,191 | 154,970 | 242,026 | 100.0% |
| Note: Does not include seed potatoes. Source: Statistics Canada (CATSnet, September 2023) |
||||||
5.3.2. Seed potatoes
5.3.2.1. Seed potato imports by province, value (CAN$)
| 2018/19 | 2019/20 | 2020/21 | 2021/22 | 2022/23 | 2022/23 % Share |
|
|---|---|---|---|---|---|---|
| Newfoundland and Labrador | 0 | 0 | 0 | 0 | 0 | 0.0% |
| Prince Edward Island | 0 | 0 | 0 | 0 | 0 | 0.0% |
| Nova Scotia | 0 | 0 | 0 | 0 | 0 | 0.0% |
| New Brunswick | 2,734,378 | 2,948,307 | 2,420,508 | 5,425,235 | 6,512,820 | 50.9% |
| Quebec | 176,972 | 136,631 | 135,843 | 203,423 | 161,835 | 1.3% |
| Ontario | 2,300,252 | 2,851,112 | 3,814,181 | 2,850,260 | 2,088,726 | 16.3% |
| Manitoba | 1,874,286 | 1,014,011 | 2,323,945 | 2,401,925 | 2,117,519 | 16.5% |
| Saskatchewan | 404,783 | 311,342 | 366,388 | 181,923 | 712,895 | 5.6% |
| Alberta | 1,233,830 | 1,513,958 | 1,214,542 | 714,661 | 351,357 | 2.7% |
| British Columbia | 377,972 | 368,034 | 627,886 | 645,847 | 855,909 | 6.7% |
| Canada | 9,102,473 | 9,143,410 | 10,903,293 | 12,423,274 | 12,801,061 | 100.0% |
| Source: Statistics Canada (CATSnet, September 2023) | ||||||
5.3.2.2. Seed potato imports by province, quantity (metric tons)
| 2018/19 | 2019/20 | 2020/21 | 2021/22 | 2022/23 | 2022/23 % Share |
|
|---|---|---|---|---|---|---|
| Newfoundland and Labrador | 0 | 0 | 0 | 0 | 0 | 0.0% |
| Prince Edward Island | 0 | 0 | 0 | 0 | 0 | 0.0% |
| Nova Scotia | 0 | 0 | 0 | 0 | 0 | 0.0% |
| New Brunswick | 7,213 | 7,050 | 8,495 | 14,774 | 15,333 | 55.2% |
| Quebec | 353 | 180 | 262 | 480 | 374 | 1.3% |
| Ontario | 5,489 | 7,773 | 11,083 | 8,213 | 5,464 | 19.7% |
| Manitoba | 3,527 | 1,754 | 5,810 | 5,287 | 3,788 | 13.6% |
| Saskatchewan | 143 | 225 | 622 | 451 | 878 | 3.2% |
| Alberta | 2,304 | 3,373 | 2,634 | 1,700 | 646 | 2.3% |
| British Columbia | 672 | 510 | 1,007 | 1,219 | 1,309 | 4.7% |
| Canada | 19,701 | 20,865 | 29,913 | 32,124 | 27,792 | 100.0% |
| Source: Statistics Canada (CATSnet, September 2023) | ||||||
5.3.2.3. Seed potato imports by country of origin, value (CAN$)
| 2018/19 | 2019/20 | 2020/21 | 2021/22 | 2022/23 | 2022/23 % Share |
|
|---|---|---|---|---|---|---|
| United States | 9,102,473 | 9,143,265 | 10,891,746 | 12,423,274 | 12,800,945 | 100.0% |
| Others | 0 | 145 | 11,547 | 0 | 116 | 0.0% |
| Total | 9,102,473 | 9,143,410 | 10,903,293 | 12,423,274 | 12,801,061 | 100.0% |
| Source: Statistics Canada (CATSnet, September 2023) | ||||||
5.3.2.4. Seed potato imports by country of origin, quantity (metric tons)
| 2018/19 | 2019/20 | 2020/21 | 2021/22 | 2022/23 | 2022/23 % Share |
|
|---|---|---|---|---|---|---|
| United States | 19,701 | 20,865 | 29,889 | 32,124 | 27,792 | 100.0% |
| Others | 0 | 0 | 24 | 0 | 0 | 0.0% |
| Total | 19,701 | 20,865 | 29,913 | 32,124 | 27,792 | 100.0% |
| Source: Statistics Canada (CATSnet, September 2023) | ||||||
5.3.3. Frozen potatoes
5.3.3.1. Frozen potato imports by province, value (CAN$)
| 2018/19 | 2019/20 | 2020/21 | 2021/22 | 2022/23 | 2022/23 % Share |
|
|---|---|---|---|---|---|---|
| Newfoundland and Labrador | 0 | 0 | 0 | 0 | 0 | 0.0% |
| Prince Edward Island | 0 | 0 | 0 | 0 | 0 | 0.0% |
| Nova Scotia | 0 | 630 | 476 | 38,752 | 557 | 0.0% |
| New Brunswick | 15,910,374 | 13,436,691 | 9,338,957 | 13,143,281 | 13,214,872 | 11.8% |
| Quebec | 4,490,108 | 5,462,866 | 5,304,027 | 6,564,230 | 9,290,923 | 8.3% |
| Ontario | 33,458,406 | 38,180,033 | 35,822,229 | 44,403,706 | 41,610,733 | 37.1% |
| Manitoba | 10,221,173 | 12,210,804 | 7,994,840 | 10,712,269 | 9,095,444 | 8.1% |
| Saskatchewan | 1,540,807 | 2,440,529 | 1,015,687 | 4,601,886 | 1,080,031 | 1.0% |
| Alberta | 9,563,035 | 8,970,275 | 7,765,807 | 7,881,516 | 10,103,041 | 9.0% |
| British Columbia | 28,713,772 | 22,467,314 | 18,575,595 | 22,017,717 | 27,829,414 | 24.8% |
| Canada | 103,897,675 | 103,169,142 | 85,817,618 | 109,363,357 | 112,225,015 | 100.0% |
| Source: Statistics Canada (CATSnet, September 2023) | ||||||
5.3.3.2. Frozen potato imports by province, quantity (kilograms)
| 2018/19 | 2019/20 | 2020/21 | 2021/22 | 2022/23 | 2022/23 % Share |
|
|---|---|---|---|---|---|---|
| Newfoundland and Labrador | 0 | 0 | 0 | 0 | 0 | 0.0% |
| Prince Edward Island | 0 | 0 | 0 | 0 | 0 | 0.0% |
| Nova Scotia | 0 | 385 | 519 | 23,732 | 303 | 0.0% |
| New Brunswick | 17,141,157 | 15,745,990 | 12,005,797 | 16,115,140 | 11,535,703 | 21.9% |
| Quebec | 2,652,982 | 2,800,843 | 3,339,922 | 3,535,791 | 4,126,709 | 7.8% |
| Ontario | 13,335,816 | 17,044,800 | 17,983,749 | 21,170,156 | 18,179,148 | 34.5% |
| Manitoba | 5,795,941 | 6,875,950 | 4,261,303 | 5,868,600 | 4,302,864 | 8.2% |
| Saskatchewan | 1,102,756 | 1,590,691 | 536,389 | 1,545,050 | 540,457 | 1.0% |
| Alberta | 3,952,706 | 4,460,670 | 4,527,920 | 4,376,597 | 4,383,506 | 8.3% |
| British Columbia | 11,204,320 | 9,014,407 | 7,079,009 | 8,410,253 | 9,665,327 | 18.3% |
| Canada | 55,185,678 | 57,533,736 | 49,734,608 | 61,045,319 | 52,734,017 | 100.0% |
| Source: Statistics Canada (CATSnet, September 2023) | ||||||
5.3.3.3. Frozen potato imports by country of origin, value (CAN$)
| 2018/19 | 2019/20 | 2020/21 | 2021/22 | 2022/23 | 2022/23 % Share |
|
|---|---|---|---|---|---|---|
| United States | 93,873,078 | 89,768,366 | 73,356,040 | 95,656,568 | 93,283,229 | 83.1% |
| Belgium | 4,421,025 | 7,056,520 | 7,160,751 | 7,966,732 | 12,264,751 | 10.9% |
| France | 1,105,571 | 1,404,681 | 1,344,964 | 1,959,399 | 2,304,207 | 2.1% |
| Netherlands | 51,819 | 110,165 | 464,559 | 632,794 | 1,366,471 | 1.2% |
| Poland | 80,752 | 70,978 | 66,521 | 78,520 | 270,038 | 0.2% |
| Others | 4,365,430 | 4,758,432 | 3,424,783 | 3,069,344 | 2,736,319 | 2.4% |
| Total | 103,897,675 | 103,169,142 | 85,817,618 | 109,363,357 | 112,225,015 | 100.0% |
| Source: Statistics Canada (CATSnet, September 2023) | ||||||
5.3.3.4. Frozen potato imports by country of origin, quantity (kilograms)
| 2018/19 | 2019/20 | 2020/21 | 2021/22 | 2022/23 | 2022/23 % Share |
|
|---|---|---|---|---|---|---|
| United States | 47,943,274 | 48,310,082 | 40,134,715 | 51,883,994 | 43,660,390 | 82.8% |
| Belgium | 3,675,330 | 5,246,615 | 6,540,102 | 6,413,232 | 6,545,108 | 12.4% |
| France | 379,632 | 350,012 | 308,645 | 466,821 | 438,732 | 0.8% |
| Netherlands | 41,130 | 22,589 | 428,658 | 492,659 | 741,631 | 1.4% |
| Poland | 50,932 | 45,700 | 40,158 | 41,212 | 80,481 | 0.2% |
| Others | 3,095,380 | 3,558,738 | 2,282,330 | 1,747,401 | 1,267,675 | 2.4% |
| Total | 55,185,678 | 57,533,736 | 49,734,608 | 61,045,319 | 52,734,017 | 100.0% |
| Source: Statistics Canada (CATSnet, September 2023) | ||||||
5.3.4. Other processed potatoes
5.3.4.1. Other processed potatoNote 1 imports by province, value (CAN$)
| 2018/19 | 2019/20 | 2020/21 | 2021/22 | 2022/23 | 2022/23 % Share |
|
|---|---|---|---|---|---|---|
| Newfoundland and Labrador | 3,685 | 1,008 | 91 | 0 | 0 | 0.0% |
| Prince Edward Island | 0 | 0 | 0 | 0 | 0 | 0.0% |
| Nova Scotia | 25,545 | 138,775 | 4,258,634 | 193,347 | 643,560 | 0.2% |
| New Brunswick | 1,296,493 | 1,230,353 | 990,173 | 1,732,607 | 1,254,145 | 0.4% |
| Quebec | 5,581,932 | 4,952,893 | 5,589,580 | 6,348,736 | 6,914,940 | 2.5% |
| Ontario | 126,247,691 | 128,396,740 | 128,557,000 | 140,801,974 | 176,940,811 | 63.0% |
| Manitoba | 6,125,741 | 4,437,034 | 5,605,668 | 11,053,703 | 12,160,713 | 4.3% |
| Saskatchewan | 880,976 | 1,279,028 | 561,684 | 663,561 | 650,418 | 0.2% |
| Alberta | 10,810,972 | 11,365,485 | 10,085,769 | 9,671,453 | 11,708,189 | 4.2% |
| British Columbia | 53,592,937 | 55,375,837 | 61,960,773 | 60,247,123 | 70,667,065 | 25.2% |
| Canada | 204,565,972 | 207,177,153 | 217,609,372 | 230,712,504 | 280,939,841 | 100.0% |
|
||||||
5.3.4.2. Other processed potatoNote 1 imports by province, quantity (kilograms)
| 2018/19 | 2019/20 | 2020/21 | 2021/22 | 2022/23 | 2022/23 % Share |
|
|---|---|---|---|---|---|---|
| Newfoundland and Labrador | 159 | 57 | 6 | 0 | 0 | 0.0% |
| Prince Edward Island | 0 | 0 | 0 | 0 | 0 | 0.0% |
| Nova Scotia | 902 | 67,835 | 2,633,529 | 106,004 | 63,668 | 0.1% |
| New Brunswick | 756,355 | 700,834 | 592,713 | 926,831 | 515,413 | 0.7% |
| Quebec | 2,134,552 | 2,521,197 | 2,621,657 | 2,841,904 | 2,657,684 | 3.7% |
| Ontario | 40,533,546 | 40,989,046 | 39,829,210 | 40,059,814 | 41,369,727 | 58.1% |
| Manitoba | 1,455,649 | 1,861,268 | 1,404,827 | 3,585,324 | 5,126,673 | 7.2% |
| Saskatchewan | 219,725 | 323,825 | 118,636 | 145,018 | 196,343 | 0.3% |
| Alberta | 2,216,822 | 2,398,353 | 1,721,229 | 1,736,777 | 1,847,218 | 2.6% |
| British Columbia | 16,926,378 | 16,451,722 | 19,418,348 | 18,370,129 | 19,412,997 | 27.3% |
| Canada | 64,244,088 | 65,314,137 | 68,340,155 | 67,771,801 | 71,189,723 | 100.0% |
|
||||||
5.3.4.3. Other processed potatoNote 1 imports by country of origin, value (CAN$)
| 2018/19 | 2019/20 | 2020/21 | 2021/22 | 2022/23 | 2022/23 % Share |
|
|---|---|---|---|---|---|---|
| United States | 179,302,082 | 178,639,959 | 181,952,701 | 198,627,141 | 233,882,524 | 83.3% |
| Mexico | 7,726,684 | 6,689,495 | 6,452,285 | 6,503,700 | 11,222,090 | 4.0% |
| Denmark | 3,909,310 | 4,737,352 | 4,163,655 | 5,468,416 | 7,075,661 | 2.5% |
| Netherlands | 2,518,848 | 3,307,061 | 2,541,373 | 2,861,389 | 6,300,141 | 2.2% |
| Germany | 3,012,806 | 3,713,683 | 4,733,322 | 3,867,212 | 5,869,585 | 2.1% |
| Others | 8,096,242 | 10,089,603 | 17,766,036 | 13,384,646 | 16,589,840 | 5.9% |
| Total | 204,565,972 | 207,177,153 | 217,609,372 | 230,712,504 | 280,939,841 | 100.0% |
|
||||||
5.3.4.4. Other processed potatoNote 1 imports by country of origin, quantity (kilograms)
| 2018/19 | 2019/20 | 2020/21 | 2021/22 | 2022/23 | 2022/23 % Share |
|
|---|---|---|---|---|---|---|
| United States | 54,863,420 | 53,006,105 | 52,850,049 | 54,202,083 | 55,429,395 | 77.9% |
| Mexico | 1,058,768 | 1,483,489 | 1,417,740 | 1,255,420 | 1,548,439 | 2.2% |
| Denmark | 2,664,640 | 3,709,346 | 3,412,001 | 3,887,404 | 4,064,213 | 5.7% |
| Netherlands | 1,667,452 | 2,101,373 | 1,790,688 | 1,782,630 | 3,377,766 | 4.7% |
| Germany | 1,781,460 | 2,192,939 | 3,107,497 | 2,580,594 | 2,928,875 | 4.1% |
| Others | 2,208,348 | 2,820,885 | 5,762,180 | 4,063,670 | 3,841,035 | 5.4% |
| Total | 64,244,088 | 65,314,137 | 68,340,155 | 67,771,801 | 71,189,723 | 100.0% |
|
||||||
5.3.5. All potato products
5.3.5.1. Imports of all potato products by province, value (CAN$)
| 2018/19 | 2019/20 | 2020/21 | 2021/22 | 2022/23 | 2022/23 % Share |
|
|---|---|---|---|---|---|---|
| Newfoundland and Labrador | 3,685 | 1,008 | 91 | 0 | 0 | 0.0% |
| Prince Edward Island | 0 | 15 | 0 | 0 | 0 | 0.0% |
| Nova Scotia | 8,206,241 | 139,405 | 4,259,110 | 232,099 | 644,117 | 0.1% |
| New Brunswick | 30,596,121 | 24,320,436 | 21,272,815 | 24,488,620 | 24,501,306 | 4.6% |
| Quebec | 11,743,222 | 11,984,774 | 11,420,466 | 13,434,364 | 17,222,324 | 3.3% |
| Ontario | 197,516,214 | 207,022,880 | 199,146,140 | 213,098,380 | 251,534,328 | 47.7% |
| Manitoba | 25,370,796 | 22,948,220 | 39,908,341 | 44,847,932 | 49,877,033 | 9.4% |
| Saskatchewan | 3,581,815 | 4,587,017 | 2,956,568 | 7,246,743 | 3,069,898 | 0.6% |
| Alberta | 37,705,072 | 32,225,761 | 27,259,191 | 22,006,625 | 26,301,123 | 5.0% |
| British Columbia | 132,958,518 | 130,007,203 | 125,621,189 | 126,339,914 | 154,649,346 | 29.3% |
| Canada | 447,681,684 | 433,236,719 | 431,843,911 | 451,694,677 | 527,799,475 | 100.0% |
| Source: Statistics Canada (CATSnet, September 2023) | ||||||
5.3.5.2. Imports of all potato products by country of origin, value (CAN$)
| 2018/19 | 2019/20 | 2020/21 | 2021/22 | 2022/23 | 2022/23 % Share |
|
|---|---|---|---|---|---|---|
| United States | 412,147,335 | 391,188,511 | 383,647,804 | 405,706,735 | 461,417,723 | 87.4% |
| Belgium | 4,659,902 | 7,517,011 | 7,942,335 | 8,693,401 | 12,902,442 | 2.4% |
| Mexico | 7,726,684 | 6,689,514 | 6,453,545 | 6,506,245 | 11,222,286 | 2.1% |
| Netherlands | 2,570,984 | 3,417,540 | 3,007,519 | 3,494,183 | 7,666,612 | 1.5% |
| Denmark | 3,909,310 | 4,737,369 | 4,163,655 | 5,468,416 | 7,075,661 | 1.3% |
| Others | 16,667,469 | 19,686,774 | 26,629,053 | 21,825,697 | 27,514,751 | 5.2% |
| Total | 447,681,684 | 433,236,719 | 431,843,911 | 451,694,677 | 527,799,475 | 100.0% |
| Source: Statistics Canada (CATSnet, September 2023) | ||||||
6. World data
6.1. World production
6.1.1. World potato productionNote 1,Note 2 (thousands metric tons)
| 2017 | 2018 | 2019 | 2020 | 2021 | 2021 % Share |
|
|---|---|---|---|---|---|---|
| China | 88,482 | 90,259 | 89,500 | 92,800 | 94,300 | 25.1% |
| India | 48,605 | 51,310 | 50,190 | 48,562 | 54,230 | 14.4% |
| Ukraine | 22,208 | 22,504 | 20,269 | 20,838 | 21,356 | 5.7% |
| United States | 20,453 | 20,422 | 19,251 | 19,052 | 18,582 | 4.9% |
| Russia | 21,708 | 22,395 | 22,075 | 19,607 | 18,296 | 4.9% |
| Germany | 11,720 | 8,921 | 10,602 | 11,715 | 11,312 | 3.0% |
| Bangladesh | 10,216 | 9,744 | 9,655 | 9,606 | 9,887 | 2.6% |
| France | 8,547 | 7,860 | 8,560 | 8,692 | 8,987 | 2.4% |
| Poland | 9,172 | 7,312 | 6,482 | 7,860 | 7,081 | 1.9% |
| Egypt | 4,841 | 4,960 | 5,201 | 6,786 | 6,903 | 1.8% |
| Netherlands | 7,392 | 6,025 | 6,961 | 7,020 | 6,676 | 1.8% |
| CanadaNote 3 | 5,419 | 5,205 | 5,364 | 5,287 | 6,372 | 1.7% |
| Pakistan | 3,853 | 4,592 | 4,869 | 4,553 | 5,873 | 1.6% |
| Peru | 4,776 | 5,134 | 5,389 | 5,515 | 5,661 | 1.5% |
| United Kingdom | 6,218 | 5,060 | 5,307 | 5,513 | 5,307 | 1.4% |
| Türkiye | 4,800 | 4,550 | 4,980 | 5,200 | 5,100 | 1.4% |
| Belarus | 6,415 | 5,864 | 6,105 | 5,231 | 4,808 | 1.3% |
| Algeria | 4,606 | 4,653 | 5,020 | 4,659 | 4,361 | 1.2% |
| Kazakhstan | 3,551 | 3,807 | 3,912 | 4,007 | 4,032 | 1.1% |
| Belgium | 4,417 | 3,045 | 4,028 | 3,929 | 3,871 | 1.0% |
| Brazil | 3,655 | 3,729 | 3,712 | 3,768 | 3,853 | 1.0% |
| Nepal | 2,691 | 3,088 | 3,113 | 3,132 | 3,325 | 0.9% |
| Uzbekistan | 2,794 | 2,912 | 3,090 | 3,144 | 3,286 | 0.9% |
| Argentina | 2,459 | 2,507 | 2,600 | 2,884 | 2,955 | 0.8% |
| Colombia | 3,707 | 3,019 | 3,124 | 2,625 | 2,621 | 0.7% |
| Other countries | 57,410 | 56,826 | 59,474 | 59,158 | 57,084 | 15.2% |
| World | 370,115 | 365,703 | 368,833 | 371,143 | 376,120 | 100.0% |
Source: Food and Agriculture Organization (FAO) of the United Nations | © FAO Statistics Division 2023 - 12 July 2023 |
||||||
6.1.2. A Comparison: United States production statistics
| 2018 | 2019 | 2020 | 2021 | 2022 | ||
|---|---|---|---|---|---|---|
| Seeded area (hectares) | 415,410 | 389,834 | 371,704 | 377,572 | 369,073 | |
| Harvested area (hectares) | 410,675 | 379,312 | 368,952 | 373,768 | 366,686 | |
| Average yield, measured in metric tons / hectare | 49.7 | 50.8 | 51.7 | 49.8 | 49.1 | |
| Production, measured in metric tons | 20,412,565 | 19,251,323 | 19,051,788 | 18,589,532 | 18,002,583 | |
| Amount utilizedNote 1, measured in metric tons | 19,254,725 | 18,116,617 | 17,987,978 | 17,529,623 | .. | |
| Average priceNote 2, measured in CAN$ / metric ton | 256.4 | 291.5 | 275.1 | 281.1 | .. | |
| Total value of salesNote 2, measured in CAN$ (x 1,000) | 4,935,497 | 5,234,130 | 4,901,429 | 4,889,894 | .. | |
.. : Not available for a specific reference period. Source: Statistics Canada. Table 32-10-0017-01 Area, production and farm value of potatoes, by harvest season, United States |
||||||
6.2. World trade
6.2.1. Top 20 importers of fresh potatoes worldwide (CAN$ ‘000)
| 2018 | 2019 | 2020 | 2021 | 2022 | 2022 % Share |
|
|---|---|---|---|---|---|---|
| Belgium | 620,657 | 875,359 | 682,439 | 709,473 | 878,919 | 17.1% |
| United States | 279,613 | 258,422 | 339,650 | 318,574 | 503,680 | 9.8% |
| Spain | 276,465 | 378,668 | 358,758 | 301,754 | 444,871 | 8.7% |
| Netherlands | 442,833 | 515,742 | 401,337 | 440,223 | 438,678 | 8.5% |
| Germany | 259,398 | 416,164 | 295,831 | 257,081 | 258,759 | 5.0% |
| Italy | 196,447 | 291,856 | 214,118 | 190,385 | 238,543 | 4.6% |
| Portugal | 122,256 | 131,155 | 102,363 | 94,065 | 146,738 | 2.9% |
| France | 120,240 | 177,793 | 104,892 | 112,748 | 145,752 | 2.8% |
| Malaysia | 94,005 | 103,634 | 115,296 | 102,157 | 129,008 | 2.5% |
| Greece | 79,866 | 128,061 | 79,166 | 74,062 | 111,077 | 2.2% |
| Mexico | 77,665 | 78,037 | 80,775 | 69,593 | 108,691 | 2.1% |
| Canada | 113,180 | 134,439 | 109,703 | 118,828 | 102,735 | 2.0% |
| Romania | 38,531 | 88,179 | 62,127 | 57,451 | 71,219 | 1.4% |
| Saudi Arabia | 13,327 | 25,741 | 2,581 | 22,279 | 68,558 | 1.3% |
| Poland | 50,291 | 131,113 | 72,309 | 44,723 | 63,840 | 1.2% |
| Czech Republic | 46,723 | 88,730 | 61,522 | 45,841 | 57,752 | 1.1% |
| Viet-Nam | 21,353 | 28,097 | 43,459 | 34,372 | 54,546 | 1.1% |
| Azerbaijan | 28,589 | 50,122 | 44,352 | 56,261 | 54,366 | 1.1% |
| Switzerland | 11,192 | 15,481 | 23,216 | 28,807 | 54,118 | 1.1% |
| Hong Kong | 35,682 | 32,834 | 19,021 | 18,849 | 52,948 | 1.0% |
| Others | 1,258,424 | 1,412,390 | 1,290,342 | 1,264,265 | 1,154,433 | 22.5% |
| Total | 4,186,737 | 5,362,017 | 4,503,257 | 4,361,791 | 5,139,231 | 100.0% |
| Note: Does not include seed potatoes. Source: Global Trade Tracker (September 2023) |
||||||
6.2.2. Top 20 exporters of fresh potatoes worldwide (CAN$ ‘000)
| 2018 | 2019 | 2020 | 2021 | 2022 | 2022 % Share |
|
|---|---|---|---|---|---|---|
| France | 702,923 | 930,503 | 780,441 | 699,016 | 969,883 | 16.9% |
| Netherlands | 336,919 | 563,815 | 407,202 | 449,073 | 573,948 | 10.0% |
| Germany | 437,611 | 520,851 | 429,538 | 411,632 | 538,256 | 9.4% |
| Canada | 287,821 | 267,425 | 348,899 | 329,650 | 517,174 | 9.0% |
| Egypt | 253,497 | 335,358 | 304,194 | 249,735 | 464,608 | 8.1% |
| United States | 293,833 | 320,399 | 305,919 | 324,281 | 368,766 | 6.4% |
| China | 338,886 | 525,152 | 387,013 | 264,655 | 327,532 | 5.7% |
| Iran | 198,697 | 638,183 | 648,705 | 950,603 | 298,037 | 5.2% |
| Pakistan | 159,313 | 154,709 | 92,597 | 143,227 | 277,724 | 4.8% |
| Belgium | 203,358 | 253,742 | 236,388 | 213,700 | 247,228 | 4.3% |
| Spain | 128,532 | 171,400 | 145,413 | 157,895 | 179,153 | 3.1% |
| India | 73,236 | 100,907 | 94,687 | 87,758 | 123,266 | 2.1% |
| United Kingdom | 96,018 | 134,459 | 81,558 | 93,308 | 115,583 | 2.0% |
| Israel | 81,467 | 67,955 | 92,297 | 99,921 | 93,242 | 1.6% |
| Cyprus | 66,892 | 70,810 | 55,194 | 61,815 | 57,912 | 1.0% |
| Italy | 59,499 | 97,938 | 68,198 | 55,438 | 56,531 | 1.0% |
| Azerbaijan | 38,344 | 36,005 | 46,774 | 48,855 | 45,057 | 0.8% |
| South Africa | 55,674 | 52,562 | 48,320 | 48,636 | 42,314 | 0.7% |
| Australia | 30,417 | 29,235 | 29,900 | 31,888 | 32,278 | 0.6% |
| Denmark | 45,476 | 41,202 | 38,215 | 30,771 | 28,310 | 0.5% |
| Others | 334,096 | 526,382 | 426,088 | 437,459 | 378,893 | 6.6% |
| Total | 4,222,509 | 5,838,992 | 5,067,540 | 5,189,316 | 5,735,695 | 100.0% |
| Note: Does not include seed potatoes. Source: Global Trade Tracker (September 2023) |
||||||
6.2.3. Top 20 importers of seed potatoes worldwide (CAN$ ‘000)
| 2018 | 2019 | 2020 | 2021 | 2022 | 2022 % Share |
|
|---|---|---|---|---|---|---|
| Egypt | 109,447 | 140,535 | 100,254 | 136,863 | 165,963 | 17.7% |
| Belgium | 98,813 | 119,316 | 125,156 | 119,299 | 102,673 | 10.9% |
| Spain | 54,198 | 65,055 | 59,999 | 46,865 | 57,825 | 6.2% |
| Italy | 48,325 | 61,144 | 61,987 | 49,535 | 55,889 | 6.0% |
| Morocco | 36,204 | 33,821 | 39,638 | 26,133 | 48,473 | 5.2% |
| Saudi Arabia | 27,522 | 35,883 | 31,045 | 24,382 | 36,774 | 3.9% |
| Germany | 55,780 | 63,414 | 47,138 | 35,726 | 35,828 | 3.8% |
| France | 23,371 | 33,189 | 31,860 | 35,398 | 35,649 | 3.8% |
| United States | 35,175 | 34,063 | 44,789 | 33,965 | 35,083 | 3.7% |
| Netherlands | 52,700 | 79,293 | 67,723 | 43,520 | 31,071 | 3.3% |
| Portugal | 33,148 | 36,477 | 30,222 | 27,920 | 25,965 | 2.8% |
| Israel | 20,197 | 20,943 | 28,495 | 21,512 | 24,868 | 2.6% |
| Azerbaijan | 21,442 | 18,530 | 21,761 | 13,870 | 17,802 | 1.9% |
| Pakistan | 5,345 | 5,969 | 14,743 | 14,659 | 15,731 | 1.7% |
| Türkiye | 18,481 | 16,761 | 21,830 | 15,030 | 15,027 | 1.6% |
| Greece | 19,671 | 22,693 | 18,351 | 14,223 | 14,980 | 1.6% |
| Canada | 5,359 | 8,522 | 9,764 | 10,907 | 12,510 | 1.3% |
| Austria | 11,469 | 10,810 | 15,473 | 11,436 | 12,145 | 1.3% |
| Cyprus | 8,352 | 8,631 | 6,655 | 11,006 | 11,919 | 1.3% |
| Brazil | 7,283 | 10,716 | 10,596 | 11,301 | 11,373 | 1.2% |
| Others | 267,936 | 212,767 | 236,651 | 188,823 | 171,115 | 18.2% |
| Total | 960,218 | 1,038,532 | 1,024,130 | 892,373 | 938,663 | 100.0% |
| Source: Global Trade Tracker (September 2023) | ||||||
6.2.4. Top 20 exporters of seed potatoes worldwide (CAN$ ‘000)
| 2018 | 2019 | 2020 | 2021 | 2022 | 2022 % Share |
|
|---|---|---|---|---|---|---|
| Netherlands | 704,310 | 777,233 | 699,337 | 602,450 | 728,710 | 56.7% |
| France | 137,276 | 162,203 | 156,717 | 144,909 | 159,619 | 12.4% |
| United Kingdom | 81,556 | 95,574 | 97,725 | 83,899 | 105,549 | 8.2% |
| Germany | 65,835 | 69,147 | 78,235 | 72,633 | 65,799 | 5.1% |
| Denmark | 45,340 | 50,811 | 35,094 | 41,482 | 49,353 | 3.8% |
| Canada | 37,767 | 36,159 | 48,096 | 37,144 | 39,180 | 3.1% |
| Belgium | 56,925 | 66,763 | 63,840 | 35,762 | 32,262 | 2.5% |
| United States | 12,048 | 17,179 | 20,670 | 21,692 | 27,414 | 2.1% |
| South Africa | 10,743 | 8,345 | 9,350 | 15,665 | 20,659 | 1.6% |
| Spain | 71,235 | 57,866 | 9,266 | 7,643 | 7,789 | 0.6% |
| Egypt | 12,445 | 8,639 | 7,784 | 6,623 | 6,246 | 0.5% |
| Kyrgyzstan | 50 | 87 | 2,627 | 1,063 | 5,916 | 0.5% |
| Portugal | 5,606 | 5,762 | 6,217 | 5,047 | 5,410 | 0.4% |
| Australia | 5,797 | 6,670 | 5,372 | 6,437 | 4,971 | 0.4% |
| Poland | 2,862 | 2,287 | 2,404 | 4,125 | 2,928 | 0.2% |
| Austria | 2,797 | 4,049 | 4,736 | 3,253 | 2,847 | 0.2% |
| Chile | 65 | 1,351 | 963 | 821 | 1,767 | 0.1% |
| Finland | 2,999 | 2,852 | 1,380 | 1,406 | 1,541 | 0.1% |
| Türkiye | 4,852 | 732 | 1,170 | 1,319 | 1,514 | 0.1% |
| Luxembourg | 3,849 | 4,326 | 5,020 | 3,097 | 1,479 | 0.1% |
| Others | 28,763 | 29,020 | 37,142 | 16,506 | 13,523 | 1.1% |
| Total | 1,293,120 | 1,407,055 | 1,293,145 | 1,112,976 | 1,284,476 | 100.0% |
| Source: Global Trade Tracker (September 2023) | ||||||
7. Key resources
- Agriculture and Agri-Food Canada, Infohort
- Canadian Food Inspection Agency, Potatoes Section
- Food and Agriculture Organization of the United Nations, Statistics Division
- Global Trade Tracker
- Statistics Canada. Table 32-10-0045-01
- Statistics Canada. Table 32-10-0054-01
- Statistics Canada. Table 32-10-0166-01
- Statistics Canada. Table 32-10-0358-01
- Statistics Canada. Table 32-10-0017-01
- Statistics Canada. CATSNET
- Statistics Canada. 2021 Census of Agriculture
Import and export data is based on the following Harmonized System Codes (H.S. Codes):
- Fresh Potato Export HS Codes: 07019000
- Seed Potato Export HS Codes: 07011000
- Frozen Potato Export HS Codes: 07101000, 20041000
- Processed Export HS Codes: 07121000, 11051000, 11052000, 11081300, 20052000
- Fresh Potato Import HS Codes: 0701900010, 0701900020
- Seed Potato Import HS Codes: 0701100000
- Frozen Potato Import HS Codes: 0710100000, 2004100000
- Processed Import HS Codes: 0712909010, 1105100000, 1105200000, 1108130010, 1108130020, 2005200010, 2005200020, 2005200090