
For your convenience, this report is available in the following format: PDF (455 KB)
Overview
Canada and the United States are the only countries who produce maple syrup at commercial scale. In 2024, the Canadian maple syrup industry accounted for approximately 73% of the total world maple syrup production, with 90.7% of Canadian production originating from Quebec, 6.1% from New Brunswick, 3.1% from Ontario, and 0.2% from Nova Scotia. The United States is the second-largest producer, accounting for approximately 23% of global production, with 53.0% of American production originating from Vermont, 14.4% from New York, and 12.0% from Maine. Maple products accounted for 6.7% of all Canadian horticulturenote 1 farm cash receiptsnote 2 in 2024.
Contrary to the general trend in agriculture where a decrease in the number of farms was observed in previous censuses following the long-term trend towards fewer and larger operations, the number of maple product farms increased by 19.2% from 2016 (5,340 farms) to 2021 (6,364 farms). This growth was most notable in Quebec, where in recent years, there has been an increasing trend in the number of producers participating in maple syrup production. This growth in the number of producers was driven by the 2017 addition of 5 million maple 'taps' by the Federation of Quebec Maple Syrup Producers (QMSP) who control the quantity of production in that province and maintain a strategic reserve of storable maple syrup to minimize fluctuations in pricing and availability of supply, which is driven by natural variability in annual production.
In 2024, Canadian maple producers harvested more than 119.5 million kilograms (19.9 million gallons) of maple syrup. Production was higher than 2023 across all four maple-producing provinces in 2024 which, as a whole, increased by more than 90% over the previous year, when unfavourable weather such as severe storms and unfavorable temperature fluctuations led to lower yields. The gross value of Canadian maple syrup reached $837.3 million in 2024, representing a near 49% increase since 2020.
Total production of maple syrup in Quebec reached 108.4 million kilograms (18.0 million gallons) in 2024, a 92.2% increase over 2023 due to increased yields and maple taps. Similarly, due to higher yields and growth, production in New Brunswick more than doubled over the previous year to reach 7.2 million kilograms (1.2 million gallons). Meanwhile, in Ontario, maple producers harvested 3.6 million kilograms (607,000 gallons) in 2024, with warmer weather in some areas contributing to an overall 20.9% production increase over 2023. Production in Nova Scotia reached 258,387 kilograms (43,000 gallons) in 2024.
Canadian maple syrup exports totaled 70.8 million kilograms (11.8 million gallons) in 2024, which increased by 8.7% over the 65.1 million kilograms (10.8 million gallons) exported in 2023. In terms of value, Canadian exports of maple products amounted to $715.9 million in 2024, up by 16.0% over 2023. Canadian maple products were exported to 71 different countries around the world in 2024; 64.9% of the exports were to the United States, 6.3% to Germany, 5.3% to the United Kingdom, 4.1% to Australia, 4.0% to France, and 3.7% to Japan, with other export destinations accounting for the remaining 11.7% of total export volumes.
1. Production
1.1. Number of maple farmsnote 1 by province
| 2011 | 2016 | 2021 | 2021 % Share | |
|---|---|---|---|---|
| Newfoundland and Labrador | 1 | 0 | 0 | 0.0% |
| Prince Edward Island | 2 | 1 | 2 | 0.0% |
| Nova Scotia | 36 | 48 | 39 | 0.6% |
| New Brunswick | 108 | 111 | 114 | 1.8% |
| Quebec | 4,674 | 4,776 | 5,812 | 91.3% |
| Ontario | 416 | 391 | 389 | 6.1% |
| Manitoba | 6 | 6 | 5 | 0.1% |
| Saskatchewan | 0 | 2 | 1 | 0.0% |
| Alberta | 0 | 0 | 0 | 0.0% |
| British Columbia | 5 | 5 | 2 | 0.0% |
| Canada | 5,248 | 5,340 | 6,364 | 100.0% |
Note:
Source: Statistics Canada. Table 32-10-0166-01 Farms classified by farm type, Census of Agriculture historical data | ||||
1.2. Number of maple taps by province
| 2011 | 2016 | 2021 | 2021 % Share | |
|---|---|---|---|---|
| Newfoundland and Labrador | x | 0 | 0 | 0.0% |
| Prince Edward Island | 9,693 | 9,760 | 10,299 | 0.0% |
| Nova Scotia | 372,452 | 446,300 | 420,383 | 0.8% |
| New Brunswick | 1,896,773 | 2,285,785 | 3,523,948 | 6.4% |
| Quebec | 40,632,512 | 42,529,033 | 48,672,648 | 89.1% |
| Ontario | 1,508,651 | 1,713,022 | 2,013,549 | 3.7% |
| Manitoba | 8,251 | 5,961 | 4,581 | 0.0% |
| Saskatchewan | 5,917 | 1,490 | 332 | 0.0% |
| Alberta | x | 0 | 0 | 0.0% |
| British Columbia | 3,609 | 4,009 | 1,851 | 0.0% |
| Canada | 44,440,024 | 46,995,360 | 54,647,591 | 100.0% |
Note: x: Suppressed to meet the confidentiality requirements of the Statistics Act. Source: Statistics Canada. Table 32-10-0161-01 Maple taps, Census of Agriculture historical data | ||||
1.3. Maple syrup productionnote 1 by province (kilograms)
| 2020 | 2021 | 2022 | 2023 | 2024 | 2024 % Share | |
|---|---|---|---|---|---|---|
| Nova Scotia | 336,504 | 216,324 | F | F | 258,387 | 0.2% |
| New Brunswick | 3,371,049 | 4,723,074 | 4,873,299 | 3,166,743 | 7,246,854 | 6.1% |
| Quebec | 79,438,980 | 60,252,243 | 95,843,550 | 56,400,474 | 108,408,369 | 90.7% |
| Ontario | 2,806,203 | 2,776,158 | 3,545,310 | 3,016,518 | 3,647,463 | 3.1% |
| Canada | 85,952,736 | 67,967,799 | 104,592,654 | 62,673,870 | 119,561,073 | 100.0% |
Notes:
F: Too unreliable to be published. Source: Statistics Canada. Table 32-10-0354-01 Production and value of maple products (x 1,000) | ||||||
1.4. Production of maple products – 15-year trend
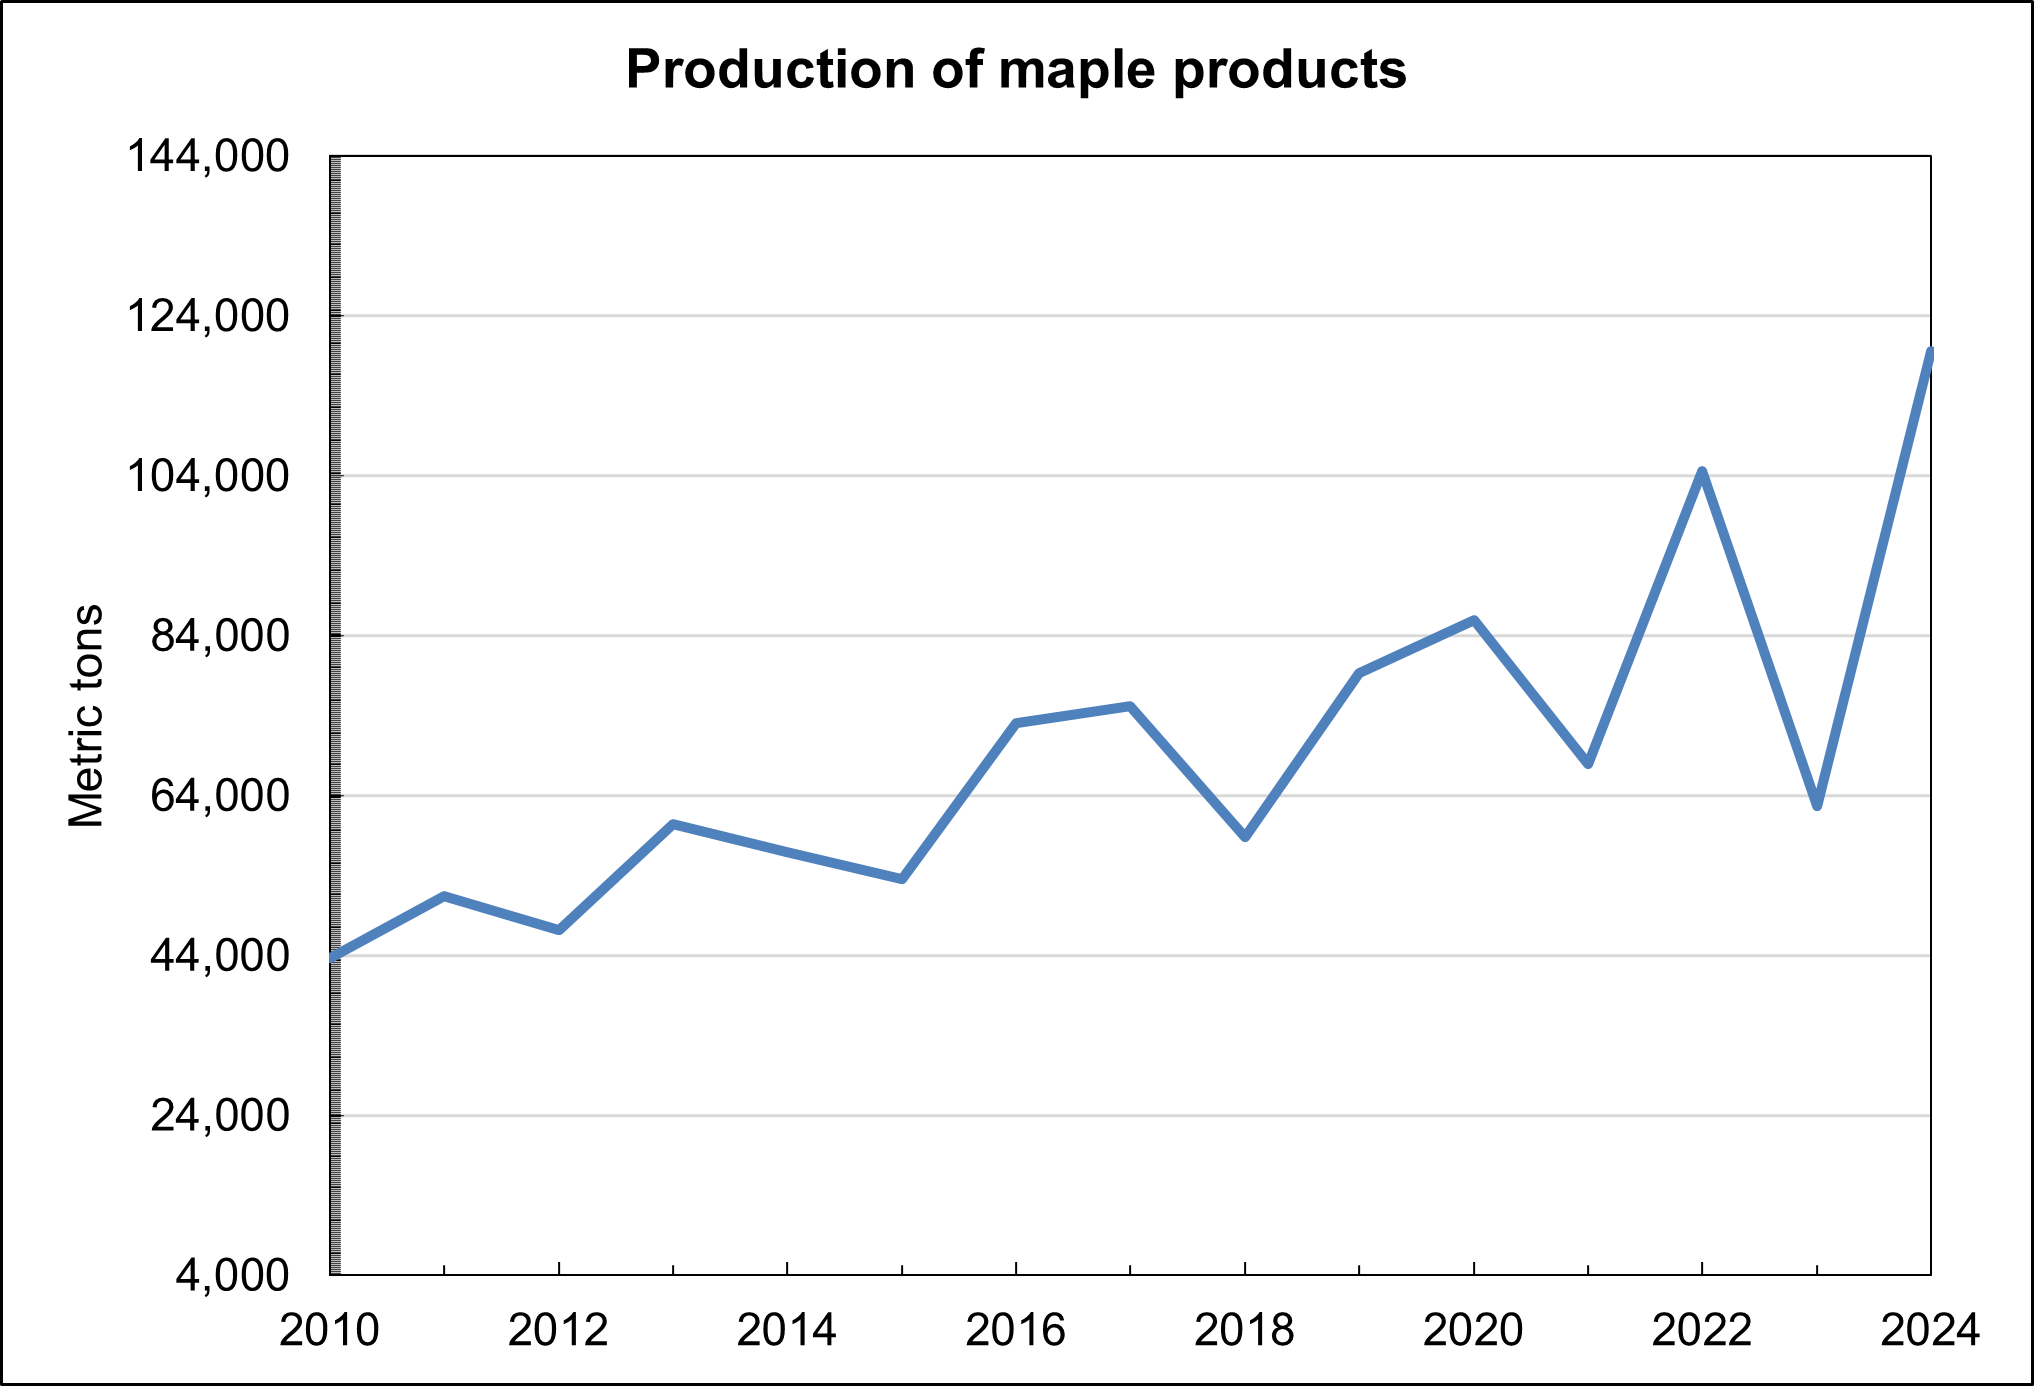
Source: Statistics Canada. Table 32-10-0354-01 Production and value of maple products (x 1,000)
Description of above image
1.4. Production of maple products – 15-year trend
| Year | Metric tons |
|---|---|
| 2010 | 43,709 |
| 2011 | 51,383 |
| 2012 | 47,201 |
| 2013 | 60,408 |
| 2014 | 56,989 |
| 2015 | 53,528 |
| 2016 | 73,069 |
| 2017 | 75,185 |
| 2018 | 58,864 |
| 2019 | 79,343 |
| 2020 | 85,953 |
| 2021 | 67,968 |
| 2022 | 104,593 |
| 2023 | 62,674 |
| 2024 | 119,561 |
1.5. Gross valuenote 1 of maple products by province (thousands of Canadian dollars)
| 2020 | 2021 | 2022 | 2023 | 2024 | 2024 % Share | |
|---|---|---|---|---|---|---|
| Nova Scotia | 2,850 | 1,953 | .. | .. | 2,255 | 0.3% |
| New Brunswick | 20,630 | 31,665 | 33,005 | 20,756 | 51,973 | 6.2% |
| Quebec | 513,150 | 393,186 | 636,000 | 393,400 | 750,000 | 89.6% |
| Ontario | 25,759 | 26,231 | 31,672 | 28,614 | 33,097 | 4.0% |
| Canada | 562,389 | 453,034 | .. | .. | 837,325 | 100.0% |
Notes:
..: not available for a specific reference period. Source: Statistics Canada. Table 32-10-0354-01 Production and value of maple products (x 1,000) | ||||||
2. Trade
2.1 Exports
2.1.1 Maple productsnote 1 exports by province – by value (thousands of Canadian dollars)
| 2020 | 2021 | 2022 | 2023 | 2024 | 2024 % Share | |
|---|---|---|---|---|---|---|
| Prince Edward Island | 7 | 171 | 0 | 0 | 61 | 0.0% |
| Nova Scotia | 196 | 383 | 326 | 584 | 315 | 0.0% |
| New Brunswick | 13,859 | 15,238 | 17,771 | 12,695 | 6,945 | 1.0% |
| Quebec | 496,827 | 569,490 | 594,401 | 599,474 | 704,823 | 98.5% |
| Ontario | 4,200 | 5,215 | 2,899 | 4,075 | 3,445 | 0.5% |
| Manitoba | 0 | 0 | 44 | 0 | 0 | 0.0% |
| Saskatchewan | 0 | 0 | 0 | 106 | 0 | 0.0% |
| Alberta | 0 | 1 | 0 | 0 | 0 | 0.0% |
| British Columbia | 355 | 462 | 586 | 165 | 262 | 0.0% |
| Canada | 515,445 | 590,960 | 616,026 | 617,100 | 715,851 | 100.0% |
Note:
Source: Statistics Canada (CATSNet, February 2025) | ||||||
2.1.2. Maple productsnote 1 exports by province – by volume (kilograms)
| 2020 | 2021 | 2022 | 2023 | 2024 | 2024 % Share | |
|---|---|---|---|---|---|---|
| Prince Edward Island | 808 | 20,377 | 0 | 0 | 4,836 | 0.0% |
| Nova Scotia | 31,119 | 45,293 | 28,242 | 59,731 | 29,516 | 0.0% |
| New Brunswick | 1,585,644 | 1,674,914 | 1,824,363 | 1,306,107 | 734,748 | 1.0% |
| Quebec | 59,000,218 | 70,658,798 | 67,327,543 | 63,217,371 | 69,601,633 | 98.3% |
| Ontario | 676,639 | 764,229 | 345,639 | 531,369 | 374,595 | 0.5% |
| Manitoba | 0 | 0 | 4,105 | 0 | 0 | 0.0% |
| Saskatchewan | 0 | 0 | 0 | 9,437 | 0 | 0.0% |
| Alberta | 7 | 112 | 0 | 0 | 0 | 0.0% |
| British Columbia | 32,508 | 41,328 | 60,647 | 15,168 | 29,480 | 0.0% |
| Canada | 61,326,943 | 73,205,051 | 69,590,539 | 65,139,183 | 70,774,808 | 100.0% |
Note:
Source: Statistics Canada (CATSNet, February 2025) | ||||||
2.1.3. Top maple products export destinations – by value (thousands of Canadian dollars)
| 2020 | 2021 | 2022 | 2023 | 2024 | 2024 % Share | |
|---|---|---|---|---|---|---|
| United States | 304,347 | 348,682 | 381,204 | 376,402 | 462,287 | 64.6% |
| Germany | 50,381 | 55,347 | 60,336 | 47,703 | 47,836 | 6.7% |
| United Kingdom | 30,753 | 34,163 | 30,628 | 30,219 | 36,930 | 5.2% |
| Australia | 26,870 | 23,736 | 26,115 | 27,421 | 30,349 | 4.2% |
| France | 22,438 | 27,947 | 30,656 | 32,575 | 28,255 | 3.9% |
| Japan | 24,788 | 33,486 | 27,713 | 25,881 | 26,453 | 3.7% |
| Denmark | 8,710 | 9,119 | 9,038 | 9,845 | 8,971 | 1.3% |
| South Korea | 7,746 | 9,752 | 9,779 | 6,696 | 8,237 | 1.2% |
| Netherlands | 5,221 | 6,592 | 5,197 | 6,448 | 7,910 | 1.1% |
| Slovenia | 0 | 0 | 0 | 14,593 | 7,421 | 1.0% |
| Others | 34,191 | 42,134 | 35,361 | 39,318 | 51,202 | 7.2% |
| Total | 515,445 | 590,960 | 616,026 | 617,100 | 715,851 | 100.0% |
| Source: Statistics Canada (CATSNet, February 2025) | ||||||
2.1.4. Top maple products export destinations – by volume (kilograms)
| 2020 | 2021 | 2022 | 2023 | 2024 | 2024 % Share | |
|---|---|---|---|---|---|---|
| United States | 36,971,390 | 44,487,456 | 44,553,308 | 40,325,614 | 45,923,328 | 64.9% |
| Germany | 5,489,090 | 6,339,164 | 6,424,852 | 4,755,689 | 4,478,952 | 6.3% |
| United Kingdom | 3,597,468 | 3,910,476 | 3,586,007 | 3,413,747 | 3,752,889 | 5.3% |
| Australia | 3,046,168 | 2,683,484 | 2,752,890 | 2,690,210 | 2,892,463 | 4.1% |
| France | 2,975,166 | 4,326,908 | 3,127,415 | 3,522,348 | 2,832,336 | 4.0% |
| Japan | 2,724,174 | 3,563,452 | 2,772,370 | 2,525,566 | 2,588,274 | 3.7% |
| Denmark | 1,248,573 | 1,288,604 | 1,280,691 | 1,333,635 | 1,142,387 | 1.6% |
| Netherlands | 564,763 | 776,455 | 576,573 | 735,554 | 900,051 | 1.3% |
| South Korea | 829,675 | 1,043,526 | 1,038,807 | 645,653 | 767,411 | 1.1% |
| Slovenia | 0 | 0 | 0 | 1,484,306 | 725,747 | 1.0% |
| Others | 3,880,476 | 4,785,526 | 3,477,626 | 3,706,861 | 4,770,970 | 6.7% |
| Total | 61,326,943 | 73,205,051 | 69,590,539 | 65,139,183 | 70,774,808 | 100.0% |
| Source: Statistics Canada (CATSNet, February 2025) | ||||||
3. Availability for consumption
3.1. Maple products availablenote 1 for consumptionEndnote 2 (kilograms per person)
| 2019 | 2020 | 2021 | 2022 | 2023 | |
|---|---|---|---|---|---|
| Maple Sugar | 0.39 | 0.52 | 0.47 | 0.67 | 0.44 |
Notes:
Source: Statistics Canada. Table 32-10-0054-01 Food available in Canada | |||||
4. World data
4.1. World imports
4.1.1. Top importers of maple sugar and maple syrup – by value (thousands of Canadian dollars)
| 2020 | 2021 | 2022 | 2023 | 2024 | 2024 % Share | |
|---|---|---|---|---|---|---|
| United States | 304,500 | 348,758 | 381,240 | 376,461 | 462,563 | 55.1% |
| Germany | 44,019 | 50,590 | 42,171 | 47,656 | 47,726 | 5.7% |
| United Kingdom | 37,021 | 38,645 | 37,529 | 39,282 | 44,247 | 5.3% |
| Japan | 28,825 | 37,013 | 35,266 | 30,778 | 33,857 | 4.0% |
| France | 26,608 | 31,182 | 38,088 | 34,242 | 33,543 | 4.0% |
| Australia | 27,291 | 25,708 | 28,349 | 30,149 | 32,169 | 3.8% |
| Netherlands | 22,114 | 25,482 | 63,425 | 51,797 | 30,121 | 3.6% |
| Canadanote 1 | 15,495 | 11,011 | 16,940 | 17,215 | 26,150 | 3.1% |
| Italy | 10,112 | 13,663 | 10,273 | 12,579 | 11,246 | 1.3% |
| Denmark | 10,421 | 11,323 | 11,606 | 11,344 | 10,351 | 1.2% |
| Switzerland | 7,494 | 7,434 | 7,858 | 8,248 | 8,827 | 1.1% |
| South Korea | 9,139 | 11,913 | 11,293 | 8,745 | 8,453 | 1.0% |
| Poland | 7,258 | 8,218 | 8,225 | 7,377 | 7,634 | 0.9% |
| Sweden | 4,238 | 5,678 | 5,254 | 7,207 | 6,637 | 0.8% |
| Ireland | 6,115 | 5,921 | 6,444 | 6,357 | 5,909 | 0.7% |
| Others | 61,880 | 70,810 | 66,979 | 71,358 | 69,544 | 8.3% |
| Total | 622,530 | 703,349 | 770,940 | 760,795 | 838,977 | 100.0% |
Note:
Source: Global Trade Tracker (February 2025) | ||||||
4.1.2. Top importers of maple sugar and maple syrup – by volume (metric tons)
| 2020 | 2021 | 2022 | 2023 | 2024 | 2024 % Share | |
|---|---|---|---|---|---|---|
| United States | 36,990 | 44,503 | 44,555 | 40,343 | 45,984 | 53.8% |
| United Kingdom | 4,667 | 4,705 | 4,301 | 4,271 | 4,481 | 5.2% |
| Canadanote 1 | 2,624 | 1,895 | 2,908 | 2,712 | 4,470 | 5.2% |
| Germany | 4,538 | 5,417 | 4,249 | 4,404 | 4,248 | 5.0% |
| Australia | 2,826 | 2,840 | 2,832 | 2,744 | 3,112 | 3.6% |
| France | 2,608 | 3,123 | 3,703 | 3,239 | 2,887 | 3.4% |
| Netherlands | 2,288 | 2,566 | 9,143 | 4,816 | 2,863 | 3.3% |
| Japan | 2,577 | 3,333 | 3,023 | 2,498 | 2,643 | 3.1% |
| Italy | 1,619 | 2,482 | 1,087 | 1,438 | 1,286 | 1.5% |
| Denmark | 1,406 | 1,529 | 1,471 | 1,386 | 1,239 | 1.4% |
| Sweden | 996 | 1,310 | 1,299 | 1,347 | 1,209 | 1.4% |
| Ireland | 1,042 | 658 | 652 | 597 | 902 | 1.1% |
| Spain | 765 | 1,422 | 1,299 | 1,062 | 852 | 1.0% |
| New Zealand | 658 | 682 | 806 | 649 | 733 | 0.9% |
| South Korea | 846 | 1,100 | 1,037 | 730 | 686 | 0.8% |
| Others | 9,228 | 9,624 | 10,900 | 8,007 | 7,940 | 9.3% |
| Reporter's Total | 75,678 | 87,189 | 93,265 | 80,243 | 85,535 | 100.0% |
Note:
Source: Global Trade Tracker (February 2025) | ||||||
4.2. A Comparison: United States national statistics for maple syrup
4.2.1. United States maple syrup production by state (gallons)
| 2020 | 2021 | 2022 | 2023 | 2024 | 2024 % Share | |
|---|---|---|---|---|---|---|
| Vermont | 2,894,000 | 2,227,000 | 3,264,000 | 2,608,000 | 3,108,000 | 53.0% |
| New York | 804,000 | 647,000 | 844,000 | 750,000 | 846,000 | 14.4% |
| Maine | 703,000 | 553,000 | 681,000 | 470,000 | 701,000 | 12.0% |
| Wisconsin | 407,000 | 490,000 | 611,000 | 457,000 | 458,000 | 7.8% |
| Michigan | 190,000 | 165,000 | 215,000 | 205,000 | 200,000 | 3.4% |
| Pennsylvania | 230,000 | 215,000 | 201,000 | 205,000 | 182,000 | 3.1% |
| New Hampshire | 175,000 | 132,000 | 172,000 | 148,000 | 149,000 | 2.5% |
| Ohio | .. | .. | .. | .. | 96,000 | 1.6% |
| Massachusetts | .. | .. | .. | .. | 49,000 | 0.8% |
| Minnesota | .. | .. | .. | .. | 26,000 | 0.4% |
| Indiana | .. | .. | .. | .. | 22,000 | 0.4% |
| West Virginia | .. | .. | .. | .. | 12,000 | 0.2% |
| Connecticut | .. | .. | .. | .. | 11,000 | 0.2% |
| United States | 5,403,000 | 4,429,000 | 5,988,000 | 4,843,000 | 5,860,000 | 100.0% |
Note: ..: not available for a specific reference period. Source: USDA, National Agricultural Statistics Service | ||||||
4.2.2. United States maple syrup production value by state (thousands of US dollars)
| 2019 | 2020 | 2021 | 2022 | 2023 | 2023 % Share | |
|---|---|---|---|---|---|---|
| Vermont | 74,788 | 78,138 | 71,264 | 108,038 | 79,022 | 49.8% |
| New York | 26,404 | 27,658 | 24,457 | 31,650 | 26,550 | 16.7% |
| Maine | 18,048 | 24,535 | 21,346 | 23,767 | 14,805 | 9.3% |
| Wisconsin | 14,300 | 11,844 | 16,219 | 19,185 | 14,487 | 9.1% |
| Michigan | 10,157 | 9,234 | 7,640 | 7,977 | 8,774 | 5.5% |
| Pennsylvania | 7,035 | 8,832 | 7,783 | 7,015 | 7,585 | 4.8% |
| New Hampshire | 7,792 | 9,118 | 8,567 | 8,978 | 7,444 | 4.7% |
| United States | 158,524 | 169,359 | 157,276 | 206,610 | 158,667 | 100.0% |
Note: 2024 maple syrup production value data was not available at the time of writing. Source: USDA, National Agricultural Statistics Service | ||||||
5. Key Resources
- Global Trade Tracker
- Statistics Canada. Table 32-10-0166-01 Farms classified by farm type, Census of Agriculture historical data
- Statistics Canada. Table 32-10-0161-01 Maple taps, Census of Agriculture historical data
- Statistics Canada. Table 32-10-0354-01 Production and value of maple products
- Statistics Canada. Table 32-10-0054-01 Food available in Canada
- Statistics Canada. CATSNET
- USDA. National Agricultural Statistics Service
Import and export data is based on the following Harmonized System Codes (H.S. Codes):
- Maple for import: 1702200010, 1702200020
- Maple for export: 17022010, 17022020, 17022021, 17022029