
This section provides statistics about the types of dairy barns in Canada.
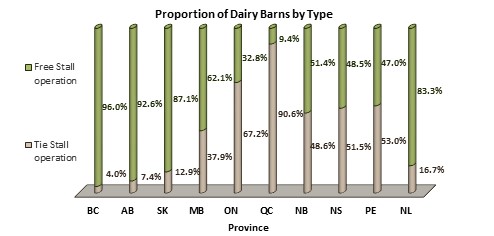
Non-robotic milking
Non-robotic milking
| Province | # barns Tie Stall |
% Tie Stall |
Herd Size Tie Stall |
# barns Free Stall |
% Free Stall |
Herd Size Free Stall |
# barns Unrecorded |
Herd Size Unrecorded |
Total Number of barns | |
|---|---|---|---|---|---|---|---|---|---|---|
| British Columbia | 6 | 5.0 | 31.2 | 115 | 95.0 | 212.5 | - | - | 121 | |
| Alberta | 7 | 3.5 | 96.7 | 194 | 96.5 | 174.4 | - | - | 201 | |
| Saskatchewan | 6 | 11.5 | 113.5 | 46 | 88.5 | 236.3 | 1 | 467 | 53 | |
| Manitoba | 28 | 41.2 | 86.6 | 40 | 58.8 | 286.8 | - | - | 68 | |
| Ontario | 1,103 | 66.6 | 61.6 | 553 | 33.4 | 137.1 | 3 | 104 | 1,659 | |
| Quebec | 2,375 | 88.8 | 70.6 | 300 | 11.2 | 153.1 | 72 | 71 | 2,747 | |
| New Brunswick | 41 | 51.9 | 65.5 | 38 | 48.1 | 176.1 | 3 | - | 82 | |
| Nova Scotia | 41 | 47.7 | 63.5 | 45 | 52.3 | 148.3 | 4 | - | 90 | |
| Prince Edward Island | 33 | 48.5 | 68.5 | 35 | 51.5 | 112.9 | 1 | 71 | 69 | |
| Newfoundland and Labrador | 0 | - | 0 | 6 | 100.0 | 212.2 | - | - | 6 | |
| Canada | 3,640 | 72.6 | - | 1,372 | 27.4 | - | 84 | - | 5,096 | |
Table 1 Notes
|
||||||||||

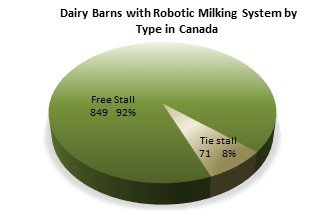
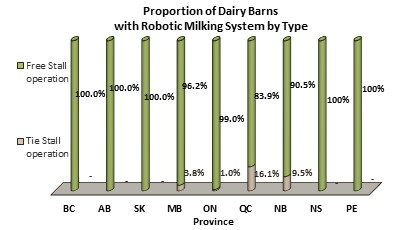
Robotic milking
Robotic milking
| Province | # of barns Tie Stall |
% Tie Stall |
Herd Size Tie Stall |
# of barns Free Stall |
% Free Stall |
Herd Size Free Stall |
# barns Unrecorded |
Herd Size Unrecorded |
Total Number of barns |
|
|---|---|---|---|---|---|---|---|---|---|---|
| British Columbia | - | - | - | 54 | 100.0 | 168 | 1 | 75 | 55 | |
| Alberta | - | - | - | 83 | 100.0 | 160 | - | - | 83 | |
| Saskatchewan | - | - | - | 22 | 100.0 | 147 | - | - | 22 | |
| Manitoba | 1 | 1.8 | 52 | 56 | 98.2 | 200 | - | - | 57 | |
| Ontario | 3 | 0.8 | 117 | 362 | 99.2 | 114 | 2 | 93 | 367 | |
| Quebec | 59 | 12.2 | 89 | 425 | 87.8 | 115 | 1 | - | 485 | |
| New Brunswick | - | - | - | 31 | 100.0 | 96 | - | - | 31 | |
| Nova Scotia | 1 | - | 159 | 21 | 95.5 | 118 | - | - | 22 | |
| Prince Edward Island | 1 | 8.3 | 146 | 11 | 91.7 | 115 | - | - | 12 | |
| Newfoundland and Labrador | - | - | - | 3 | 100.0 | 114 | - | - | 3 | |
| Canada | 65 | 5.7 | - | 1,068 | 94.3 | - | 4 | - | 1,137 | |
Table 2 Notes
|
||||||||||
Source: Lactanet
Compiled by Agriculture and Agri-Food Canada, Animal industry division, Market information section
For your convenience, this report is available in the following formats:
PDF (471 KB), XLS (85 KB)
If you have any questions or require additional information, please send an email to aafc.cdic-ccil.aac@agr.gc.ca