

Note: This report includes forecasting data that is based on baseline historical data.
Executive summary
Baked goods in the European Union (EU) saw modest retail sales growth at a compound annual growth rate (CAGR) of 1.8% between 2016 and 2021, recording total retail sales of US$98.6 billion in 2021. Over 2021-2026, sales are expected to grow by a CAGR of 2.9%, led by higher sales in Netherlands, Italy, and Poland. Baked goods' sales are led by Italy, Germany, and France which collectively accounted for 58.7% of total EU baked goods sales in 2021.
Accotding to Euromonitor, compared to other staple foods, sales of baked goods have been largely unaffected by pandemic lockdowns in the EU.
As the pandemic prioritised health and wellness, baked goods with a healthier positioning are expected to grow over 2021-26. As premium prices for these products can be a major barrier for consumers, major European retailers are launching private label health and wellness baked goods, in addition to stocking more branded organic offerings, to help make these baked goods more affordable.
Market overview
Baked goods in the EU saw modest retail sales growth at a compound annual growth rate (CAGR) of 1.8% between 2016 and 2021, recording total retail sales of US$98.6 billion in 2021. Over 2021-2026, sales are expected to grow by a CAGR of 2.9%, led by higher sales in Netherlands, Italy, and Poland. Baked goods' sales are led by Italy, Germany, and France which collectively accounted for 58.7% of total EU baked goods sales in 2021.
Accotding to Euromonitor, compared to other staple foods, sales of baked goods have been largely unaffected by pandemic lockdowns in the EU. Packaged flat bread is growing in popularity, partly because packaged bread is seen as more hygienic with a longer storage life than unpackaged varieties. Flat bread popularity is also driven by interest in regional EU gastronomic traditions, such as piadina in Italy and tortillas in Spain, as well as foreign cuisine, such as burritos from Mexico. As flat breads can be used as a wrap, demand is expected to continue growing as employees return to the office.
As the pandemic prioritised health and wellness, baked goods with a healthier positioning are expected to grow over 2021 to 2026. Higher quality ingredients are expected to be in demand, such as organic, as well as enriched breads that offer extra health benefits and cakes and pastries that incorporate healthier ingredients. As premium prices for these products can be a major barrier for consumers, major European retailers like Carrefour, Aldi, Rewe, Alcampo, and Lidl are launching private label baked goods, in addition to stocking more branded offerings, to help make these baked goods more affordable.
| Country | 2016 | 2021 | CAGR % 2016-2021 | 2022 | 2026 | CAGR % 2021-2026 |
|---|---|---|---|---|---|---|
| European Union Total | 90,089.5 | 98,579.7 | 1.8 | 100,747.9 | 113,545.7 | 2.9 |
| Italy | 19,493.4 | 21,149.7 | 1.6 | 22,041.3 | 26,268.0 | 4.4 |
| Germany | 17,219.1 | 18,587.9 | 1.5 | 18,488.5 | 19,740.7 | 1.2 |
| France | 16,858.2 | 18,102.1 | 1.4 | 18,522.7 | 20,471.1 | 2.5 |
| Spain | 5,704.1 | 5,437.5 | −1.0 | 5,555.0 | 5,979.9 | 1.9 |
| Poland | 3,702.5 | 4,419.3 | 3.6 | 4,582.9 | 5,417.3 | 4.2 |
| Netherlands | 3,345.8 | 3,681.6 | 1.9 | 3,780.1 | 4,590.1 | 4.5 |
| Austria | 3,255.7 | 3,612.4 | 2.1 | 3,670.0 | 3,923.7 | 1.7 |
| Romania | 2,477.4 | 3,215.4 | 5.4 | 3,304.9 | 3,576.3 | 2.2 |
| Belgium | 3,067.7 | 3,172.4 | 0.7 | 3,233.0 | 3,567.1 | 2.4 |
| Sweden | 1,921.2 | 2,272.6 | 3.4 | 2,298.2 | 2,745.5 | 3.9 |
|
Source: Euromonitor International, 2022 *CAGR: Compound annual growth rate Historic data: 2016 to 2021 Forecast data: 2022 to 2026 |
||||||
Italy
Market overview
Italy was the largest EU baked goods market in 2021 with sales growing at a CAGR of 1.6% over 2016-21, reaching total retail sales of US$21.1 billion. Sales are expected to do better over 2021 to 2026 at a CAGR of 4.4%, valued at US$26.3 billion by 2026.
Packaged flat bread has remained one of the strongest performers in baked goods in Italy in 2021. This category has become more appealing to many Italians since the beginning of the pandemic, partly because packaged bread in general is seen as more hygienic than unpackaged varieties.
Pandemic-related hygiene concerns and the increasing preference for longer-lasting bread have also continued to support growth in sales of packaged leavened bread in 2021, with sandwich and soft varieties remaining the most popular.
While the pandemic has driven healthier eating, Italian consumers have also shown a greater desire for indulgence while spending more time at home. In terms of baked goods, the influence of these seemingly divergent trends has been most evident in the growing demand for packaged cakes and packaged pastries combining rich, luxurious flavours with natural and highly nutritious ingredients that provide functional health benefits.
| Category | 2016 | 2017 | 2018 | 2019 | 2020 | 2021 |
|---|---|---|---|---|---|---|
| Baked goods total | 19,493.3 | 19,781.7 | 20,181.3 | 20,589.1 | 20,666.1 | 21,149.8 |
| Bread | 12,402.0 | 12,544.2 | 12,771.3 | 13,012.6 | 13,009.6 | 13,262.1 |
| Cakes | 4,269.3 | 4,352.9 | 4,438.2 | 4,503.1 | 4,535.1 | 4,688.2 |
| Pastries | 2,729.3 | 2,791.2 | 2,876.2 | 2,976.1 | 3,017.8 | 3,093.0 |
| Frozen Baked Goods | 38.0 | 39.0 | 41.7 | 44.6 | 47.7 | 50.1 |
| Dessert Mixes | 54.7 | 54.4 | 53.9 | 52.7 | 55.9 | 56.4 |
| Source: Euromonitor International, 2022 | ||||||
| Category | Annual growth % 2020-2021 | CAGR* % 2016-2021 | Total growth % 2016-2021 |
|---|---|---|---|
| Baked goods total | 2.3 | 1.6 | 8.5 |
| Bread | 1.9 | 1.4 | 6.9 |
| Cakes | 3.3 | 1.9 | 9.8 |
| Pastries | 2.4 | 2.5 | 13.3 |
| Frozen Baked Goods | 4.8 | 5.7 | 31.8 |
| Dessert Mixes | 0.9 | 0.6 | 3.1 |
|
Source: Euromonitor International, 2022 *CAGR: Compound annual growth rate |
|||
| Category | 2022 | 2023 | 2024 | 2025 | 2026 |
|---|---|---|---|---|---|
| Baked goods total | 22,041.3 | 23,049.1 | 24,104.9 | 25,201.9 | 26,267.9 |
| Bread | 13,747.2 | 14,309.4 | 14,886.3 | 15,477.6 | 16,027.1 |
| Cakes | 4,948.3 | 5,243.3 | 5,565.2 | 5,908.5 | 6,264.8 |
| Pastries | 3,235.8 | 3,382.4 | 3,535.9 | 3,694.4 | 3,851.3 |
| Frozen Baked Goods | 53.0 | 56.2 | 59.4 | 62.7 | 65.7 |
| Dessert Mixes | 57.0 | 57.8 | 58.1 | 58.7 | 59.0 |
| Source: Euromonitor International, 2022 | |||||
| Category | Annual growth % 2021-2022 | CAGR* % 2021-2026 | Annual growth % 2021-2026 |
|---|---|---|---|
| Baked goods total | 4.1 | 4.4 | 24.2 |
| Bread | 3.4 | 3.9 | 20.8 |
| Cakes | 5.7 | 6.0 | 33.6 |
| Pastries | 4.1 | 4.5 | 24.5 |
| Frozen Baked Goods | 4.6 | 5.6 | 31.1 |
| Dessert Mixes | 0.5 | 0.9 | 4.6 |
|
Source: Euromonitor International, 2022 *CAGR: Compound annual growth rate |
|||
| Company | Retail sales (US$ millions) | Market share (%) |
|---|---|---|
| Others | 17,662.7 | 83.5 |
| Barilla Holding SpA | 909.0 | 4.3 |
| Bauli SpA | 813.4 | 3.8 |
| Private Label | 693.9 | 3.3 |
| Ferrero & related parties | 461.6 | 2.2 |
| Dr Schär AG/SpA | 123.6 | 0.6 |
| Valeo Foods Ltd | 94.4 | 0.4 |
| Source: Euromonitor International, 2022 | ||
New product launches
From 2017 to 2021, 5,648 baked goods products were introduced in Italy. The most popular product claim was "palm oil free". Other popular claims were "no additivies/preservatives" and "low/no/reduced allergen". The companies with the highest number of new product launches were Lidl, Barilla, and Eurospin.
| Product attributes | Number of new product by year | Total | ||||
|---|---|---|---|---|---|---|
| 2017 | 2018 | 2019 | 2020 | 2021 | ||
| Yearly product launches | 1,251 | 1,180 | 1,143 | 1,131 | 943 | 5,648 |
| Top 5 claims | ||||||
| Palm Oil Free | 290 | 329 | 319 | 263 | 211 | 1,412 |
| Not Specified | 293 | 257 | 264 | 250 | 219 | 1,283 |
| No Additives/Preservatives | 199 | 210 | 226 | 225 | 131 | 991 |
| Low/No/Reduced Allergen | 210 | 209 | 171 | 179 | 162 | 931 |
| Social Media | 167 | 149 | 195 | 214 | 137 | 862 |
| Top 5 companies | ||||||
| Lidl | 59 | 62 | 69 | 28 | 26 | 244 |
| Barilla/Barilla G. e R. Fratelli | 58 | 60 | 53 | 38 | 33 | 242 |
| Eurospin | 18 | 31 | 15 | 20 | 16 | 100 |
| Conad | 23 | 14 | 19 | 22 | 16 | 94 |
| Galbusera | 5 | 27 | 19 | 21 | 16 | 88 |
| Top 5 Flavours (including blend) | ||||||
| Unflavoured/Plain | 482 | 478 | 475 | 489 | 388 | 2,312 |
| Chocolate | 81 | 81 | 97 | 80 | 66 | 405 |
| Cocoa/Cacao | 43 | 46 | 41 | 45 | 31 | 206 |
| Chocolate (Dark/Black) | 23 | 30 | 22 | 27 | 16 | 118 |
| Hazelnut | 32 | 19 | 14 | 22 | 16 | 103 |
| Top 5 ingredients | ||||||
| Salt (Food) | 909 | 891 | 898 | 855 | 693 | 4,246 |
| Wheat Flour (Food) | 784 | 723 | 721 | 650 | 494 | 3,372 |
| White Sugar (Food) | 733 | 707 | 705 | 636 | 489 | 3,270 |
| Emulsifiers | 561 | 565 | 547 | 499 | 383 | 2,555 |
| Raising Agents | 560 | 528 | 526 | 440 | 366 | 2,420 |
| Top 5 package types | ||||||
| Flexible | 1,121 | 1,045 | 1,037 | 1,003 | 813 | 5,019 |
| Clam-pack | 25 | 21 | 28 | 21 | 23 | 118 |
| Carton | 24 | 28 | 21 | 24 | 18 | 115 |
| Tray | 16 | 16 | 23 | 27 | 20 | 102 |
| Flexible stand-up pouch | 12 | 8 | 13 | 13 | 25 | 71 |
| Launch types | ||||||
| New Variety/Range Extension | 476 | 441 | 475 | 461 | 340 | 2,193 |
| New Product | 385 | 307 | 248 | 311 | 324 | 1,575 |
| New Packaging | 212 | 270 | 272 | 235 | 208 | 1,197 |
| Relaunch | 151 | 145 | 134 | 115 | 64 | 609 |
| New Formulation | 27 | 17 | 14 | 9 | 7 | 74 |
| Source: Mintel GNPD, 2022 | ||||||
Examples of new products
Classic Buckwheat Biscuits with Chocolate

| Company | Dileo Pietro |
|---|---|
| Manufacturer | Dileo Pietro |
| Brand | Il Forno dei Desideri |
| Category | Bakery |
| Sub-category | Sweet biscuits / cookies |
| Market | Italy |
| Store name | Sapori Vietresi |
| Store type | Traditional retail outlet |
| Price in US dollars | 2.02 |
These crunchy and golden biscuits have been made according to traditional recipes with quality ingredients and a slow manufacturing process and long baking time at the right temperature. The product is free from palm oil and retails in a 430 gram pack.
Crackers with Spelt, Buckwheat and Quinoa

| Company | Misura |
|---|---|
| Manufacturer | Misura |
| Brand | Misura Multigrain Cereali Antichi |
| Category | Bakery |
| Sub-category | Savoury biscuits / crackers |
| Market | Italy |
| Store name | Iperspar |
| Store type | Mass merchandise / hypermarket |
| Price in US dollars | 2.58 |
This product is described as a crunchy and light cracker with 50% less saturated fats compared to similar products on the market, comprises a mix of puffed spelt wheat, Cappelli durum wheat, buckwheat, quinoa and type 2 wheat flour. It is free from artificial flavours and palm oil, is rich in fibres, and retails in a 350 gram recyclable pack containing 10 portions with six units each and featuring the FSC Forest for All Forever, FSC Mix, Facebook, Instagram and WhatsApp logos. The manufacturer claims to use electrical energy from renewable sources to make this product, protect the nature, use correctly natural resources, and to participate in responsible disposal.
Organic Small Tarts with Blueberries

| Company | Il Mangiarsano |
|---|---|
| Manufacturer | Il Mangiarsano |
| Brand | Mangiar Sano |
| Category | Bakery |
| Sub-category | Cakes, pastries and sweet goods |
| Market | Italy |
| Store name | MD |
| Store type | Supermarket |
| Price in US dollars | 2.19 |
This organic product is made with whole spelt flour and cane sugar, and is free from palm oil. It retails in a 210 gram pack, containing six 35 gram units, and featuring the EU Organic logo.
Germany
Market overview
Changing German consumer behaviour as a result of the pandemic has led to highier sales of baked goods as many consumers working from home have been able to consume breakfast at home, increasing demand for bread in particular. An increasing number of Germans are purchasing bread from supermarkets. Bread sales increased by a CAGR of 1.0% over 2016-21, valued at US$12.1 billion in 2021 and forecast to grow 0.8% over 2021 to 2026 to US$12.7 billion in 2026.
The pandemic has also driven Increased popularity regional products, which is considered to have a lower carbon footprint and to be healthier. With many Germans also wanting to support local businesses, these products, often artisanal, tend to be more expensive than non-regional products.
Despite an easing of restrictions in Germany, many Germans have become accustomed to working from home, which has had an impact on most consumers' behaviour. The "snackification" trend, has been strengthened, is expected to drive sales of dessert mixes and packaged cakes. It is also likely that the number of family celebrations, social gatherings and other events will increase over time, from which cakes in particular could benefit. For these reasons, new, innovative products and new flavours for cakes and dessert mixes are expected to be introduced. Frozen baked goods saw fastest growth of all baked goods over 2016 to 2021 by a CAGR of 6.5% over 2016 to 2021, followed by dessert mixes (4.1%) pastries (2.5%) and cakes (1.9%). Growth in these products is epected to slow over 2021 to 2026.
| Category | 2016 | 2017 | 2018 | 2019 | 2020 | 2021 |
|---|---|---|---|---|---|---|
| Baked goods total | 17,219.1 | 17,470.7 | 17,526.8 | 17,712.1 | 18,091.1 | 18,588.0 |
| Bread | 11,547.0 | 11,669.4 | 11,644.4 | 11,701.2 | 11,876.0 | 12,153.6 |
| Cakes | 3,739.7 | 3,811.7 | 3,845.4 | 3,919.1 | 3,994.6 | 4,117.3 |
| Pastries | 1,266.7 | 1,290.1 | 1,311.2 | 1,346.4 | 1,380.6 | 1,435.2 |
| Frozen Baked Goods | 456.7 | 485.9 | 507.3 | 522.2 | 596.8 | 626.2 |
| Dessert Mixes | 209.0 | 213.6 | 218.5 | 223.2 | 243.1 | 255.7 |
| Source: Euromonitor International, 2022 | ||||||
| Category | Annual growth % 2020-2021 | CAGR* % 2016-2021 | Total growth % 2016-2021 |
|---|---|---|---|
| Baked goods total | 2.7 | 1.5 | 7.9 |
| Bread | 2.3 | 1.0 | 5.3 |
| Cakes | 3.0 | 1.9 | 10.1 |
| Dessert Mixes | 4.9 | 4.1 | 22.3 |
| Frozen Baked Goods | 4.7 | 6.5 | 37.1 |
| Pastries | 3.8 | 2.5 | 13.3 |
|
Source: Euromonitor International, 2022 *CAGR: Compound annual growth rate |
|||
| Category | 2022 | 2023 | 2024 | 2025 | 2026 |
|---|---|---|---|---|---|
| Baked goods total | 18,488.4 | 18,741.3 | 19,056.8 | 19,397.7 | 19,740.7 |
| Bread | 12,030.0 | 12,130.4 | 12,288.8 | 12,477.6 | 12,671.7 |
| Cakes | 4,144.5 | 4,238.0 | 4,328.0 | 4,416.1 | 4,500.5 |
| Dessert Mixes | 1,455.2 | 1,496.9 | 1,540.0 | 1,580.2 | 1,619.5 |
| Frozen Baked Goods | 611.3 | 627.3 | 647.3 | 666.8 | 687.3 |
| Pastries | 247.4 | 248.7 | 252.7 | 257.0 | 261.7 |
| Source: Euromonitor International, 2022 | |||||
| Category | Annual growth % 2021-2022 | CAGR* % 2021-2026 | Annual growth % 2021-2026 |
|---|---|---|---|
| Baked goods total | 1.7 | 1.2 | 6.2 |
| Bread | 1.5 | 0.8 | 4.3 |
| Cakes | 1.9 | 1.8 | 9.3 |
| Dessert Mixes | 2.4 | 2.4 | 12.8 |
| Frozen Baked Goods | 3.0 | 1.9 | 9.8 |
| Pastries | 1.8 | 0.5 | 2.3 |
|
Source: Euromonitor International, 2022 *CAGR: Compound annual growth rate |
|||
| Company | Retail sales (US$ millions) | Market share (%) |
|---|---|---|
| Artisanal | 11,453.7 | 55.8 |
| Private Label | 3,993.8 | 21.5 |
| Others | 977.3 | 5.8 |
| Harry-Brot GmbH | 970.6 | 5.3 |
| Agrofert as | 335.4 | 5.2 |
| Kuchenmeister GmbH | 311.9 | 1.8 |
| Oetker-Gruppe | 161.1 | 1.7 |
| Source: Euromonitor International, 2022 | ||
New product launches
From 2017 to 2021, 7,307 baked goods products were introduced in Germany, with the highest number of new products launched in 2019. The most popular product claim was organic, followed by sustainable and environmentally friendly package. The companies with the highest number of new product launches were ligle, followed by Aldi Sud, and Penny Markt.
| Product attributes | Number of new product by year | Total | ||||
|---|---|---|---|---|---|---|
| 2017 | 2018 | 2019 | 2020 | 2021 | ||
| Yearly product launches | 1,545 | 1,371 | 1,490 | 1,529 | 1,372 | 7,307 |
| Top 5 claims | ||||||
| Organic | 398 | 262 | 398 | 365 | 333 | 1,756 |
| Not Specified | 400 | 292 | 353 | 311 | 271 | 1,627 |
| Ethical - Sustainable (Habitat/Resources) | 323 | 303 | 287 | 295 | 298 | 1,506 |
| Ethical - Environmentally Friendly Product | 302 | 292 | 267 | 277 | 251 | 1,389 |
| Ethical - Human | 262 | 254 | 207 | 231 | 217 | 1,171 |
| Top 5 companies | ||||||
| Lidl | 134 | 73 | 68 | 100 | 86 | 461 |
| Aldi Süd | 75 | 59 | 86 | 125 | 92 | 437 |
| Penny Markt | 83 | 53 | 38 | 54 | 87 | 315 |
| Aldi Nord | 62 | 65 | 57 | 14 | 17 | 215 |
| Bahlsen | 23 | 27 | 29 | 24 | 39 | 142 |
| Top 5 flavours (including blend) | ||||||
| Unflavoured/Plain | 415 | 337 | 354 | 404 | 351 | 1,861 |
| Chocolate | 95 | 98 | 114 | 113 | 96 | 516 |
| Cocoa/Cacao | 45 | 33 | 45 | 47 | 28 | 198 |
| Butter | 37 | 27 | 34 | 32 | 41 | 171 |
| Chocolate (Milk) | 34 | 36 | 43 | 25 | 26 | 164 |
| Top 5 ingredients | ||||||
| Wheat Flour (Food) | 1,029 | 983 | 993 | 988 | 931 | 4,924 |
| Salt (Food) | 992 | 957 | 962 | 986 | 859 | 4,756 |
| White Sugar (Food) | 867 | 847 | 829 | 836 | 829 | 4,208 |
| Emulsifiers | 763 | 739 | 718 | 720 | 652 | 3,592 |
| Raising Agents | 690 | 660 | 677 | 729 | 632 | 3,388 |
| Top 5 package types | ||||||
| Flexible | 1,247 | 1,100 | 1,205 | 1,182 | 1,099 | 5,833 |
| Carton | 75 | 76 | 57 | 67 | 56 | 331 |
| Flexible stand-up pouch | 37 | 36 | 43 | 36 | 45 | 197 |
| Not Specified | 40 | 14 | 26 | 79 | 16 | 175 |
| Tray | 19 | 26 | 37 | 31 | 25 | 138 |
| Launch types | ||||||
| New Variety/Range Extension | 793 | 516 | 610 | 658 | 524 | 3,101 |
| New Product | 364 | 419 | 451 | 421 | 293 | 1,948 |
| New Packaging | 280 | 331 | 346 | 333 | 477 | 1,767 |
| Relaunch | 96 | 92 | 76 | 96 | 70 | 430 |
| New Formulation | 12 | 13 | 7 | 21 | 8 | 61 |
| Source: Mintel GNPD, 2022 | ||||||
Examples of new products
Lentil Crispbread

| Company | Gutena Nahrungsmittel |
|---|---|
| Manufacturer | Gutena Nahrungsmittel |
| Brand | Filinchen |
| Category | Bakery |
| Sub-category | Savoury biscuits / crackers |
| Market | Germany |
| Store name | Kaufland |
| Store type | Mass merchandise / hypermarket |
| Price in US dollars | 1.80 |
This crispy product from sustainable and local farming is made from legumes, is free from grains, gluten, palm fat, soy, and lactose, is low in sugar and is suitable for vegans. It retails in a 100 gram pack containing 2 packets with nine units in each.
Spiced Spelt Biscuits

| Company | Bohlsener Mühle |
|---|---|
| Manufacturer | Bohlsener Mühle |
| Brand | Bohlsener Mühle |
| Category | Bakery |
| Sub-category | Sweet biscuits / cookies |
| Market | Germany |
| Store name | Alnatura |
| Store type | Natural / health food store |
| Price in US dollars | 3.94 |
The product is free from palm oil and retails in a 170 gram pack featuring Bioland and EU Organic logos.
Fantastic Pumpkin Crackers

| Company | Dr. Klaus Karg |
|---|---|
| Manufacturer | Dr. Klaus Karg |
| Brand | Dr. Karg's Genuss mit Biss Super Saaten |
| Category | Bakery |
| Sub-category | Savoury biscuits / crackers |
| Market | Germany |
| Store name | EDEKA neukauf |
| Store type | Supermarket |
| Price in US dollars | 2.36 |
The super crispy organic product is made with plant-based, natural ingredients, including 97% grainy oat flakes and seeds, such as an extra serving of pumpkin seeds, flax seeds and nutty sesame, as well as wholegrain oat flour, sea salt and sunflower oil. It is a source of omega 3 fatty acids, suitable for vegans, free from gluten and additives, and retails in a recyclable 85 gram pack bearing the EU Organic and BIO logos.
France
Market overview
Bread is still widely purchased on a daily basis across France, with the majority of bread purchased from local bakeries which are increasingly offering loaves made with grains, alternative flours and organic ingredients. Consumers perceive artisanal bread to be of good quality and naturally healthy due to the quality of flour used in its baking. Another driver for purchasing bread from artisanal bakeries is consumers' desire to preserve the French bakery tradition.
Mass produced bread is perceived as less healthy but despite consumers' preference for fresh artisanal bread, packaged bread has seen very strong growth during the pandemic, in particular, packaged flat bread, which has seen developments in the use of alternative grains. Bread sales increased by a CAGR of 2.0% over 2016-21, valued at US$9.6 billion in 2021 and forecaste to grow 2.7% over 2021 to 2026 to US$11.3 billion in 2026.
As pandemic restrictions have eased, opportunities for celebrations involving cakes and pastries have become easier as larger gatherings are permitted, leading to growth in sales of these products. Dessert mixes have been in decline and despite healthier ingredients and new recipes, consumers have been opting for either home-made or shop bought desserts. Much of the diminishing popularity of this category stems from its unhealthy image as more consumers are endeavouring to reduce their sugar intake. Cakes are expected to grow fastest of all baked goods by a CAGR of 3.3% over 2021 to 2026, followed by bread (2.7%) and pastries (1.0%).
| Category | 2016 | 2017 | 2018 | 2019 | 2020 | 2021 |
|---|---|---|---|---|---|---|
| Baked goods total | 16,858.2 | 17,086.1 | 17,378.8 | 17,737.0 | 17,778.8 | 18,102.1 |
| Bread | 8,946.4 | 9,067.0 | 9,204.2 | 9,391.2 | 9,649.4 | 9,873.2 |
| Cakes | 4,328.3 | 4,384.0 | 4,481.1 | 4,599.9 | 4,461.1 | 4,561.8 |
| Pastries | 3,347.1 | 3,410.7 | 3,479.4 | 3,541.4 | 3,465.9 | 3,468.4 |
| Frozen Baked Goods | 110.0 | 107.7 | 105.1 | 102.2 | 102.4 | 101.3 |
| Dessert Mixes | 126.4 | 116.7 | 109.0 | 102.3 | 100.0 | 97.4 |
| Source: Euromonitor International, 2022 | ||||||
| Category | Annual growth % 2020-2021 | CAGR* % 2016-2021 | Total growth % 2016-2021 |
|---|---|---|---|
| Baked goods total | 1.8 | 1.4 | 7.4 |
| Bread | 2.3 | 2.0 | 10.4 |
| Cakes | 2.2 | 1.1 | 5.4 |
| Pastries | 0.1 | 0.7 | 3.6 |
| Frozen Baked Goods | −1.1 | −1.6 | −7.9 |
| Dessert Mixes | −2.7 | −5.1 | −22.9 |
|
Source: Euromonitor International, 2022 *CAGR: Compound annual growth rate |
|||
| Category | 2022 | 2023 | 2024 | 2025 | 2026 |
|---|---|---|---|---|---|
| Baked goods total | 18,522.6 | 18,990.7 | 19,491.8 | 19,986.6 | 20,471.2 |
| Bread | 10,146.4 | 10,436.4 | 10,737.6 | 11,015.4 | 11,268.4 |
| Cakes | 4,668.8 | 4,813.8 | 4,982.0 | 5,166.7 | 5,365.5 |
| Pastries | 3,511.4 | 3,547.2 | 3,581.9 | 3,617.4 | 3,653.9 |
| Frozen Baked Goods | 100.4 | 99.5 | 98.3 | 97.1 | 95.6 |
| Dessert Mixes | 95.6 | 93.8 | 92.0 | 90.0 | 87.8 |
| Source: Euromonitor International, 2022 | |||||
| Category | Annual growth % 2021-2022 | CAGR* % 2021-2026 | Annual growth % 2021-2026 |
|---|---|---|---|
| Baked goods total | 2.4 | 2.5 | 13.1 |
| Bread | 2.2 | 2.7 | 14.1 |
| Cakes | 3.7 | 3.3 | 17.6 |
| Pastries | 1.0 | 1.0 | 5.3 |
| Frozen Baked Goods | −1.6 | −1.2 | −5.6 |
| Dessert Mixes | −2.5 | −2.1 | −9.9 |
|
Source: Euromonitor International, 2022 *CAGR: Compound annual growth rate |
|||
| Company | Retail sales (US$ millions) | Market share (%) |
|---|---|---|
| Others | 15,005.0 | 82.9 |
| Private Label | 894.8 | 4.9 |
| Barilla Holding SpA | 526.7 | 2.9 |
| Pasquier SA | 452.1 | 2.5 |
| Limagrain, Groupe | 272.5 | 1.5 |
| Groupe Norac SA | 224.6 | 1.2 |
| Mondelez International Inc | 176.1 | 1.0 |
| Source: Euromonitor International, 2022 | ||
New product launches
From 2017 to 2021, 8,766 baked goods products were introduced in France, with the highest number of new products launched in 2019. The most popular product claim was environmentally friendly package followed by recycling, organic. The companies with the highest number of new product launches was Mondelez, followed by Scamark, and De Neuville.
| Product attributes | Number of new product by year | Total | ||||
|---|---|---|---|---|---|---|
| 2017 | 2018 | 2019 | 2020 | 2021 | ||
| Yearly product launches | 1,750 | 1,819 | 1,854 | 1,529 | 1,814 | 8,766 |
| Top 5 claims | ||||||
| Ethical - Environmentally Friendly Package | 629 | 632 | 662 | 481 | 578 | 2,982 |
| Ethical - Recycling | 618 | 622 | 647 | 470 | 547 | 2,904 |
| Organic | 371 | 433 | 502 | 422 | 539 | 2,267 |
| Not Specified | 468 | 453 | 329 | 346 | 380 | 1,976 |
| No Additives/Preservatives | 258 | 276 | 288 | 217 | 313 | 1,352 |
| Top 5 companies | ||||||
| Mondelez | 99 | 93 | 77 | 31 | 47 | 347 |
| Scamark | 60 | 52 | 64 | 41 | 44 | 261 |
| De Neuville | 0 | 13 | 65 | 78 | 91 | 247 |
| Interdis | 6 | 23 | 20 | 59 | 83 | 191 |
| Lidl | 35 | 34 | 61 | 19 | 41 | 190 |
| Top 5 flavours (including blend) | ||||||
| Unflavoured/Plain | 405 | 446 | 403 | 388 | 475 | 2,117 |
| Chocolate | 215 | 203 | 221 | 147 | 172 | 958 |
| Butter | 59 | 68 | 66 | 66 | 45 | 304 |
| Chocolate (Milk) | 67 | 44 | 60 | 43 | 55 | 269 |
| Chocolate (Dark/Black) | 44 | 36 | 51 | 48 | 55 | 234 |
| Top 5 ingredients | ||||||
| Wheat Flour (Food) | 1,327 | 1,296 | 1,316 | 1,081 | 1,179 | 6,199 |
| Salt (Food) | 1,253 | 1,177 | 1,234 | 962 | 1,099 | 5,725 |
| White Sugar (Food) | 1,105 | 1,098 | 1,096 | 859 | 961 | 5,119 |
| Raising Agents | 807 | 828 | 892 | 640 | 735 | 3,902 |
| Emulsifiers | 822 | 775 | 803 | 573 | 678 | 3,651 |
| Top 5 package types | ||||||
| Flexible | 1,419 | 1,453 | 1,531 | 1,213 | 1,377 | 6,993 |
| Carton | 45 | 67 | 96 | 116 | 121 | 445 |
| Flexible stand-up pouch | 42 | 66 | 68 | 49 | 104 | 329 |
| Tray | 69 | 55 | 49 | 43 | 46 | 262 |
| Clam-pack | 35 | 49 | 36 | 33 | 35 | 188 |
| Launch types | ||||||
| New Variety/Range Extension | 721 | 819 | 779 | 629 | 729 | 3,677 |
| New Packaging | 500 | 490 | 488 | 385 | 477 | 2,340 |
| New Product | 410 | 388 | 427 | 333 | 351 | 1,909 |
| Relaunch | 107 | 112 | 152 | 175 | 251 | 797 |
| New Formulation | 12 | 10 | 8 | 7 | 6 | 43 |
| Source: Mintel GNPD, 2022 | ||||||
Examples of new products
Protein Pancakes Mix

| Company | HNC Healthy Nutrition Company |
|---|---|
| Manufacturer | HNC Healthy Nutrition Company |
| Brand | Maxi Nutrition |
| Category | Bakery |
| Sub-category | Baking ingredients and mixes |
| Market | France |
| Store name | E.Leclerc |
| Store type | Mass merchandise / hypermarket |
| Price in US dollars | 11.88 |
The product is said to be easy to prepare, contains 58% protein and is low in sugar. It is free from palm oil, artificial colours and flavours, and has been Cologne List Tested as a product of Commitment to a Clean Sport. It retails in a 400 gram pack containing eight servings.
3 Seeds Buckwheat, Sesame and Poppy Biscuits
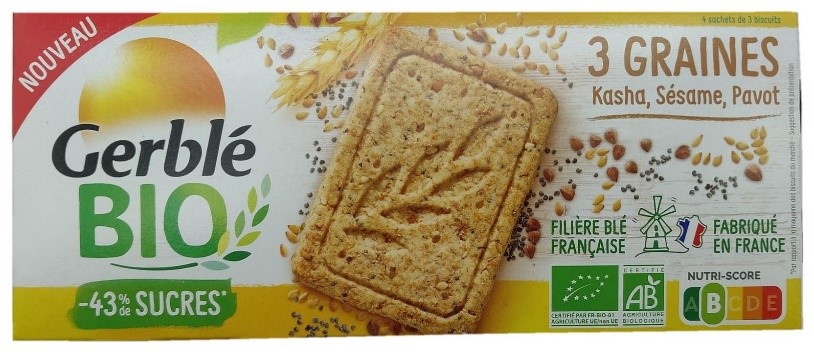
| Company | Nutrition et Santé |
|---|---|
| Manufacturer | Nutrition et Santé |
| Brand | Gerblé Bio |
| Category | Bakery |
| Sub-category | Sweet biscuits / cookies |
| Market | France |
| Location of manufacture | France |
| Import status | Not imported |
| Store name | Carrefour |
| Store type | Supermarket |
| Price in US dollars | 2.70 |
This organic product with French wheat, features 43% less sugar, 78% less saturated fatty acids and 35% less salt than other biscuits of the same range. It contains kasha grains, which are toasted buckwheat, sesame and crunchy poppy seeds, and is free from palm oil and rich in fibres. It scores a B on the Nutri-score, and retails in a 132 gram recycled and partially recyclable pack containing four sachets of three biscuits, and bearing the AB - Agriculture Biologique and EU Organic logos. The manufacturer is claimed to combine the best environmental practices, act for the biodiversity and natural resources, and guarantee incomes for millers and farmers.
Organic Corn Pizza Base

| Company | Schnitzer |
|---|---|
| Manufacturer | Schnitzer |
| Brand | Schnitzer Gluten-Free |
| Category | Bakery |
| Sub-category | Bread and bread products |
| Market | France |
| Location of manufacture | Germany |
| Import status | Imported product |
| Store name | Greenweez.com |
| Store type | Internet / mail order |
| Price in US dollars | 2.10 |
The product is a source of fibres, is free from gluten, lactose and palm oil, and can be oven-baked in 10 to 12 minutes. It retails in a 100 gram pack containing one unit and featuring a recipe suggestion, the EU Organic logo and preparation instructions.
Spain
Market overview
Consumer trends that emerged during pandemic restrictions have persisted following the easing of restrictions in spring 2021, with many employees continuing to work from home. As a result, the rate of growth in sales of baked goods is expected to increase over 2021 to 2026, with demand continuing to shift from unpackaged to packaged baked goods due to hygiene concerns.
Consumers continue to enjoy leisurely breakfasts working from home, supporting increased consumption of products like bread and pastries. People are also cooking more at home and thus consuming more bread, in particular flat breads like tortillas, as an accompaniment to meals. Bread sales are expected to increase by a CAGR of 1.8% over 2021 to 2026 to US$3.9 billion in 2026. Frozen baked goods are forecast to see the fastest growth of all baked goods by a CAGR of 3.0% over 2021 to 2026, followed by pastries (2.9%) and bread (1.8%).
Organic and other health and wellness offerings are expected to continue growing in importance in baked goods. Price remains a major barrier but retail chains are launching private label organic baked goods, in addition to stocking more branded organic offerings, such as Oroweat Bio by Bimbo.
| Category | 2016 | 2017 | 2018 | 2019 | 2020 | 2021 |
|---|---|---|---|---|---|---|
| Baked goods total | 5,704.1 | 5,485.5 | 5,372.3 | 5,277.4 | 5,369.4 | 5,437.4 |
| Bread | 3,863.8 | 3,678.1 | 3,590.2 | 3,508.8 | 3,543.2 | 3,566.0 |
| Pastries | 809.7 | 804.8 | 803.0 | 802.5 | 832.6 | 857.9 |
| Cakes | 895.7 | 874.0 | 855.3 | 842.8 | 864.1 | 878.5 |
| Frozen Baked Goods | 96.7 | 91.3 | 87.3 | 87.5 | 92.0 | 96.2 |
| Dessert Mixes | 38.2 | 37.3 | 36.5 | 35.8 | 37.5 | 38.8 |
| Source: Euromonitor International, 2022 | ||||||
| Category | Annual growth % 2020-2021 | CAGR* % 2016-2021 | Total growth % 2016-2021 |
|---|---|---|---|
| Baked goods total | 1.3 | −1.0 | −4.7 |
| Bread | 0.6 | −1.6 | −7.7 |
| Pastries | 2.9 | 1.2 | 6.0 |
| Cakes | 1.6 | −0.4 | −1.9 |
| Frozen Baked Goods | 4.4 | −0.1 | −0.5 |
| Dessert Mixes | 3.4 | 0.3 | 1.6 |
|
Source: Euromonitor International, 2022 *CAGR: Compound annual growth rate |
|||
| Category | 2022 | 2023 | 2024 | 2025 | 2026 |
|---|---|---|---|---|---|
| Baked goods total | 5,554.9 | 5,674.0 | 5,789.2 | 5,889.8 | 5,979.9 |
| Bread | 3,628.1 | 3,698.1 | 3,767.8 | 3,835.9 | 3,898.3 |
| Pastries | 886.8 | 913.7 | 941.5 | 966.3 | 988.7 |
| Cakes |
899.7 |
917.3 | 931.1 | 935.9 | 940.5 |
| Frozen Baked Goods | 100.3 | 104.1 | 107.8 | 110.7 | 111.6 |
| Dessert Mixes | 40.0 | 40.8 | 41.0 | 41.0 | 40.8 |
| Source: Euromonitor International, 2022 | |||||
| Category | Annual growth % 2021-2022 | CAGR* % 2021-2026 | Annual growth % 2021-2026 |
|---|---|---|---|
| Baked goods total | 1.5 | 1.9 | 10.0 |
| Bread | 1.6 | 1.8 | 9.3 |
| Pastries | 2.3 | 2.9 | 15.2 |
| Cakes | 0.5 | 1.4 | 7.1 |
| Frozen Baked Goods | 0.8 | 3.0 | 16.0 |
| Dessert Mixes | −0.5 | 1.0 | 5.2 |
|
Source: Euromonitor International, 2022 *CAGR: Compound annual growth rate |
|||
| Company | Retail sales (US$ millions) | Market share (%) |
|---|---|---|
| Others | 3,821.1 | 70.3 |
| Grupo Bimbo SAB de CV | 681.7 | 12.5 |
| Private Label | 519.4 | 9.6 |
| Vicky Foods Products SLU | 224.3 | 4.1 |
| Adam Foods SL | 59.4 | 1.1 |
| Dr Schär AG/SpA | 33.4 | 0.6 |
| DE Master Blenders 1753 NV | 26.2 | 0.5 |
| Source: Euromonitor International, 2022 | ||
New product launches
From 2017 to 2021, 3,785 baked goods products were introduced in Spain, with the highest number of new products launched in 2021. The most popular product claim was Low/No/Reduced Allergen. Followed by environmentally friendly package and recycling. The companies with the highest number of new product launches was Aldi, followed by Mercadona, and Lidle.
| Product attributes | Number of new product by year | Total | ||||
|---|---|---|---|---|---|---|
| 2017 | 2018 | 2019 | 2020 | 2021 | ||
| Yearly product launches | 807 | 826 | 735 | 658 | 759 | 3,785 |
| Top 5 claims | ||||||
| Not Specified | 245 | 201 | 138 | 120 | 153 | 857 |
| Low/No/Reduced Allergen | 154 | 187 | 194 | 159 | 132 | 826 |
| Ethical - Environmentally Friendly Package | 98 | 129 | 152 | 184 | 244 | 807 |
| Ethical - Recycling | 92 | 122 | 146 | 169 | 222 | 751 |
| Organic | 118 | 156 | 208 | 138 | 89 | 709 |
| Top 5 companies | ||||||
| Aldi | 41 | 38 | 71 | 50 | 36 | 236 |
| Mercadona | 11 | 30 | 82 | 35 | 33 | 191 |
| Lidl | 35 | 49 | 18 | 28 | 54 | 184 |
| Carrefour | 14 | 13 | 50 | 40 | 30 | 147 |
| Bimbo Donuts | 0 | 7 | 8 | 22 | 30 | 67 |
| Top 5 flavours (including blend) | ||||||
| Unflavoured/Plain | 253 | 311 | 261 | 257 | 262 | 1,344 |
| Chocolate | 92 | 81 | 59 | 62 | 94 | 388 |
| Cocoa/Cacao | 43 | 19 | 27 | 18 | 31 | 138 |
| Chocolate (Milk) | 19 | 8 | 16 | 17 | 29 | 89 |
| Chocolate (Dark/Black) | 11 | 14 | 20 | 15 | 28 | 88 |
| Top 5 ingredients | ||||||
| Salt (Food) | 555 | 566 | 467 | 442 | 535 | 2,565 |
| Wheat Flour (Food) | 565 | 538 | 421 | 398 | 514 | 2,436 |
| White Sugar (Food) | 466 | 425 | 331 | 355 | 502 | 2,079 |
| Emulsifiers | 418 | 372 | 333 | 329 | 457 | 1,909 |
| Raising Agents | 432 | 274 | 286 | 237 | 336 | 1,565 |
| Top 5 package types | ||||||
| Flexible | 689 | 684 | 623 | 513 | 617 | 3,126 |
| Flexible stand-up pouch | 9 | 32 | 26 | 41 | 39 | 147 |
| Carton | 27 | 29 | 25 | 26 | 17 | 124 |
| Tray | 22 | 18 | 9 | 21 | 16 | 86 |
| Clam-pack | 21 | 23 | 6 | 3 | 11 | 64 |
| Launch types | ||||||
| New Variety/Range Extension | 437 | 416 | 406 | 302 | 337 | 1,898 |
| New Product | 239 | 254 | 221 | 167 | 139 | 1,020 |
| New Packaging | 85 | 100 | 71 | 116 | 204 | 576 |
| Relaunch | 30 | 43 | 31 | 65 | 68 | 237 |
| New Formulation | 16 | 13 | 6 | 8 | 11 | 54 |
| Source: Mintel GNPD, 2022 | ||||||
Examples of new products
Sun-Dried Tomato & Herb Organic Scottish Oatcakes

| Company | Clearspring |
|---|---|
| Manufacturer | Clearspring |
| Brand | Clearspring |
| Category | Bakery |
| Sub-category | Savoury biscuits / crackers |
| Market | Spain |
| Location of manufacture | United Kingdom |
| Import status | Imported product |
| Store name | El Corte Inglés |
| Store type | Department store |
| Price in US dollars | 4.41 |
This vegan wholegrain product is high in fibre and is said to be made using the finest organic and carefully selected ingredients, including pinhead oats, rolled oats, oat flour and olive oil, baked to perfection in small batches by fourth generation craft bakers in the Scottish Highlands, and which are the secret to the delicious flavour and creamy texture of the cakes. It is free from added sugars, dairy and palm oil, and retails in a 200 gram pack with featuring EU Organic, Soil Association Organic and Vegan Society Approved Vegan Trademark logos.
Gluten Free Puff Pastry Dough

| Company | Adpan Europa |
|---|---|
| Manufacturer | Adpan Europa |
| Brand | Adpan |
| Category | Bakery |
| Sub-category | Baking ingredients and mixes |
| Market | Spain |
| Location of manufacture | Spain |
| Import status | Not imported |
| Store name | Consum.es |
| Store type | Internet / mail order |
| Price in US dollars | 2.50 |
Adpan Masa de Hojaldre sin Gluten (Gluten Free Puff Pastry Dough) has been relaunched, now free from palm oil and in a newly designed packaging. The product is free from gluten, egg, soya, milk, seeds, nuts and peanuts and retails in a 250 gram pack featuring the Facebook, Twitter, and Instagram logos and the Vegan V-Label seal by the European Vegetarian Union.
White Chocolate and Cranberry Cookies

| Company | Arluy |
|---|---|
| Manufacturer | Arluy |
| Brand | B-Live Sin Gluten |
| Category | Bakery |
| Sub-category | Sweet biscuits / cookies |
| Market | Spain |
| Location of manufacture | United Kingdom |
| Import status | Imported product |
| Store name | El Corte Inglés |
| Store type | Department store |
| Price in US dollars | 3.81 |
This product has been made with 100% oat flour and is free from palm oil and gluten. It retails in a 150 gram recyclable pack.
Poland
Market overview
Sales of baked goods in Poland remain mostly artisanal from bakeries, as their popularity is driven by the perception of higher quality and use traditional Polish recipes, perceptions that have been prominent during the pandemic. Polish consumers are not expected to change this habit and are increasingly choosing packaged products, which has prompted some companies to invest in frozen artisanal products, which are then sold to retailers to be re-baked in-store. Despite this, packaged flat bread is growing in popularity in Poland, especially corn packaged flat bread, which is popular in Mexican cuisine. Flat breads are also used as a wrap for making sandwiches and as employees return to the office, demand is expected to grow. Bread sales are expected to increase by a CAGR of 3.8% over 2021 to 2026 to US$5.2 billion in 2026.
Pastries are forecast to see the fastest growth of all baked goods by a CAGR of 5.9% over 2021 to 2026, followed by dessert mizes (4.8%) and bread (3.8%).
| Category | 2016 | 2017 | 2018 | 2019 | 2020 | 2021 |
|---|---|---|---|---|---|---|
| Baked goods total | 3,702.5 | 3,718.0 | 3,831.3 | 4,037.2 | 4,248.0 | 4,419.4 |
| Bread | 2,488.8 | 2,414.8 | 2,431.2 | 2,570.3 | 2,711.2 | 2,786.0 |
| Pastries | 462.2 | 520.3 | 580.5 | 620.2 | 683.7 | 733.7 |
| Cakes | 653.5 | 682.0 | 714.9 | 737.7 | 734.1 | 771.7 |
| Dessert Mixes | 88.1 | 90.6 | 93.7 | 97.7 | 107.0 | 115.4 |
| Frozen Baked Goods | 9.9 | 10.3 | 11.0 | 11.3 | 12.0 | 12.6 |
| Source: Euromonitor International, 2022 | ||||||
| Category | Annual growth % 2020-2021 | CAGR* % 2016-2021 | Total growth % 2016-2021 |
|---|---|---|---|
| Baked goods total | 3.9 | 3.6 | 19.4 |
| Bread | 2.7 | 2.3 | 11.9 |
| Pastries | 6.8 | 9.7 | 58.7 |
| Cakes | 4.9 | 3.4 | 18.1 |
| Dessert Mixes | 7.3 | 5.5 | 31.0 |
| Frozen Baked Goods | 4.8 | 4.9 | 27.3 |
|
Source: Euromonitor International, 2022 *CAGR: Compound annual growth rate |
|||
| Category | 2022 | 2023 | 2024 | 2025 | 2026 |
|---|---|---|---|---|---|
| Baked goods total | 4,419.4 | 4,582.9 | 4,781.0 | 4,995.1 | 5,205.3 |
| Bread | 2,786.0 | 2,873.8 | 2,978.1 | 3,099.5 | 3,226.2 |
| Pastries | 733.7 | 780.0 | 828.7 | 879.4 | 929.5 |
| Cakes | 771.7 | 794.6 | 833.4 | 868.8 | 895.8 |
| Dessert Mixes | 115.4 | 121.5 | 127.5 | 133.8 | 140.0 |
| Frozen Baked Goods | 12.6 | 13.0 | 13.3 | 13.6 | 13.8 |
| Source: Euromonitor International, 2022 | |||||
| Category | Annual growth % 2021-2022 | CAGR* % 2021-2026 | Annual growth % 2021-2026 |
|---|---|---|---|
| Baked goods total | 3.9 | 4.2 | 22.6 |
| Bread | 4.1 | 3.8 | 20.7 |
| Pastries | 5.1 | 5.9 | 33.5 |
| Cakes | 2.1 | 3.5 | 18.6 |
| Dessert Mixes | 4.0 | 4.8 | 26.4 |
| Frozen Baked Goods | 0.7 | 2.0 | 10.3 |
|
Source: Euromonitor International, 2022 *CAGR: Compound annual growth rate |
|||
| Company | Retail sales (US$ millions) | Market share (%) |
|---|---|---|
| Ecotone | 45.9 | 52.4 |
| East West Tea Co LLC | 14.5 | 16.6 |
| Unilever Group | 12.2 | 13.9 |
| Hain Celestial Group Inc, The | 1.8 | 2.1 |
| Simon Lévelt BV | 1.3 | 1.5 |
| Private Label | 5.0 | 5.7 |
| Others | 6.9 | 7.9 |
| Source: Euromonitor International, 2022 | ||
New product launches
From 2017 to 2021, 2,464 baked goods products were introduced in Poland, with the highest number of new products launched in 2017. The most popular product claim was low/no/reduced allergen, followed by organic, and gluten free. The companies with the highest number of new product launches were Lifle, followed by Jeronimo Martins, and Aldi.
| Product attributes | Number of new product by year | Total | ||||
|---|---|---|---|---|---|---|
| 2017 | 2018 | 2019 | 2020 | 2021 | ||
| Yearly product launches | 546 | 434 | 539 | 485 | 460 | 2,464 |
| Top 5 claims | ||||||
| Not Specified | 187 | 128 | 182 | 111 | 107 | 715 |
| Low/No/Reduced Allergen | 87 | 57 | 81 | 95 | 87 | 407 |
| Organic | 31 | 56 | 77 | 125 | 89 | 378 |
| Gluten Free | 80 | 52 | 74 | 88 | 77 | 371 |
| No Additives/Preservatives | 67 | 65 | 53 | 64 | 60 | 309 |
| Top 5 companies | ||||||
| Lidl | 41 | 33 | 63 | 42 | 46 | 225 |
| Jeronimo Martins | 28 | 33 | 35 | 40 | 37 | 173 |
| Aldi | 9 | 17 | 33 | 9 | 20 | 88 |
| Mondelez | 9 | 13 | 21 | 9 | 9 | 61 |
| Carrefour | 0 | 5 | 17 | 16 | 12 | 50 |
| Top 5 flavours (including blend) | ||||||
| Unflavoured/Plain | 148 | 122 | 158 | 152 | 130 | 710 |
| Chocolate | 31 | 23 | 33 | 16 | 32 | 135 |
| Cocoa/Cacao | 21 | 7 | 26 | 14 | 18 | 86 |
| Coconut | 13 | 9 | 16 | 9 | 11 | 58 |
| Butter | 13 | 6 | 12 | 13 | 13 | 57 |
| Top 5 ingredients | ||||||
| Wheat Flour (Food) | 370 | 277 | 344 | 257 | 272 | 1,520 |
| Salt (Food) | 343 | 301 | 320 | 262 | 265 | 1,491 |
| White Sugar (Food) | 321 | 248 | 302 | 204 | 249 | 1,324 |
| Raising Agents | 271 | 214 | 251 | 193 | 211 | 1,140 |
| Emulsifiers | 256 | 213 | 258 | 179 | 208 | 1,114 |
| Top 5 Packaged Types | ||||||
| Flexible | 449 | 350 | 459 | 391 | 393 | 2,042 |
| Flexible stand-up pouch | 20 | 24 | 24 | 33 | 15 | 116 |
| Flexible sachet | 23 | 17 | 24 | 20 | 11 | 95 |
| Carton | 15 | 14 | 10 | 15 | 9 | 63 |
| Tray | 12 | 16 | 13 | 11 | 8 | 60 |
| Launch types | ||||||
| New Variety/Range Extension | 212 | 198 | 233 | 187 | 209 | 1,039 |
| New Product | 240 | 166 | 227 | 195 | 140 | 968 |
| New Packaging | 52 | 50 | 41 | 73 | 95 | 311 |
| Relaunch | 39 | 19 | 35 | 28 | 13 | 134 |
| New Formulation | 3 | 1 | 3 | 2 | 3 | 12 |
| Source: Mintel GNPD, 2022 | ||||||
Examples of new products
Five Cereal Cupcake Preparation with Chocolate and Sunflower Seeds

| Company | Dr. Oetker |
|---|---|
| Brand | Dr. Oetker My Natural Day |
| Category | Bakery |
| Sub-category | Baking ingredients and mixes |
| Market | Poland |
| Store name | Kaufland |
| Store type | Mass merchandise / hypermarket |
| Price in US dollars | 1.75 |
The vegetarian mix contains linseed and chocolate pieces and is a source of fibre. It is free from preservatives, colourants, glucose syrup, and palm oil, and retails in a 263 gram pack containing one 212 gram baking mixture, one 50 gram mixture of chocolate drops and sunflower seeds, and 10 paper muffin cups and featuring preparation instructions.
Cereal Biscuits with Cranberry

| Company | Sante A. Kowalski |
|---|---|
| Manufacturer | Sante A. Kowalski |
| Brand | Sante Fit |
| Category | Bakery |
| Sub-category | Sweet biscuits / cookies |
| Market | Poland |
| Store name | Kaufland |
| Store type | Mass merchandise / hypermarket |
| Price in US dollars | 0.45 |
The product is described as tasty and nutritious cereal cookies that are perfect for people who care about healthy and active lifestyle and want to reduce sugar in their diet. They are a source of fibre, contain manganese that contributes to normal carbohydrate metabolism, with no palm oil and no added sugars because their sweetness comes from naturally occurring sugars in fruits.
Organic Lentil Cookies with Chocolate

| Company | Pro-Bio |
|---|---|
| Manufacturer | Pro-Bio |
| Brand | Biolinie |
| Category | Bakery |
| Sub-category | Sweet biscuits / cookies |
| Market | Poland |
| Store name | Vis Vitalis |
| Store type | Natural / health food store |
| Price in US dollars | 2.47 |
This gluten- and palm oil-free product retails in a 100 gram pack, featuring EU Green Leaf and BIO logos.
For more information
The Canadian Trade Commissioner Service:
International Trade Commissioners can provide Canadian industry with on-the-ground expertise regarding market potential, current conditions and local business contacts, and are an excellent point of contact for export advice.
More agri-food market intelligence:
International agri-food market intelligence
Discover global agriculture and food opportunities, the complete library of Global Analysis reports, market trends and forecasts, and information on Canada's free trade agreements.
Agri-food market intelligence service
Canadian agri-food and seafood businesses can take advantage of a customized service of reports and analysis, and join our email subscription service to have the latest reports delivered directly to their inbox.
More on Canada's agriculture and agri-food sectors:
Canada's agriculture sectors
Information on the agriculture industry by sector. Data on international markets. Initiatives to support awareness of the industry in Canada. How the department engages with the industry.
Resources
- Euromonitor International:
- Baked goods in Italy (December 2021)
- Baked goods in Germany (December 2021)
- Baked goods in France (December 2021)
- Baked goods in Spain (December 2021)
- Baked goods in Poland (December 2021)
- Mintel, Global New Product Database (accessed Sept, 2022)
Baked goods in the European Union – Focus on top five markets
Global Analysis Report
Prepared by: Kris Clipsham, Market Analyst
© His Majesty the King in Right of Canada, represented by the Minister of Agriculture and Agri-Food (2022).
Photo credits
All photographs reproduced in this publication are used by permission of the rights holders.
All images, unless otherwise noted, are copyright His Majesty the King in Right of Canada.
To join our distribution list or to suggest additional report topics or markets, please contact:
Agriculture and Agri-Food Canada, Global Analysis1341 Baseline Rd, Tower 5, 3rd floor
Ottawa ON K1A 0C5
Canada
Email: aafc.mas-sam.aac@agr.gc.ca
The Government of Canada has prepared this report based on primary and secondary sources of information. Although every effort has been made to ensure that the information is accurate, Agriculture and Agri-Food Canada (AAFC) assumes no liability for any actions taken based on the information contained herein.
Reproduction or redistribution of this document, in whole or in part, must include acknowledgement of agriculture and agri-food Canada as the owner of the copyright in the document, through a reference citing AAFC, the title of the document and the year. Where the reproduction or redistribution includes data from this document, it must also include an acknowledgement of the specific data source(s), as noted in this document.
Agriculture and Agri-Food Canada provides this document and other report services to agriculture and food industry clients free of charge.