

Note: This report includes forecasting data that is based on baseline historical data.
Executive summary
On September 21, 2017, the Canada-European Union Comprehensive Economic and Trade Agreement (CETA) entered into force.
Since 2016 – the last full year before preferential tariff treatment under CETA became applicable, Canada's agri-food and seafood exports to the EU have increased to Can$5.4 billion in 2020, up by 47.7%.
Latvia, Ireland, Estonia, Austria, and Romania are Canada's fastest growing export markets in the EU, with exports to each either doubling or tripling in the four years since the implementation of CETA.
The Netherlands, France, Italy, Germany, and Belgium represent Canada's top 5 EU export markets and 79.9% of total Canadian exports of agri-food and seafood to the EU (2020).
At the sectoral level, since 2016, Canada's fastest growing exports to the EU have been a mix of commodities and value added products, including canola seed, cranberries, baked goods, frozen fruit and nuts, linseed, maple sugar, and durum wheat. Exports of these products are new to some EU markets and have substantially picked up post-CETA.
Eight out of the thirteen Canadian provinces and territories posted an increase in exports to the EU since 2016, led by the NWT, followed by Saskatchewan, Manitoba, Alberta, Nova Scotia, and Quebec.
Overview
On September 21, 2017, the Canada-European Union Comprehensive Economic and Trade Agreement (CETA) entered into force. Canada's agri-food and seafood exports to the EU have increased to Can$5.4 billion in 2020, a 47.7% increase compared to 2016 - the last full year before preferential tariff treatment under CETA became applicable.
The expansion in Canadian agri-food and seafood exports to the EU since the implementation of CETA was mainly due to growing exports to the Netherlands, which rose the fastest, by 123.0%, followed by France (78.0%), Italy (52.1%), Germany (43.4%), and Belgium (38.5%). These markets represent 79.9% of total Canadian exports of agri-food and seafood to the EU (2020). It should be noted that the Netherlands is a transhipment point for EU trade. Many products exported by Canada to the Netherlands may be shipped further to other EU countries.
Canadian agri-food and seafood exports decreased in the five other markets, other than Ireland, which rose by 266.3%. Exports to Poland fell the fastest, by 24.0%, followed by Portugal (21.9%), Spain (13.3%), and Denmark (11.4%). These markets represent 15.5% of total Canadian exports of agri-food and seafood to the EU (2020).
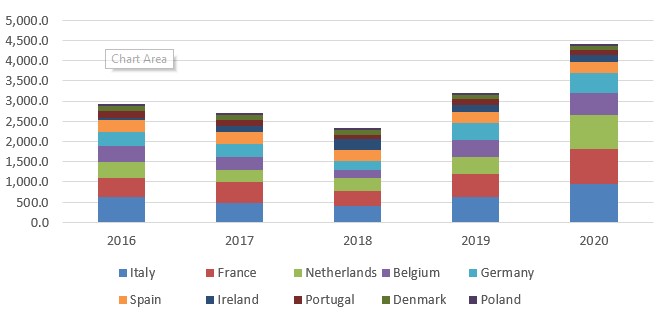
Description of above image
| Country | 2016 | 2017 | 2018 | 2019 | 2020 |
|---|---|---|---|---|---|
| Italy | 616.8 | 478.5 | 403.9 | 625.3 | 938.2 |
| France | 488.9 | 509.3 | 366.8 | 577.9 | 870.3 |
| Netherlands | 376.5 | 312.5 | 321.8 | 413.9 | 839.4 |
| Belgium | 404.0 | 306.8 | 212.6 | 428.3 | 559.6 |
| Germany | 341.6 | 320.7 | 221.9 | 413.8 | 489.9 |
| Spain | 310.3 | 318.7 | 257.4 | 265.4 | 269.1 |
| Ireland | 44.8 | 134.5 | 279.0 | 172.9 | 164.1 |
| Portugal | 160.8 | 150.3 | 98.8 | 142.3 | 125.6 |
| Denmark | 124.4 | 120.7 | 115.6 | 116.0 | 110.3 |
| Poland | 63.8 | 55.4 | 56.6 | 49.9 | 48.5 |
Source: Global Trade Tracker
| HS6 | Description | Pre-CETA[1] | Post-CETA[1] | Growth | Growth (%) |
|---|---|---|---|---|---|
| Total | 3,143.1 | 4,652.3 | 1,509.2 | 48.0 | |
| 120510 | Canola seeds | 321.0 | 1,302.6 | 981.6 | 305.8 |
| 100119 | Durum wheat | 443.9 | 659.4 | 215.5 | 48.5 |
| 120190 | soya beans | 599.3 | 642.1 | 42.8 | 7.1 |
| 081190 | frozen fruit and nuts | 69.0 | 130.1 | 61.1 | 88.5 |
| 100590 | Corn | 161.1 | 128.5 | −32.6 | −20.2 |
| 230910 | Dog or cat food | 100.8 | 127.6 | 26.7 | 26.5 |
| 120400 | Linseed | 61.0 | 107.0 | 46.1 | 75.5 |
| 170220 | Maple sugar | 74.2 | 105.3 | 31.1 | 41.9 |
| 030632 | Lobsters | 0.0 | 94.5 | 94.5 | |
| 071340 | Lentils | 144.1 | 87.8 | −56.4 | −39.1 |
| 210690 | Food preparations, nowhere else specified | 53.9 | 75.8 | 21.9 | 40.7 |
| 030612 | Frozen lobsters | 100.1 | 67.6 | −32.5 | −32.5 |
| 200893 | Cranberries | 22.6 | 65.8 | 43.2 | 190.9 |
| 071339 | Dried, shelled beans | 45.4 | 59.9 | 14.5 | 31.9 |
| 220710 | Undenatured ethyl alcohol | 0.0 | 59.4 | 59.4 | |
| 100199 | Wheat and meslin | 75.6 | 59.0 | −16.6 | −22.0 |
| 071333 | Kidney beans | 26.9 | 53.3 | 26.3 | 97.7 |
| 030616 | Frozen cold-water shrimps | 70.4 | 49.3 | −21.1 | −30.0 |
| 151419 | Canola oil | 20.0 | 47.4 | 27.4 | 136.7 |
| 030722 | Scallops | 0.0 | 43.0 | 43.0 | |
Source: Global Trade Tracker 1: Pre-CETA refers to 2016. Post-CETA refers to 2020. |
|||||
CETA has been in effect for over four years, since 2017. During this time, Canadian agri-food and seafood exports to the EU totalled $5.4 billion, an increase of 47.7%
At the sectoral level, since CETA entered into force, four out of the top five exports to the EU have shown solid growth. Canada's top export, canola seeds, rose 301.3%. Exports of soybeans, durum wheat, and wheat and meslin all improved. Conversely, exports of corn fell 7.0%.
Canada's fastest growing exports to the EU are a mix of commodities and value added products, including canola seed (301.3%), cranberries (160.4%), baked goods (140.5%), frozen fruit and nuts (81.3%), Linseed (75%), maple sugar (50.0%), and durum wheat (48.7%). New exports to the EU of lobster and ethyl alcohol have also picked up strongly post-CETA.
| Country | Pre-CETA[1] | Post-CETA[1] | Growth | Growth (%) |
|---|---|---|---|---|
| Latvia | 2,693,739 | 10,418,848 | 7,725,109 | 286.8 |
| Ireland | 46,491,292 | 166,022,628 | 119,531,336 | 257.1 |
| Estonia | 2,184,263 | 6,469,508 | 4,285,245 | 196.2 |
| Austria | 2,911,042 | 7,468,106 | 4,557,064 | 156.5 |
| Luxembourg | 95,786 | 231,915 | 136,129 | 142.1 |
| Netherlands | 380,970,538 | 844,961,669 | 463,991,131 | 121.8 |
| Romania | 5,379,093 | 11,511,738 | 6,132,645 | 114.0 |
| Malta | 1,072,735 | 2,211,412 | 1,138,677 | 106.1 |
| Slovenia | 1,890,299 | 3,694,698 | 1,804,399 | 95.5 |
| France | 491,797,016 | 872,932,341 | 381,135,325 | 77.5 |
| Croatia | 6,360,792 | 10,149,195 | 3,788,403 | 59.6 |
| Italy | 620,686,562 | 941,813,554 | 321,126,992 | 51.7 |
| European Union 27 | 3,143,073,646 | 4,652,266,596 | 1,509,192,950 | 48.0 |
Source: Global Trade Tracker 1: Pre-CETA refers to 2016. Post-CETA refers to 2020. |
||||
Canada's export performance with EU member states
Canada's five fastest growing EU export markets
Latvia
Since the implementation of CETA, although comparatively small, Canada's exports to Latvia have grown the fastest out of Canada's exports to all EU member states. Canada's exports of various products to Latvia has led to an increase of Can$7.7 million or more than the tripling of exports, with wine being the fastest growing export, followed by whiskies, mustard flour and meal, solid fructose, and dog.cat food supporting growth. Live plants, confectionary, vegetable products, solid sugar, and cranberries are new exports to Latvia that are also supporting Canada's export growth.
| HS6 | Description | Pre-CETA[1] | Post-CETA[1] | Growth | Growth (%) |
|---|---|---|---|---|---|
| Total | 2,693,739 | 10,418,848 | 7,725,109 | 286.8 | |
| 060290 | Live plants | 23,036 | 23,036 | ||
| 170490 | Confectionery products | 17,182 | 17,182 | ||
| 220421 | Wine | 4,080 | 126,996 | 122,916 | 3012.6 |
| 140490 | Vegetable products, nowhere else specified | 1,543 | 1,543 | ||
| 170290 | Solid sugar | 210,917 | 210,917 | ||
| 220830 | Whiskies | 178,569 | 900,591 | 722,022 | 404.3 |
| 200893 | Cranberries | 184,464 | 184,464 | ||
| 090122 | Roasted, decaffeinated coffee | 1,020 | 2,753 | 1,733 | 169.9 |
| 210330 | Mustard flour and meal | 78,810 | 103,760 | 24,950 | 31.7 |
| 170260 | Solid fructose | 10,536 | 12,544 | 2,008 | 19.1 |
| 230910 | Dog/cat food | 963,147 | 1,114,059 | 150,912 | 15.7 |
Source: Global Trade Tracker 1: Pre-CETA refers to 2016. Post-CETA refers to 2020. |
|||||
Ireland
Since the implementation of CETA, Canada's exports to Ireland have grown the fastest out of Canada's exports to its major EU markets. Canada's exports of various products to Ireland has led to an increase of Can$119.5 million or more than the tiplling of exports, with corn being the fastest growing export, followed by dried, shelled beans, oil cake, soybeans, and products of animal origin supporting growth. Mineral waters, forage plant seeds for sowing, and cold water shrimp are new exports to Ireland that are also supporting Canada's export growth.
| HS6 | Description | Pre-CETA[1] | Post-CETA[1] | Growth | Growth (%) |
|---|---|---|---|---|---|
| Total | 46,491,292 | 166,022,628 | 119,531,336 | 257.1 | |
| 220110 | Mineral waters | 2,687 | 2,687 | ||
| 100590 | Corn | 13,129,637 | 82,823,870 | 69,694,233 | 530.8 |
| 071339 | Dried, shelled beans | 16,804 | 104,077 | 87,273 | 519.4 |
| 120929 | Forage plant seeds for sowing | 91,535 | 91,535 | ||
| 230400 | Oilcake | 7,791,838 | 32,128,175 | 24,336,337 | 312.3 |
| 120190 | Soybeans | 1,594,173 | 4,969,245 | 3,375,072 | 211.7 |
| 051199 | Products of animal origin | 13,850 | 40,897 | 27,047 | 195.3 |
| 230330 | Brewing or distilling dregs | 8,315,153 | 22,757,311 | 14,442,158 | 173.7 |
| 030616 | Cold-water shrimps | 573,073 | 573,073 | ||
| 200520 | Processed potatoes | 6,804 | 17,642 | 10,838 | 159.3 |
| 180632 | Chocolate | 55,112 | 112,331 | 57,219 | 103.8 |
| 170220 | Maple sugar | 1,530,817 | 3,004,693 | 1,473,876 | 96.3 |
| 350300 | Gelatin | 4,322 | 8,404 | 4,082 | 94.4 |
| 200981 | Cranberry | 481,357 | 884,942 | 403,585 | 83.8 |
Source: Global Trade Tracker 1: Pre-CETA refers to 2016. Post-CETA refers to 2020. |
|||||
Estonia
Since the implementation of CETA, although comparatively small, Canada's exports to Estonia have nearly tripled, leading to an increase of Can$4.3 million or 196.2%, with active yeasts being the fastest growing export, followed by inactive yeasts, food preparations, mustard seeds, cold water shrimp supporting growth. Peptones, bovine semen, and liqueurs and cordials are new exports to Estonia that are also supporting Canada's export growth.
| HS6 | Description | Pre-CETA[1] | Post-CETA[1] | Growth | Growth (%) |
|---|---|---|---|---|---|
| Total | 2,184,263 | 6,469,508 | 4,285,245 | 196.2 | |
| 350400 | Peptones | 1,387,041 | 1,387,041 | ||
| 210210 | Active yeasts | 30,479 | 281,567 | 251,088 | 823.8 |
| 051110 | Bovine semen | 383,138 | 383,138 | ||
| 210220 | Inactive yeasts | 185,976 | 1,291,778 | 1,105,802 | 594.6 |
| 210690 | Food preparations, nowhere else specified | 268,180 | 982,803 | 714,623 | 266.5 |
| 220870 | Liqueurs and cordials | 54,822 | 54,822 | ||
| 120750 | Mustard seeds | 8,413 | 18,950 | 10,537 | 125.2 |
| 030616 | Cold-water shrimps | 387,138 | 808,870 | 421,732 | 108.9 |
| 151219 | Sunflower seed oil | 11,444 | 21,740 | 10,296 | 90.0 |
| 220830 | Whiskies | 85,572 | 147,805 | 62,233 | 72.7 |
| 200893 | Cranberries | 81,480 | 81,480 | ||
Source: Global Trade Tracker 1: Pre-CETA refers to 2016. Post-CETA refers to 2020. |
|||||
Austria
Since the implementation of CETA, although comparatively small, Canada's exports to Austria have nearly doubled, leading to an increase of Can$4.5 million or 156.5%, with active yeasts being the fastest growing export, followed by food preparations, frozen fruits and nuts, and forage plant seeds for sowing supporting growth. Vegetable seeds for sowing, fruit or vegetable juice, liqueurs and cordials, and inactive yeasts are new exports to Austria that are also supporting Canada's export growth.
| HS6 | Description | Pre-CETA[1] | Post-CETA[1] | Growth | Growth (%) |
|---|---|---|---|---|---|
| Total | 2,911,042 | 7,468,106 | 4,557,064 | 156.5 | |
| 120991 | Vegetable seeds, for sowing | 401,976 | 401,976 | ||
| 200989 | Fruit or vegetable juice | 1,111,031 | 1,111,031 | ||
| 210210 | Active yeasts | 145 | 31,124 | 30,979 | 21364.8 |
| 210690 | Food preparations, nowhere else specified. | 30,693 | 1,039,005 | 1,008,312 | 3285.2 |
| 220870 | Liqueurs and cordials | 35,880 | 35,880 | ||
| 010619 | Live mammals | 578,677 | 578,677 | ||
| 210220 | Inactive yeasts | 20,528 | 20,528 | ||
| 081190 | Frozen fruit and nuts | 586,509 | 1,770,177 | 1,183,668 | 201.8 |
| 120929 | Forage plant seeds for sowing | 72,215 | 151,610 | 79,395 | 109.9 |
| 170220 | Maple sugar | 298,840 | 438,092 | 139,252 | 46.6 |
Source: Global Trade Tracker 1: Pre-CETA refers to 2016. Post-CETA refers to 2020. |
|||||
Romania
Since the implementation of CETA, although comparatively small, Canada's exports to Romania have more than doubled, leading to an increase of Can$6.1 million or 114.0%, with frozen hake being the fastest growing export, followed by frozen pacific salmon, food preparations, and dog/cat food supporting growth. Vegetable based animal feed, lobsters, and mineral water are new exports to Romania that are also supporting Canada's export growth.
| HS6 | Description | Pre-CETA[1] | Post-CETA[1] | Growth | Growth (%) |
|---|---|---|---|---|---|
| Total | 5,379,093 | 11,511,738 | 6,132,645 | 114.0 | |
| 230800 | Vegetable based animal feed | 6,179 | 6,179 | ||
| 030632 | Lobsters | 250,500 | 250,500 | ||
| 030366 | Frozen hake | 975,762 | 4,709,401 | 3,733,639 | 382.6 |
| 030312 | Frozen pacific salmon | 47,998 | 139,300 | 91,302 | 190.2 |
| 220110 | Mineral water | 39,826 | 39,826 | ||
| 210690 | food preparations, nowhere else specified. | 1,552,802 | 3,203,794 | 1,650,992 | 106.3 |
| 230910 | Dog/cat food | 1,411,736 | 2,566,572 | 1,154,836 | 81.8 |
| 071340 | Dried lentils | 27,293 | 40,633 | 13,340 | 48.9 |
Source: Global Trade Tracker 1: Pre-CETA refers to 2016. Post-CETA refers to 2020. |
|||||
Canada's five largest European Union export markets
Italy
Since the implementation of CETA, broad-based increases of various products has led to an increase of Can$321.1 million or 51.7% growth in exports to Italy, with durum wheat (66.8%) soybeans (57.2%), and kidney beans (114.0%) supporting growth. Other products that saw strong export growth include cocoa butter, food preparations, lobster, frozen fruit and nuts, and dried, shelled peas. Exports of frozen lobster, furskins, and wheat meslin declined. Exports of cocoa butter and lobsters are new and have picked up since the implementation of CETA.
| HS6 | Description | Pre-CETA[1] | Post-CETA[1] | Growth | Growth (%) |
|---|---|---|---|---|---|
| Total | 620.7 | 941.8 | 321.1 | 51.7 | |
| 100119 | Durum wheat | 321.1 | 535.8 | 214.6 | 66.8 |
| 120190 | Soybeans | 103.8 | 163.1 | 59.4 | 57.2 |
| 100199 | Wheat and meslin | 49.0 | 46.5 | −2.5 | −5.1 |
| 180400 | Cocoa butter, fat and oil | 0.0 | 40.2 | 40.2 | |
| 071333 | Kidney beans | 13.9 | 29.6 | 15.8 | 114.0 |
| 071340 | Lentils | 22.8 | 25.2 | 2.5 | 10.9 |
| 071339 | Dried, shelled beans | 14.2 | 16.5 | 2.3 | 15.9 |
| 230910 | Dog or cat food | 8.1 | 11.8 | 3.8 | 47.1 |
| 410150 | Bovine hides and skins | 6.6 | 7.9 | 1.4 | 20.6 |
| 210690 | food preparations | 2.3 | 7.7 | 5.4 | 238.9 |
| 030632 | Lobster | 0.0 | 6.0 | 6.0 | |
| 030612 | Frozen lobster | 11.0 | 5.7 | −5.3 | −48.0 |
| 430180 | Furskins | 6.2 | 3.8 | −2.4 | −38.7 |
| 170220 | Maple sugar | 2.5 | 3.7 | 1.3 | 51.8 |
| 100830 | Canary seed | 3.9 | 3.6 | −0.3 | −7.0 |
| 071310 | Dried, shelled peas | 1.8 | 3.5 | 1.7 | 97.7 |
| 081190 | Frozen fruit and nuts | 1.6 | 3.4 | 1.8 | 111.3 |
| 051110 | Bovine semen | 1.9 | 3.2 | 1.3 | 65.4 |
| 020110 | Bovine carcases | 0.0 | 3.0 | 3.0 | |
| 020130 | Beef | 0.0 | 2.7 | 2.7 | |
Source: Global Trade Tracker 1: Pre-CETA refers to 2016. Post-CETA refers to 2020. |
|||||
France
Since the implementation of CETA, increases in exports of various products has led to an overall increase of Can$380.9 million or 77.5% growth in exports to France, with canola seeds (203.5%) maple products (71.9%), and frozen fruits and nuts (63.8%) supporting growth. Other products that saw strong export growth include beans, inedible food preparations, kidney beans, and cranberries. Exports of soybeans, frozen lobster, dog or cat food, and horse meat declined. Exports of scallops, lobsters, ethyl alcohol, and fertilized birds eggs are new and have picked up since the implementation of CETA.
| HS6 | Description | Pre-CETA[1] | Post-CETA[1] | Growth | Growth (%) |
|---|---|---|---|---|---|
| Total | 491.8 | 872.7 | 380.9 | 77.5 | |
| 120510 | Canola seeds | 209.3 | 635.2 | 426.0 | 203.5 |
| 030722 | Scallops | 0.0 | 27.0 | 27.0 | |
| 170220 | Maple products | 13.0 | 22.4 | 9.4 | 71.9 |
| 030632 | Lobster | 0.0 | 18.7 | 18.7 | |
| 120190 | Soybeans | 41.3 | 16.4 | −24.9 | −60.3 |
| 081190 | Frozen fruit and nuts | 9.2 | 15.1 | 5.9 | 63.8 |
| 030612 | Frozen lobsters | 16.7 | 10.5 | −6.2 | −37.0 |
| 230910 | Dog or cat food | 13.0 | 9.3 | −3.6 | −28.0 |
| 071339 | Beans | 3.8 | 9.0 | 5.2 | 134.6 |
| 230990 | Inedible food preparations | 4.4 | 9.0 | 4.6 | 104.2 |
| 220710 | Ethyl alcohol | 0.0 | 7.2 | 7.2 | |
| 020500 | Horse meat | 17.5 | 7.0 | −10.5 | −60.2 |
| 071340 | Lentils | 9.9 | 6.7 | −3.2 | −32.5 |
| 210690 | Food preparations | 14.3 | 6.5 | −7.8 | −54.7 |
| 100119 | Durum wheat | 17.2 | 6.4 | −10.8 | −62.8 |
| 030729 | Processed scallops | 22.7 | 6.0 | −16.7 | −73.4 |
| 220830 | Whiskies | 7.5 | 4.3 | −3.2 | −42.9 |
| 071333 | Kidney beans | 1.8 | 4.2 | 2.4 | 132.0 |
| 040719 | Fertilised birds' eggs for incubation | 0.0 | 2.9 | 2.9 | |
| 200893 | Cranberries | 1.9 | 2.9 | 1.0 | 52.8 |
Source: Global Trade Tracker 1: Pre-CETA refers to 2016. Post-CETA refers to 2020. |
|||||
Netherlands
Since the implementation of CETA, surging export growth in many products has led to an overall increase of Can$464.0 million or 121.8% in exports to Netherlands, with canola seeds, ethyl alcohol, and canola oil supporting growth. Other products that saw triple digit export growth include cranberries, food preparations, frozen fruit and nuts, cranberry juice, and fish fats and oils. Exports of soybeans, corn, bovine semen, and frozen lobster declined. Exports of ethyl alcohol, canola oil, lobsters, and frozen scallops are new and have picked up since the implementation of CETA.
| HS6 | Description | Pre-CETA[1] | Post-CETA[1] | Growth | Growth (%) |
|---|---|---|---|---|---|
| Total | 381.0 | 845.0 | 464.0 | 121.8 | |
| 120510 | Canola seeds | 0.0 | 261.7 | 261.7 | |
| 120190 | Soybeans | 156.9 | 150.5 | −6.4 | −4.1 |
| 220710 | Ethyl alcohol | 0.0 | 52.1 | 52.1 | |
| 151419 | Canola oil | 0.0 | 47.3 | 47.3 | |
| 200893 | Cranberries | 13.8 | 44.7 | 30.9 | 224.1 |
| 210690 | food preparations | 12.0 | 28.3 | 16.3 | 135.7 |
| 071420 | Sweet potatoes | 12.7 | 23.7 | 11.0 | 86.8 |
| 081190 | Frozen fruit and nuts | 7.1 | 23.6 | 16.5 | 232.0 |
| 100590 | Corn | 18.6 | 18.1 | −0.5 | −2.9 |
| 200981 | Cranberry juice | 3.7 | 17.3 | 13.6 | 368.7 |
| 230910 | Dog or cat food | 5.2 | 16.9 | 11.7 | 226.3 |
| 030632 | Lobster | 0.0 | 12.6 | 12.6 | |
| 150420 | Fish fats and oils | 1.7 | 12.0 | 10.2 | 597.2 |
| 051110 | Bovine semen | 10.6 | 9.4 | −1.2 | −11.3 |
| 130239 | Thickener | 7.4 | 8.0 | 0.6 | 8.5 |
| 020110 | Bovine carcases | 2.6 | 7.5 | 4.9 | 184.8 |
| 120921 | Alfalfa seed for sowing | 8.7 | 7.4 | −1.3 | −15.2 |
| 071340 | Lentils | 6.3 | 7.0 | 0.8 | 12.0 |
| 030722 | Frozen scallops | 0.0 | 6.5 | 6.5 | |
| 030612 | Frozen lobster | 11.2 | 6.1 | −5.1 | −45.4 |
Source: Global Trade Tracker 1: Pre-CETA refers to 2016. Post-CETA refers to 2020. |
|||||
Belgium
Since the implementation of CETA, strong export growth in commodities has led to an overall increase of Can$152.9.0 million or 37.2% in exports to Belgium, with soybeans (94.7%), canola seeds (173.8%), and linseed (76.9%) supporting growth. Other exports that saw strong growth include lobsters, frozen fruits and nuts, lentils, and dried, shelled peas. Exports of mustard seeds, frozen lobsters, canary seed, processed salmon, and maple sugar declined. Exports of lobsters and frozen scallops are new and have picked up since the implementation of CETA.
| HS6 | Description | Pre-CETA[1] | Post-CETA[1] | Growth | Growth (%) |
|---|---|---|---|---|---|
| Total | 411.3 | 564.2 | 152.9 | 37.2 | |
| 120190 | Soybeans | 68.8 | 134.0 | 65.2 | 94.7 |
| 120510 | Canola seeds | 41.6 | 113.9 | 72.3 | 173.8 |
| 120400 | Linseed | 58.9 | 104.3 | 45.3 | 76.9 |
| 100119 | Durum wheat | 68.5 | 66.7 | −1.8 | −2.6 |
| 030632 | Lobsters | 0.0 | 31.1 | 31.1 | |
| 120750 | Mustard seeds | 20.0 | 15.1 | −4.9 | −24.6 |
| 081190 | Frozen fruit and nuts | 11.6 | 13.7 | 2.1 | 18.1 |
| 030612 | Frozen lobsters | 19.8 | 12.4 | −7.4 | −37.3 |
| 071340 | Lentils | 8.6 | 9.2 | 0.6 | 6.7 |
| 100830 | Canary seed | 11.0 | 8.9 | −2.1 | −19.2 |
| 030722 | Frozen scallops | 0.0 | 7.2 | 7.2 | |
| 071310 | Dried, shelled peas | 0.2 | 5.7 | 5.5 | 2377.8 |
| 030192 | Live eels | 3.2 | 5.1 | 1.9 | 58.4 |
| 210220 | Inactive yeasts | 1.0 | 4.0 | 3.0 | 288.6 |
| 160411 | Processed salmon | 4.6 | 3.1 | −1.5 | −33.1 |
| 230910 | Dog or cat food | 5.0 | 2.7 | −2.3 | −46.5 |
| 071333 | Kidney beans | 1.0 | 2.5 | 1.5 | 143.4 |
| 170220 | Maple sugar | 3.1 | 2.5 | −0.6 | −20.0 |
| 030729 | Processed scallops | 2.3 | 2.1 | −0.2 | −8.8 |
| 071339 | Dried, shelled beans | 2.8 | 2.0 | −0.8 | −29.2 |
Source: Global Trade Tracker 1: Pre-CETA refers to 2016. Post-CETA refers to 2020. |
|||||
Germany
Since the implementation of CETA, strong export growth in commodities and processed products has led to an overall increase of Can$144.7 million or 41.6% in exports to Germany, with canola seeds (521.2%), maple sugar (25.8%), and frozen fruit and nuts (53.7%) supporting growth. Other exports that saw strong growth include plant based cosmetic, pharmaceutical products, processed cranberries, and live animals. Exports of soybeans, lentils, dog or cat food, vegetable saps and extracts, and frozen lobster declined. Exports of lobsters are new and have picked up since the implementation of CETA.
| HS6 | Description | Pre-CETA[1] | Post-CETA[1] | Growth | Growth (%) |
|---|---|---|---|---|---|
| Total | 347.8 | 492.6 | 144.7 | 41.6 | |
| 120510 | Canola seeds | 39.7 | 246.9 | 207.1 | 521.2 |
| 170220 | Maple sugar | 40.0 | 50.4 | 10.3 | 25.8 |
| 081190 | Frozen fruit and nuts | 31.4 | 48.3 | 16.9 | 53.7 |
| 120190 | Soybeans | 91.9 | 33.1 | −58.8 | −64.0 |
| 121190 | Plant based cosmetic, pharmaceutical products | 2.3 | 18.1 | 15.8 | 702.9 |
| 071340 | Lentils | 15.3 | 10.1 | −5.2 | −34.1 |
| 230910 | Dog or cat food | 10.0 | 6.4 | −3.6 | −36.2 |
| 200893 | Processed cranberries | 5.0 | 6.3 | 1.4 | 27.8 |
| 010690 | Live animals | 3.1 | 5.4 | 2.4 | 77.9 |
| 130219 | Vegetable saps and extracts | 6.3 | 4.0 | −2.2 | −35.3 |
| 350400 | Peptones | 0.0 | 3.8 | 3.8 | |
| 200811 | Processed groundnuts | 0.0 | 3.5 | 3.5 | |
| 330112 | Oils of sweet and bitter orange | 0.0 | 3.2 | 3.2 | |
| 051110 | Bovine semen | 2.8 | 3.0 | 0.2 | 6.7 |
| 200989 | Fruit/vegetable juice | 0.0 | 2.6 | 2.6 | |
| 200981 | Cranberry juice | 2.1 | 2.5 | 0.4 | 21.8 |
| 030612 | Frozen lobsters | 7.5 | 2.4 | −5.0 | −67.3 |
| 120929 | Seeds of forage plants for sowing | 2.8 | 2.4 | −0.4 | −13.8 |
| 071310 | Dried, shelled peas | 0.2 | 2.1 | 1.9 | 949.2 |
| 030632 | Lobster | 0.0 | 2.1 | 2.1 | |
Source: Global Trade Tracker 1: Pre-CETA refers to 2016. Post-CETA refers to 2020. |
|||||
Spain
Since the implementation of CETA, export performance has been mixed in commodities and processed products, which has led to an overall decline of Can$39.9 million or 12.8% in exports to Spain, with soybeans (−8.2%), corn (−68.5%), frozen lobster (−23.0%), and lentils (−71.5%) leading the decline. Exports that saw strong growth include durum wheat, lobster, dog or cat food, beans, and cranberries. Exports of soybeans, lentils, dog or cat food, vegetable saps and extracts, and frozen lobster declined. Exports of lobster, corn seed, ground nuts, and prepared fish fillets are new and have picked up since the implementation of CETA.
| HS6 | Description | Pre-CETA[1] | Post-CETA[1] | Growth | Growth (%) |
|---|---|---|---|---|---|
| Total | 311.1 | 271.1 | −39.9 | −12.8 | |
| 120190 | Soybeans | 91.7 | 84.2 | −7.5 | −8.2 |
| 100119 | Durum wheat | 0.0 | 30.7 | 30.7 | |
| 030632 | Lobster | 0.0 | 21.7 | 21.7 | |
| 100590 | Corn | 66.1 | 20.8 | −45.3 | −68.5 |
| 030612 | Frozen lobster | 26.6 | 20.5 | −6.1 | −23.0 |
| 230910 | Dog or cat food | 15.0 | 19.0 | 4.0 | 27.0 |
| 071340 | Lentils | 58.1 | 16.5 | −41.5 | −71.5 |
| 100830 | Canary seed | 7.4 | 6.8 | −0.5 | −7.4 |
| 071339 | Beans | 4.1 | 6.8 | 2.7 | 66.9 |
| 200893 | Cranberries | 0.1 | 6.6 | 6.5 | 4594.4 |
| 100510 | Corn seed for sowing | 0.0 | 5.6 | 5.6 | |
| 100199 | Wheat and meslin | 0.0 | 4.0 | 4.0 | |
| 071333 | Kidney beans | 1.5 | 3.0 | 1.5 | 102.1 |
| 051110 | Bovine semen | 2.1 | 2.3 | 0.2 | 7.4 |
| 210690 | Food preparations | 1.0 | 1.7 | 0.7 | 69.0 |
| 200811 | Groundnuts | 0.0 | 1.7 | 1.7 | |
| 030254 | Hake | 7.3 | 1.4 | −5.9 | −80.7 |
| 030532 | Prepared fish fillets | 0.0 | 1.2 | 1.2 | |
| 071310 | Dried, shelled peas | 4.7 | 1.0 | −3.6 | −78.0 |
| 090112 | Decaffeinated coffee | 0.0 | 0.9 | 0.9 | |
Source: Global Trade Tracker 1: Pre-CETA refers to 2016. Post-CETA refers to 2020. |
|||||
Export performance by province and territory
Eight out of the thirteen Canadian provinces and territories posted an increase in exports to the EU since CETA's implementation. The Northwest Territories led as its exports to the EU jumped six fold compared to pre-CETA, mainly due to stronger exports of fish and seafood. Saskatchewan (grains and oilseeds) and Alberta (pulses, fats and oils) also recorded strong exports growth. In contrast, exports to the EU from Nunavut fell by almost 90% (with a decline in animal based products and fish and seafood), New Brunswick (prepared vegetable, fruit and nut exports), Yukon (animal based products), and Prince Edward Island (grains and oilseeds).
| Province | Pre-CETA[1] | Post-CETA[1] | Growth | Growth (%) |
|---|---|---|---|---|
| Saskatchewan | 898.0 | 1,740.3 | 842.3 | 93.8 |
| Ontario | 830.0 | 820.2 | −9.8 | −1.2 |
| Alberta | 361.1 | 655.6 | 294.5 | 81.6 |
| Quebec | 443.4 | 635.5 | 192.1 | 43.3 |
| Nova Scotia | 221.7 | 326.4 | 104.7 | 47.2 |
| Manitoba | 144.4 | 274.8 | 130.5 | 90.4 |
| British Columbia | 63.3 | 67.9 | 4.7 | 7.4 |
| Newfoundland and Labrador | 65.1 | 56.0 | −9.1 | −14.0 |
| New Brunswick | 56.9 | 27.6 | −29.3 | −51.5 |
| Prince Edward Island | 27.6 | 19.8 | −7.8 | −28.2 |
| Yukon | 37,3347K | 235,013K | −0.1 | −37.1 |
| Northwest Territories | 5,125K | 36,000K | 30,875K | 602.4 |
| Nunavut | 61,924K | 6,500K | 55,424K | −89.5 |
| Total | 3,111.8 | 4,624.4 | 1,512.6 | 48.6 |
Source: Global Trade Tracker 1: Pre-CETA refers to 2016. Post-CETA refers to 2020. |
||||
Conclusion
For the four years since the implementation of CETA, Canadian agri-food and seafood exports to the EU have made impressive gains, rising 47.7%, with both commodity and value added exports reflected. Among EU member states, exports to France, Italy, and the Netherlands have increased the most, with canola seeds, durum wheat, cranberries, food preparations, and frozen fruits and nuts all in high demand. Exports of lobsters, cocoa butter, ethyl alcohol, and frozen scallops are new and have picked up post-CETA.
Among the fastest growing EU markets for Canadian agri-food and seafood exports, exports to Latvia and Ireland have close to tripled in the four years since the implementation of CETA. Exports of active and inactive yeasts, food preparations, whiskies, cold water shrimp, and cranberries to these markets have all increased substantially or exponentially. Exports of cranberries, cold water shrimp, solid sugar, and mineral water are new to these markets and have substantially picked up post-CETA.
Exports to the EU from the Northwest Territories have grown the fastest, by 602.4%, followed by Saskatchewan (93.8%), Manitoba (90.4%), Alberta (81.6%), Nova Scotia (47.2%), and Quebec (43.3%). Exports to the EU from Nunavut, New Brunswick, Yukon, Prince Edward Island, Newfoundland and Labrador, and Ontario have all declined.
For more information
The Canadian Trade Commissioner Service:
International Trade Commissioners can provide Canadian industry with on-the-ground expertise regarding market potential, current conditions and local business contacts, and are an excellent point of contact for export advice.
More agri-food market intelligence:
International agri-food market intelligence
Discover global agriculture and food opportunities, the complete library of Global Analysis reports, market trends and forecasts, and information on Canada's free trade agreements.
Agri-food market intelligence service
Canadian agri-food and seafood businesses can take advantage of a customized service of reports and analysis, and join our email subscription service to have the latest reports delivered directly to their inbox.
More on Canada's agriculture and agri-food sectors:
Canada's agriculture sectors
Information on the agriculture industry by sector. Data on international markets. Initiatives to support awareness of the industry in Canada. How the department engages with the industry.
Resources
- Global Trade Tracker, 2021
Canada's export performance to the European Union
Global Analysis Report
Prepared by: Kris Clipsham, Market Analyst
© Her Majesty the Queen in Right of Canada, represented by the Minister of Agriculture and Agri-Food (2022).
Photo credits
All photographs reproduced in this publication are used by permission of the rights holders.
All images, unless otherwise noted, are copyright Her Majesty the Queen in Right of Canada.
To join our distribution list or to suggest additional report topics or markets, please contact:
Agriculture and Agri-Food Canada, Global Analysis1341 Baseline Rd, Tower 5, 3rd floor
Ottawa ON K1A 0C5
Canada
Email: aafc.mas-sam.aac@agr.gc.ca
The Government of Canada has prepared this report based on primary and secondary sources of information. Although every effort has been made to ensure that the information is accurate, Agriculture and Agri-Food Canada (AAFC) assumes no liability for any actions taken based on the information contained herein.
Reproduction or redistribution of this document, in whole or in part, must include acknowledgement of agriculture and agri-food Canada as the owner of the copyright in the document, through a reference citing AAFC, the title of the document and the year. Where the reproduction or redistribution includes data from this document, it must also include an acknowledgement of the specific data source(s), as noted in this document.
Agriculture and Agri-Food Canada provides this document and other report services to agriculture and food industry clients free of charge.