

Note: This report includes forecasting data that is based on baseline historical data.
Market snapshot
The global market for cranberries has experienced positive value growth with a moderate compound annual growth rate (CAGR) of 11.0% as imports increased from US$4.2 billion, 789.6 million kilograms in 2018 to US$6.3 billion, 1,147.7 million kilograms in 2022.
India was the thirty-fourth largest (after Latvia and Finland) global market for cranberries with imports of US$14.9 million (0.2% market share), 2.9 million kilograms in 2022, increasing significantly in CAGR by 43.4% from US$3.5 million, 1.0 million kilograms in 2018.
India is a net importer of cranberries. In 2022, India imported US$14.9 million and exported US$95,954 of cranberries, recording a trade deficit of US$14.8 million. The top three suppliers of cranberries to India were the United States (U.S) with values of US$8.8 million (59.1% market share), followed by the Netherlands with values of US$3.3 million (21.9% market share), and Peru with values of US$1.1 million (7.4% market share), in 2022.
Canada was India's fifth largest supplier of cranberries providing US$391,731 (2.6% market share), 76,533 kilograms in 2022, representing a decline in CAGR of 4.8% from US$476,278 in 2018. Of note, Canada has recently recovered and increased in growth (35.4%) from US$391,731 in 2022 to US$530,237 year-to-date (October 2023).
Prepared or preserved cranberries was the largest cranberry segment Canada exported to India with values of US$295,290 (78.7% market share), 58,602 kilograms, in 2022.
According to Mintel's Global New Products Database (GNPD), there were 649 cranberry-containing products (excluding 11 health/supplement category products) launched in India from January 2018 to December 2023. Most of the launches (86.7%) were in the food category (563 products), followed by the drink category (56 products) and the remaining (30 products) were in the pet category.
The food category launched 563 products containing cranberries. The predominant (food) sub-categories of cranberry-containing products were snack mixes (146 products), fruit snacks (113 products), cold cereals (110 products), snack/cereal/energy bars (78 products) and sweet biscuits/cookies (40 products), representing a combined market share of 86.5% of the food products released.
Global trade overview of cranberry imports
The global market for cranberries has experienced positive value growth with a moderate compound annual growth rate (CAGR) of 11.0% as imports increased from US$4.2 billion, 789.6 million kilograms in 2018 to US$6.3 billion, 1,147.7 million kilograms in 2022. The United States (U.S) was the largest global market for cranberries in 2022 with imports valued at US$2.0 billion (31.8% market share), 354.7 million kilograms, representing a substantial increase in CAGR of 11.5% from US$1.3 billion, 260.7 million kilograms in 2018, followed by the Netherlands with imports valued at US$937.3 million (14.8% market share), 181.3 million kilograms, representing a substantial increase in CAGR of 19.0% from US$467.9 million, 82.1 million kilograms in 2018 and Germany, with import values of US$501.4 million (7.9% market share), 90.5 million kilograms, in 2022.
India was the thirty-fourth largest (after Latvia and Finland) global market for cranberries with imports of US$14.9 million (0.2% market share), 2.9 million kilograms in 2022, increasing significantly in CAGR by 43.4% from US$3.5 million, 1.0 million kilograms in 2018. Canada in comparison, was the fifth largest global market for cranberries with import values of US$356.1 million (5.6% market share), 68.0 million kilograms in 2022, representing a moderate increase in CAGR of 8.7% from imports of US$254.7 million, (51.5 million kilograms) in 2018.
| Country | 2018 | 2019 | 2020 | 2021 | 2022 | CAGR* % 2018-2022 | Market share % in 2022 | 2023 (January to November) |
|---|---|---|---|---|---|---|---|---|
| World total | 4,159.1 | 4,762.3 | 5,234.9 | 6,133.7 | 6,319.0 | 11.0 | 100.0 | 5,699.7 |
| United States | 1,297.6 | 1,406.2 | 1,418.5 | 1,800.0 | 2,008.2 | 11.5 | 31.8 | 1,793.0 |
| Netherlands | 467.9 | 648.4 | 823.8 | 892.2 | 937.3 | 19.0 | 14.8 | 738.0 |
| Germany | 368.4 | 448.5 | 540.5 | 541.7 | 501.4 | 8.0 | 7.9 | 505.7 |
| United Kingdom | 401.5 | 416.5 | 410.7 | 473.7 | 418.5 | 1.0 | 6.6 | 407.8 |
| Canada (5) | 254.7 | 287.0 | 279.3 | 344.5 | 356.1 | 8.7 | 5.6 | 322.1 |
| China | 190.2 | 257.8 | 250.6 | 267.3 | 355.3 | 16.9 | 5.6 | 260.2 |
| Spain | 139.0 | 144.0 | 188.9 | 231.2 | 250.6 | 15.9 | 4.0 | 228.4 (January to October) |
| Poland | 81.0 | 96.8 | 129.4 | 154.1 | 172.7 | 20.8 | 2.7 | 164.3 (January to October) |
| Hong Kong | 77.7 | 94.0 | 114.1 | 167.2 | 154.2 | 18.7 | 2.4 | 97.9 |
| France | 83.9 | 93.2 | 87.6 | 114.0 | 101.5 | 4.9 | 1.6 | 123.7 |
| India (34) | 3.5 | 5.2 | 4.6 | 7.6 | 14.9 | 43.4 | 0.2 | 12.5 (January to October) |
|
Source: Global Trade Tracker, 2024 1: For the purpose of this report, cranberry/cranberries are defined using HS code 081040 (fresh cranberries, bilberries), 200893 (prepared or preserved cranberries) and 200981 (cranberry or lingonberry juice, unfermented) *CAGR: Compound Annual Growth Rate |
||||||||
| Country | 2018 | 2019 | 2020 | 2021 | 2022 | CAGR* % 2018-2022 | Market share % in 2022 | 2023 (January to November) |
|---|---|---|---|---|---|---|---|---|
| World total | 789.6 | 896.4 | 966.8 | 1,064.5 | 1,147.7 | 9.8 | 100.0 | 914.8 |
| United States | 260.7 | 256.6 | 277.8 | 318.1 | 354.7 | 8.0 | 30.9 | 285.9 |
| Netherlands | 82.1 | 114.1 | 136.6 | 150.0 | 181.3 | 21.9 | 15.8 | 118.8 |
| Germany | 60.2 | 83.3 | 88.3 | 85.0 | 90.5 | 10.8 | 7.9 | 74.4 |
| United Kingdom | 61.2 | 65.1 | 64.7 | 76.9 | 83.7 | 8.2 | 7.3 | 68.2 |
| Canada | 51.5 | 72.1 | 63.0 | 80.3 | 68.0 | 7.2 | 5.9 | 65.3 |
| China | 36.5 | 46.4 | 44.6 | 46.8 | 56.3 | 11.4 | 4.9 | 40.7 |
| Spain | 20.8 | 23.8 | 35.2 | 39.3 | 49.2 | 24.0 | 4.3 | 40.9 (January to October) |
| Poland | 19.5 | 19.9 | 23.7 | 28.0 | 33.6 | 14.6 | 2.9 | 28.6 (January to October) |
| Hong Kong | 14.3 | 17.9 | 19.0 | 27.5 | 25.6 | 15.6 | 2.2 | 13.6 |
| France | 15.0 | 17.8 | 16.0 | 18.1 | 18.9 | 6.0 | 1.6 | 22.9 |
| India (34) | 1.0 | 1.3 | 1.1 | 1.9 | 2.9 | 30.8 | 0.2 | 2.6 (January to October) |
|
Source: Global Trade Tracker, 2024 *CAGR: Compound Annual Growth Rate |
||||||||
India: trade overview of cranberry imports
India is a net importer of cranberries. In 2022, India imported US$14.9 million and exported US$95,954 of cranberries, recording a trade deficit of US$14.8 million. The top three suppliers of cranberries to India were the United States (U.S) with values of US$8.8 million (59.1% market share), 1.9 million kilograms, followed by the Netherlands with values of US$3.3 million (21.9% market share), 624,263 kilograms, and Peru with values of US$1.1 million (7.4% market share), 132,279 kilograms in 2022. Of these suppliers, the Netherlands experienced significant increases in annual growth (713.6%) while Peru also experienced substantial growth (840.1%) from US$117,318 in 2021 (+53.3% from US$1.1 million in 2022 to US$1.7 million year-to-date, October 2023).
Canada was India's fifth largest supplier of cranberries providing US$391,731 (2.6% market share), 76,533 kilograms in 2022, representing a decline in CAGR of 4.8% from US$476,278 in 2018. Of note, Canada has recently recovered and increased in growth (35.4%) from US$391,731 in 2022 to US$530,237 year-to-date (October 2023). Of note, the Government of India has recently issued a gazette notification advising acceptance of recommendations from the Ministry of Commerce & Industry to reduce import duties levied on blueberries and cranberries-fresh, frozen and dried, to 10.0% (from the previous 30.0% rate) while cranberries-prepared or preserved, now have an import duty rate of 5.0%, effective February 20th, 2024 (Business Today India).
| Country | 2018 | 2019 | 2020 | 2021 | 2022 | CAGR* % 2018-2022 | Market share % in 2022 | 2023 (January to October) |
|---|---|---|---|---|---|---|---|---|
| World total | 3,520,597 | 5,164,075 | 4,635,531 | 7,631,098 | 14,886,790 | 43.4 | 100.0 | 12,524,784 |
| United States | 2,032,954 | 3,856,207 | 2,709,044 | 4,991,235 | 8,803,702 | 44.3 | 59.1 | 6,829,880 |
| Netherlands | 6,054 | 57,774 | 900,050 | 3,260,367 | 713.6 (2019-2022) | 21.9 | 1,860,797 | |
| Peru | 117,318 | 1,102,918 | 840.1 (2021-2022) | 7.4 | 1,691,189 | |||
| Chile | 644,532 | 633,279 | 1,598,525 | 1,045,052 | 1,089,858 | 14.0 | 7.3 | 1,063,921 |
| Canada (5) | 476,278 | 545,683 | 241,495 | 552,009 | 391,731 | −4.8 | 2.6 | 530,237 |
| Belgium | 12,641 | 15,337 | 19,775 | 27 | 83,107 | 60.1 | 0.6 | 196,221 |
| Namibia | 55,210 | N/C | 0.4 | 35,429 | ||||
| Israel | 4,644 | 4,488 | 38,345 | 102.1 (2019-2022) | 0.3 | |||
| Georgia | 15,286 | N/C | 0.1 | 10,365 | ||||
| Zimbabwe | 14,837 | N/C | 0.1 | 95,568 | ||||
|
Source: Global Trade Tracker, 2024 *CAGR: Compound Annual Growth Rate N/C: not calculable |
||||||||
| Country | 2018 | 2019 | 2020 | 2021 | 2022 | CAGR* % 2018-2022 | Market share % in 2022 | 2023 (January to October) |
|---|---|---|---|---|---|---|---|---|
| World total | 979,348 | 1,288,370 | 1,068,247 | 1,888,946 | 2,868,966 | 30.8 | 100.0 | 2,592,531 |
| United States | 486,283 | 931,531 | 648,956 | 1,309,327 | 1,850,814 | 39.7 | 64.5 | 1,683,174 |
| Netherlands | 536 | 12,199 | 235,713 | 624,263 | 952.1 (2019-2022) | 21.8 | 363,065 | |
| Peru | 11,880 | 132,279 | 1,013.5 (2021-2022) | 4.6 | 220,825 | |||
| Chile | 152,763 | 119,172 | 336,453 | 165,281 | 138,187 | −2.5 | 4.8 | 137,892 |
| Canada (5) | 118,373 | 127,372 | 54,189 | 147,718 | 76,533 | −10.3 | 2.7 | 106,827 |
| Belgium | 2,328 | 2,792 | 2,757 | 2 | 12,362 | 51.8 | 0.4 | 8,061 |
| Namibia | 7,011 | N/C | 0.2 | 5,355 | ||||
| Israel | 1,750 | 800 | 6,400 | 54.1 (2019-2022) | 0.2 | |||
| Georgia | 1,800 | N/C | 0.1 | 1,092 | ||||
| Zimbabwe | 2,520 | N/C | 0.1 | 13,680 | ||||
|
Source: Global Trade Tracker, 2024 *CAGR: Compound Annual Growth Rate N/C: not calculable |
||||||||
India's cranberry imports from Canada
India was the thirty-fourth largest global market for cranberries with imports of US$14.9 million (0.2% market share), 2.9 million kilograms in 2022. Of these imports, Canada was the fifth largest supplier to India (representing a 2.6% market share) with imports valued at US$391,731 (−4.8% from US$476,278 in 2018), 76,533 kilograms in 2022.
| HS Code | Description | Import value (US$) | Import volume (kg) | Market value share % |
|---|---|---|---|---|
| Cranberry (Total) | 391,731 | 76,533 | 100.0 | |
| 200893 | cranberries, prepared or preserved | 344,104 | 69,628 | 87.8 |
| 081040 | fresh cranberries, bilberries | 30,869 | 2,880 | 7.9 |
| 200981 | cranberry or lingonberry juice, unfermented | 16,758 | 4,025 | 4.3 |
| Source: Global Trade Tracker, 2024 | ||||
| Category | 2018 | 2019 | 2020 | 2021 | 2022 | CAGR* % 2018-2022 |
|---|---|---|---|---|---|---|
| India imports from the World | 3,520,597 | 5,164,075 | 4,635,531 | 7,631,098 | 14,886,790 | 43.4 |
| India imports from Canada | 476,278 | 545,683 | 241,495 | 552,009 | 391,731 | −4.8 |
| Supply gap | 3,044,319 | 4,618,392 | 4,394,036 | 7,079,089 | 14,495,059 | 47.7 |
|
Source: Global Trade Tracker, 2024 *CAGR: Compound Annual Growth Rate |
||||||
Canada's performance
Canada's export market
Canada, unlike India, is a net exporter of cranberries. In 2022, Canada enjoyed a cranberry trade surplus of US$14.6 million with imports of US$356.1 million, and exports valued at US$370.7 million (+6.6% from exports of US$287.2 million in 2018). Of interest, Canada was the sixth largest (after the U.S) global exporter of cranberries in 2022.
The U.S was the largest market for Canadian cranberry exports with values of US$258.8 million (69.8% market share), 83.4 million kilograms, followed by the Netherlands with values of US$66.1 million (17.8% market share), 13.3 million kilograms and China with values of US$7.1 million (1.9% market share), 1.8 million kilograms in 2022. India in comparison, was the twenty-fourth largest export market for Canadian cranberries with values of US$375,101 (0.1% market share), 77,653 kilograms in 2022.
| Country | Export value (US$ M) | Export volume (kg) | Market value share % in 2022 |
|---|---|---|---|
| Global total | 370,653,481 | 106,293,227 | 100.0 |
| United States | 258,847,742 | 83,390,228 | 69.8 |
| Netherlands | 66,116,053 | 13,268,638 | 17.8 |
| China | 7,063,585 | 1,783,521 | 1.9 |
| United Kingdom | 5,586,490 | 1,424,539 | 1.5 |
| Germany | 5,387,057 | 904,117 | 1.5 |
| Spain | 3,914,730 | 826,582 | 1.1 |
| Croatia | 3,356,728 | 747,155 | 0.9 |
| Poland | 3,089,860 | 889,582 | 0.8 |
| France | 3,000,306 | 519,532 | 0.8 |
| Australia | 1,725,908 | 350,903 | 0.5 |
| India (24) | 375,101 | 77,653 | 0.1 |
| Source: Global Trade Tracker, 2024 | |||
The province of Québec was predominant in supplying cranberries to India, occupying an 82.7% market share, followed by British Columbia with the remaining 17.4% market share in 2022. Prepared or preserved cranberries (HS code: 200893) was the largest cranberry segment exported to India with values of US$295,290 (78.7% market share), 58,602 kilograms, followed by fresh cranberries (HS code 081040) with values of US$65,098 (17.4% market share), 19,051 kilograms and cranberry or lingonberry juice (HS code 200981) with values of US$14,712 (3.9% market share), 3600 L in 2022.
| HS Code | Description | Export value (US$) | Export volume (kg) | Top provincial suppliers and market value share | |
|---|---|---|---|---|---|
| Cranberry total | 375,101 | 77,653 | Québec: 82.7 | British Columbia: 17.4 | |
| 200893 | cranberries, prepared or preserved | 295,290 | 58,602 | Quebec: 100.0 | |
| 081040 | fresh cranberries, bilberries | 65,098 | 19,051 | British Columbia: 100.0 | |
| 200981 | cranberry or lingonberry juice, unfermented | 14,712 | 3,600 litres | Quebec: 100.0 | |
| Source: Global Trade Tracker, 2024 | |||||
In addition to the exports of cranberry products, more cranberries were exported as ingredients to several product lines including juices, pet food, snacks and several bakery and cereal products. There is therefore an important additional value for the sector as an ingredient especially in products with health related claims. The products launches below indicate just how significant the secondary market for cranberries has been from 2018 to 2023.
Cranberry product launch analysis
According to Mintel's Global New Products Database (GNPD), there were 649 cranberry-containing products (excluding 11 health/supplement category products) launched in India from January 2018 to December 2023. Most of the launches (86.7%) were in the food category (563 products), followed by the drink category (56 products) and the remaining (30 products) were in the pet category.
The number of yearly new product launches has increased in growth by a CAGR of 7.2% from a launch of 109 cranberry-containing products in 2018 to its most recent launch of 154 cranberry-containing products in 2023 (+55.6% annually from 99 cranberry-containing products in 2022).
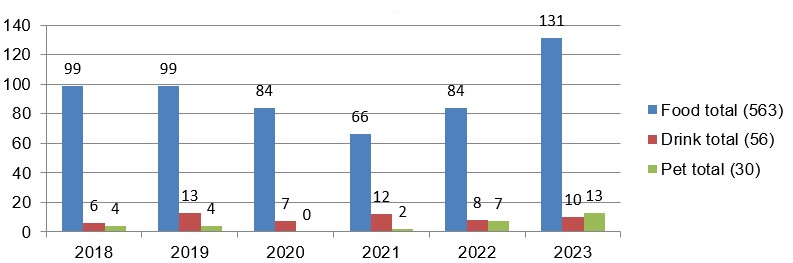
Description of above image
| Category | 2018 | 2019 | 2020 | 2021 | 2022 | 2023 |
|---|---|---|---|---|---|---|
| Food total | 99 | 99 | 84 | 66 | 84 | 131 |
| Drink total | 6 | 13 | 7 | 12 | 8 | 10 |
| Pet total | 4 | 4 | 0 | 2 | 7 | 13 |
Source: Mintel 2024
India is a dynamic market for cranberry-containing products. During the review period (2018 to 2023), India was the eighth-largest global market for product launches of food, drink and pet category cranberry-containing products (649). Of these products, as noted, the food category released the most (563) products, representing 86.7% of all cranberry-containing (ingredient) products (649) launched in India.
The predominant (food) sub-categories of cranberry-containing products were snack mixes (146 products), fruit snacks (113 products), cold cereals (110 products), snack/cereal/energy bars (78 products) and sweet biscuits/cookies (40 products), representing a combined market share of 86.5% of the food products released.
In the drink category, top sub-categories of cranberry-containing products released were fruit/flavoured still drinks (15 products), beverage concentrates and nutritional & meal replacement drinks (11 products respectively) representing a combined 66.1% of the drink category product share, while the top pet sub-categories products released were dog food, dry (15 products), cat food, dry (11 products) and dog snacks and treats (2 products), representing a combined 93.3% of the pet category product share.
Of interest, fruit/flavoured still drinks product launches experienced the greatest increase in annual growth (400.0%) from 2018 to 2019, and has since stabilized, while from 2022 to 2023, dry dog food has increased by 250.0% from 2 to 7 cranberry-containing products released.
| Sub-category | Number of new products by year | Total | |||||
|---|---|---|---|---|---|---|---|
| 2018 | 2019 | 2020 | 2021 | 2022 | 2023 | ||
| Food category | 563 | ||||||
| Snack mixes | 24 | 25 | 17 | 13 | 21 | 46 | 146 |
| Fruit Snacks | 22 | 22 | 16 | 8 | 18 | 27 | 113 |
| Cold cereals | 12 | 12 | 17 | 18 | 23 | 28 | 110 |
| Snack/cereal/energy bars | 19 | 14 | 12 | 11 | 12 | 10 | 78 |
| Sweet biscuits/cookies | 9 | 11 | 7 | 7 | 2 | 4 | 40 |
| Drink category | 56 | ||||||
| Fruit/flavoured still drinks | 1 | 5 | 1 | 2 | 3 | 3 | 15 |
| Beverage concentrates | 1 | 1 | 2 | 2 | 2 | 3 | 11 |
| Nutritional and meal replacement drinks | 0 | 0 | 0 | 8 | 1 | 2 | 11 |
| Pet category | 30 | ||||||
| Dog food dry | 4 | 2 | 0 | 0 | 2 | 7 | 15 |
| Cat food dry | 0 | 2 | 0 | 1 | 3 | 5 | 11 |
| Dog snacks and treats | 0 | 0 | 0 | 0 | 1 | 1 | 2 |
| Source: Mintel Global New Product Database (GNPD), 2024 | |||||||
Top cranberry ingredients launched in the food category were primarily cranberry (560 products), followed by cranberry juice concentrate (2 products) and cranberry powder (1 product). Similarly, top drink ingredients were cranberry juice concentrate (29 products), cranberry juice and cranberry (11 products, respectively), while pet products listed cranberry (28 products), cranberry powder and extract (1 product each) as main ingredients. Of interest, cranberry juice concentrate (drink ingredients) product launches experienced the greatest increase in annual growth (166.7%) from 3 to 8 products between 2018 to 2019 and has since declined by 50.0% from 6 to 3 product launches between 2022 to 2023, while recently from 2021 to 2022, cranberry (pet ingredients) has increased by 250.0% from 2 to 7 (+71.4% to 12 products in 2023) products released.
| Ingredient | Number of new products by year | Total | |||||
|---|---|---|---|---|---|---|---|
| 2018 | 2019 | 2020 | 2021 | 2022 | 2023 | ||
| Food ingredients | 563 | ||||||
| Cranberry | 99 | 97 | 83 | 66 | 84 | 131 | 560 |
| Cranberry juice concentrate | 0 | 1 | 1 | 0 | 0 | 0 | 2 |
| Cranberry powder | 0 | 1 | 0 | 0 | 0 | 0 | 1 |
| Drink ingredients | 56 | ||||||
| Cranberry juice concentrate | 3 | 8 | 6 | 3 | 6 | 3 | 29 |
| Cranberry juice | 1 | 5 | 2 | 2 | 0 | 1 | 11 |
| Cranberry | 3 | 3 | 0 | 3 | 1 | 1 | 11 |
| Pet ingredients | 30 | ||||||
| Cranberry | 4 | 3 | 0 | 2 | 7 | 12 | 28 |
| Cranberry powder | 0 | 1 | 0 | 0 | 0 | 0 | 1 |
| Cranberry extract | 0 | 0 | 0 | 0 | 0 | 1 | 1 |
|
Source: Mintel Global New Product Database (GNPD), 2024 Cranberry: searched as 'cranberry and all children' as an ingredient and defined in Mintel (Global New Product Database-GNPD, 2024) |
|||||||
Retail market of select (food) subcategories that may contain cranberry
As there is no specific data available regarding the retail market size of cranberry-containing products (applicable to recent Mintel GNPD launches within the food (as the largest) category in India), the below table (source; Euromonitor International; Packaged Food) represents select (food) subcategories that may contain cranberries (and all children) as a product ingredient, as searched in Mintel (Global New Product Database-GNPD, 2024). The below selected (food) subcategories represent a combined retail market share of 48.4% of the packaged food snack category (US$20.1 billion in 2023), with the exception of the flakes, and the muesli and granola food subcategories, which occupy a combined retail market share of 1.8% of the packaged staple food category (US$19.1 billion in 2023) in India, as defined in Euromonitor International.
The top food subcategories, in terms of retail value sales in 2023, that may contain cranberries were chocolate confectionery with retail sales of US$2,429.8 million, increasing in CAGR by 11.9% from US$1,382.6 million in 2018, followed by plain biscuits with values of US$2,360.8 million representing an annual increase of 6.2% from US$1,749.6 million in 2018 and cookies, with values of US$2,083.9 million in 2023, increasing in CAGR by 12.0% from US$1,183.8 million in 2018. Of interest, cereal bars experienced the greatest performance within the historic period, as retail sales of the sub-category grew 20.5% from US$5.6 million in 2018 to US$14.2 million in 2023.
Growth in all of the food subcategories is expected to remain positive, ranging from 6.5% (plain biscuits) to 16.5% (cereal bars) in the forecast period.
| Sub-category | 2018 | 2023 | CAGR* % 2018-2023 | 2024 | 2028 | CAGR* % 2023-2028 |
|---|---|---|---|---|---|---|
| Flakes | 144.0 | 262.2 | 12.7 | 298.1 | 463.6 | 12.1 |
| Muesli and Granola | 38.6 | 78.3 | 15.2 | 91.9 | 161.6 | 15.6 |
| Chocolate Confectionery | 1,382.6 | 2,429.8 | 11.9 | 2,720.4 | 4,018.4 | 10.6 |
| Nuts, Seeds and Trail Mixes | 313.1 | 558.3 | 12.3 | 623.1 | 924.5 | 10.6 |
| Dried Fruit | 452.3 | 758.0 | 10.9 | 832.4 | 1,152.4 | 8.7 |
| Cereal Bars | 5.6 | 14.2 | 20.5 | 16.7 | 30.5 | 16.5 |
| Fruit and Nut Bars | N/C | N/C | ||||
| Cookies | 1,183.8 | 2,083.9 | 12.0 | 2,275.8 | 3,107.4 | 8.3 |
| Filled Biscuits | 821.5 | 1,399.4 | 11.2 | 1,580.7 | 2,460.5 | 11.9 |
| Plain Biscuits | 1,749.6 | 2,360.8 | 6.2 | 2,528.9 | 3,234.7 | 6.5 |
| Wafers | 48.8 | 91.2 | 13.3 | 98.3 | 129.2 | 7.2 |
|
Source: Euromonitor International, 2023 1: Food sub-categories (as defined in Euromonitor International) that may contain cranberry fruit (dried or preserved, pastes and/or extracts, fruit nugget, fruit pieces, fruit flavoured) *CAGR: Compound Annual Growth Rate N/C: not calculable |
||||||
Top flavours of cranberry-containing food products noted were cranberry (110 products), berry (53 products), fruit & nut (36 products), almond and cranberry (17 products) and fruit & nut & seed (16 products). Of the drink category product releases, cranberry, berry and chocolate were identified as main flavours, representing a combined market share of 44.6%, while chicken, unflavoured/plain and carrot & cranberry were main flavours, occupying a combined market share of 26.6% of the pet category products launched.
Of note, fruit & nut (food flavour) product launches experienced the greatest increase in annual growth (233.3%) from 3 to 10 products between 2018 to 2019 and has further increased by 266.7% from 3 to 11 product launches between 2022 to 2023, while cranberry (drink flavour) increased by 150.0% from 2 to 5 products released between 2018 to 2019 (+50.0% from 2 to 3 products launched between 2022 to 2023).
| Flavour | Number of new products by year | Total | |||||
|---|---|---|---|---|---|---|---|
| 2018 | 2019 | 2020 | 2021 | 2022 | 2023 | ||
| Food flavours | 563 | ||||||
| Cranberry | 22 | 22 | 22 | 9 | 15 | 20 | 110 |
| Berry | 8 | 8 | 9 | 5 | 11 | 12 | 53 |
| Fruit and nut | 3 | 10 | 4 | 5 | 3 | 11 | 36 |
| Almond and cranberry | 4 | 5 | 0 | 1 | 3 | 4 | 17 |
| Fruit and nut and seed | 3 | 2 | 4 | 3 | 1 | 3 | 16 |
| Drink flavours | 56 | ||||||
| Cranberry | 2 | 5 | 2 | 0 | 2 | 3 | 14 |
| Berry | 0 | 2 | 2 | 1 | 1 | 1 | 7 |
| Chocolate | 0 | 0 | 0 | 3 | 1 | 0 | 4 |
| Pet flavours | 30 | ||||||
| Chicken | 0 | 0 | 0 | 1 | 3 | 0 | 4 |
| Unflavoured/plain | 1 | 0 | 0 | 0 | 0 | 1 | 2 |
| Carrot and cranberry | 1 | 1 | 0 | 0 | 0 | 0 | 2 |
| Source: Mintel Global New Product Database (GNPD), 2024 | |||||||
The most popular food product claims were vegetarian (553 products), followed by social media with (229 products) and no additives/preservatives with (198 products), likewise top drink claims were also vegetarian and no additives/preservatives, with the addition of ease of use, as a product claim. In the pet category, popular product claims were low/no/reduced allergen (23 products), followed by vitamin/mineral fortified (22 products) and functional pet - skin and coat (21 products).
In the food category, all top claims (vegetarian, social media and no additives/preservatives), have recently experienced positive increases in annual growth (60.5%, 68.6% and 76.9% respectively) between 2022 to 2023, while pet claims, low/no/reduced allergen and functional pet - skin & coat in particular, previously experienced declines in annual growth (50.0% and 25.0% respectively) between 2018 to 2019, however both claims have since recovered, and have experienced greater recent growth (83.3% and 125.0% respectively) between 2022 and 2023.
| Claims | Number of new products by year | Total | |||||
|---|---|---|---|---|---|---|---|
| 2018 | 2019 | 2020 | 2021 | 2022 | 2023 | ||
| Food claims | 563 | ||||||
| Vegetarian | 97 | 97 | 84 | 64 | 81 | 130 | 553 |
| Social media | 35 | 41 | 29 | 30 | 35 | 59 | 229 |
| No additives/preservatives | 26 | 32 | 34 | 34 | 26 | 46 | 198 |
| Drink claims | 56 | ||||||
| Vegetarian | 6 | 10 | 5 | 12 | 8 | 9 | 50 |
| No additives/preservatives | 4 | 9 | 6 | 6 | 6 | 5 | 36 |
| Ease of use | 4 | 4 | 3 | 3 | 5 | 6 | 25 |
| Pet claims | 30 | ||||||
| Low/no/reduced allergen | 4 | 2 | 0 | 0 | 6 | 11 | 23 |
| Vitamin/mineral fortified | 4 | 4 | 0 | 1 | 6 | 7 | 22 |
| Functional pet - skin and coat | 4 | 3 | 0 | 1 | 4 | 9 | 21 |
| Source: Mintel Global New Product Database (GNPD), 2024 | |||||||
The companies with the highest number of new cranberry-containing (food) product launches in the review period were SproutLife Foods Private (Top Brand; Yoga Bar) with 33 products, followed by HW Wellness Solutions (Top Brand; True Elements) with 18 products, Naturell (Top Brands; RiteBite Max Protein, and RiteBite) with 17 products, Unibic Foods (Top Brand; Unibic) with 16 products and DRB Foods (Top Brand; Nutty Gritties) with 13 products, representing a combined market share presence of 17.2% in 2023. Top drink companies recently launching cranberry-containing products were Dabur (Top Brand; Réal Fruit Powder) with 6 products, Bright Lifecare (Top Brand; MuscleBlaze) with 5 products and Radiohead Brands (Top Brands; Jimmy's Cocktails) with 4 product launches, while Pawsitive Pets (Top Brands; Wag & Love and Canine Creek Advanced Pet Nutrition), Yappy Pets (Top Brand; Loveabowl) and Abis Exports (Top Brands; Canine Creek Advanced Pet Nutrition) were dominant in the launches of pet cranberry-containing products with 4,3 and 2 product releases respectively, within the review period.
Of interest, SproutLife Foods Private, increased their product launches significantly by 160.0% from 2019 to 2020 and 200.0% from 2021 to 2022, and HW Wellness Solutions, experienced a 300.0% increase in annual growth from 2020 to 2021, despite the presence of a relatively fragmented market. In the pet food category, manufacturer Yappy Pets, established a presence within the market, releasing 3 cranberry-containing products in 2023.
| Company | Number of new products by year | Total | |||||
|---|---|---|---|---|---|---|---|
| 2018 | 2019 | 2020 | 2021 | 2022 | 2023 | ||
| Food companies | 563 | ||||||
| SproutLife Foods Private | 5 | 5 | 13 | 2 | 6 | 2 | 33 |
| HW Wellness Solutions | 2 | 4 | 1 | 4 | 2 | 5 | 18 |
| Naturell | 2 | 7 | 1 | 0 | 3 | 4 | 17 |
| Unibic Foods | 5 | 4 | 2 | 2 | 2 | 1 | 16 |
| DRB Foods | 1 | 2 | 2 | 0 | 4 | 4 | 13 |
| Drink companies | 56 | ||||||
| Dabur | 0 | 1 | 1 | 0 | 3 | 1 | 6 |
| Bright Lifecare | 0 | 0 | 0 | 3 | 1 | 1 | 5 |
| Radiohead Brands | 0 | 0 | 2 | 1 | 1 | 0 | 4 |
| Pet companies | 30 | ||||||
| Pawsitive Pets | 3 | 1 | 0 | 0 | 0 | 0 | 4 |
| Yappy Pets | 0 | 0 | 0 | 0 | 0 | 3 | 3 |
| Abis Exports | 1 | 0 | 0 | 0 | 1 | 0 | 2 |
| Source: Mintel Global New Product Database (GNPD), 2024 | |||||||
In recent food launches, 38.0% were new products, followed by new variety/range extension (185 products), and new packaging (139 products). In the drink category, 39.3% of the products were new variety/range extension whereas the remaining launches were new packaging and new products (20 and 14 products respectively). In the pet category, 70.0% of the launches were new products.
Top food packaging types were flexible stand-up pouch (239 products), flexible (189 products) and jar (68 products), while main drink package types were carton and bottle (19 and 17 products respectively), and pet package types were largely flexible stand-up pouches (19 products) and flexible (10 products).
| Launch type | Number of new products by year | Total | |||||
|---|---|---|---|---|---|---|---|
| 2018 | 2019 | 2020 | 2021 | 2022 | 2023 | ||
| Food product launches | 563 | ||||||
| New product | 31 | 40 | 41 | 29 | 29 | 44 | 214 |
| New variety/range extension | 34 | 32 | 19 | 20 | 34 | 46 | 185 |
| New packaging | 29 | 20 | 16 | 16 | 20 | 38 | 139 |
| Drink product launches | 56 | ||||||
| New variety/range extension | 4 | 4 | 4 | 3 | 3 | 4 | 22 |
| New packaging | 1 | 6 | 1 | 3 | 5 | 4 | 20 |
| New product | 1 | 3 | 2 | 6 | 0 | 2 | 14 |
| Pet product launches | 30 | ||||||
| New product | 3 | 3 | 0 | 2 | 4 | 9 | 21 |
| New variety/range extension | 0 | 0 | 0 | 0 | 2 | 2 | 4 |
| New packaging | 1 | 1 | 0 | 0 | 0 | 2 | 4 |
| Source: Mintel Global New Product Database (GNPD), 2024 | |||||||
In recent food product launches, 20.4% of the manufacturers were located primarily in India (115 products), whereas 22 products (3.9%) were manufactured in the United States. Recent drink product launches indicate Nepal, Poland and India as primary manufacture locations, while pet products were manufactured mainly in Canada (5 products) and the Netherlands (4 products) in the review period. Of interest, of the 649 (food, drink and pet category) cranberry-containing products launched in India, 65 products reported an import status. Top suppling countries were the United States providing a majority (24) products, followed by Canada supplying 7 products, Malaysia (5 products) Nepal and Poland (4 products respectively), representing a combined market supply share of 67.7% during the prescribed period.
| Location of manufacture | Number of new products by year | Total | |||||
|---|---|---|---|---|---|---|---|
| 2018 | 2019 | 2020 | 2021 | 2022 | 2023 | ||
| Location of manufacture (food) | 563 | ||||||
| India | 12 | 15 | 12 | 22 | 20 | 34 | 115 |
| United States | 10 | 2 | 1 | 2 | 5 | 2 | 22 |
| Thailand | 2 | 0 | 0 | 0 | 1 | 1 | 4 |
| Location of manufacture (drink) | 56 | ||||||
| Nepal | 0 | 1 | 0 | 0 | 3 | 0 | 4 |
| Poland | 0 | 3 | 0 | 0 | 0 | 0 | 3 |
| India | 0 | 1 | 0 | 0 | 1 | 1 | 3 |
| Location of manufacture (pet) | 30 | ||||||
| Canada | 0 | 1 | 0 | 0 | 0 | 4 | 5 |
| India | 0 | 0 | 0 | 0 | 1 | 1 | 2 |
| Netherlands | 1 | 1 | 0 | 0 | 0 | 02 | 4 |
| Source: Mintel Global New Product Database (GNPD), 2024 | |||||||
| Sub-category (Top 10) | Number of products | Average price per product (in US$) |
|---|---|---|
| Total | 649 | 4.84 |
| Snack Mixes | 146 | 4.91 |
| Fruit Snacks | 113 | 4.56 |
| Cold Cereals | 110 | 5.15 |
| Snack/Cereal/Energy Bars | 78 | 2.97 |
| Sweet Biscuits/Cookies | 40 | 2.69 |
| Chocolate Tablets | 28 | 4.82 |
| Dog Food Dry | 15 | 12.19 |
| Fruit/Flavoured Still Drinks | 15 | 1.69 |
| Non-Individually Wrapped Chocolate Pieces | 13 | 6.04 |
| Beverage Concentrates | 11 | 1.94 |
| Other | 80 | 6.96 |
| Source: Mintel Global New Product Database (GNPD), 2024 | ||
Examples of new products
Assortment Pack

Source: Mintel Global New Products Database, 2024
| Company | Anveshan Farm Technologies |
|---|---|
| Brand | Anveshan |
| Category | Snacks |
| Sub-category | Snack mixes |
| Market | India |
| Store type | Gourmet store |
| Date published | December 2023 |
| Launch type | New product |
| Price in US dollars | 8.10 |
Anveshan Assortment Pack is now available, and retails in a pack containing Dry Fruit Paak 200 grams and Trail Mix 125 grams. - A gift hamper full of homely aroma and traditional Indian superfoods - The products are prepared using best quality ingredients that are sourced directly from Indian farmers, an initiative to empower rural India - They are truly pure and preservative-free - The company is a farm-to-fork brand, delivering pure food to customers and a fair share to farmers - Logos and certifications: Vegetarian Green Dot, FSSAI, QR code, Facebook, Instagram
Fruit & Nut Millet Muesli

Source: Mintel Global New Products Database, 2024
| Company | Tata Consumer Soulfull |
|---|---|
| Brand | Tata Soulfull |
| Category | Breakfast Cereals |
| Sub-category | Cold Cereals |
| Market | India |
| Import status | Not imported |
| Store type | Supermarket |
| Date published | September 2022 |
| Launch type | Relaunch |
| Price in US dollars | 3.77 |
Tata Soulfull Fruit & Nut Millet Muesli has been relaunched with a new brand name, previously known as Soulfull, and a newly designed super saver pack, and retail in a 700 gram pack. - Contains 90% whole grains, fruits, nuts and almonds - Source of protein - Awesome morning breakfast - Contains goodness of super grain ragi, delicious fruits, friendly whole wheat, hardcore oats, raisins and almonds - Suitable for vegetarians - Logos and certifications: Instagram, Facebook and LinkedIn
Cranberry Orange Biscotti

Source: Mintel Global New Products Database, 2024
| Company | Shemade Gourmet Foods |
|---|---|
| Brand | She Made |
| Category | Bakery |
| Sub-category | Sweet biscuits / cookies |
| Market | India |
| Import status | Not imported |
| Store type | Internet / mail order |
| Date published | May 2021 |
| Launch type | New variety / range extension |
| Price in US dollars | 1.35 |
She Made Cranberry Orange Biscotti are now available. This baked, vegetarian product provides 3 grams of protein and 3 grams of dietary fibre. It is free from added refined sugar, gluten, preservatives and dairy, and it was made in a peanut-free facility. These biscotti retail in a 56.6 gram pack featuring Facebook, Twitter and Instagram logos.
Cranberry Fruit Magic Beverage

Source: Mintel Global New Products Database, 2024
| Company | Zimdra Food |
|---|---|
| Brand | Nutrilife |
| Category | Juice drinks |
| Sub-category | Fruit / flavoured still drinks |
| Market | India |
| Store type | Supermarket |
| Date published | October 2019 |
| Launch type | New variety / range extension |
| Price in US dollars | 2.67 |
Nutrilife Cranberry Fruit Magic Beverage is free from added preservatives. This product is suitable for vegetarians and is said to be full of nutrition and good health. It retails in a 1 litre recyclable pack bearing the ISO 22000 certificate and FSC Mix logo.
Carrot & Cranberry Adult Vigour Natural Dog Food for Small & Medium Breeds

Source: Mintel Global New Products Database, 2024
| Company | Pawsitive Pets |
|---|---|
| Brand | Wag & Love |
| Category | Pet food |
| Sub-category | Dog food dry |
| Market | India |
| Import status | Imported product |
| Store type | Internet / mail order |
| Date published | January 2019 |
| Launch type | New packaging |
| Price in US dollars | 24.47 |
Wag & Love Carrot & Cranberry Adult Vigour Natural Dog Food for Small & Medium Breeds has been repackaged in a newly designed 3.5 kilogram pack containing seven 500 gram mini-packs. According to the manufacturer, this dog food has the following features: comes with the goodness of fresh meats, fruits and vegetables; is made from naturally hypoallergenic single source meat; contains herbs and natural antioxidants; is made in a state-of-the-art, GMP+ and IFS certified facility in Europe; is packed with premium fresh and pure natural ingredients; and exceeds AAFCO (USA) and FEDIAF (EU) gold standards on canine nutrition. This product is said to contain the following superfood ingredients: fresh boneless chicken, dried chicken and eggs, which are excellent sources of lean protein, vitamins and minerals for growth and well-being; apple, carrot, mango, banana, celery and peas, which contain antioxidants, 20+ vitamins and minerals, and fibres, for healthy eyes, skin and stronger immune system; sweet potatoes, which are a nutrient rich source of carbs, vitamins A, B6 and C, potassium, magnesium and iron; basil, thyme, nettle and echinacea, which are ayurvedic herbs with antimicrobial, digestive and pro-health properties; cranberry, which contains pro-health fibres, and is rich in antioxidants and vitamin C, to support urinary tract; flaxseed and salmon oil, which promote shiny coat and healthy heart, and contain EPA and DHA omega-3's, which support brain and vision development; glucosamine and chondroitin, which support joint health and lower risk of osteoarthritis; high in zinc and selenium, which contain antioxidant, and promote shiny coat; prebiotics, which support gut health and digestion; yucca extract, which helps reduce stool and body odour; L-carnitine and taurine, which contribute to healthy heart and brain, with L-carnitine also supporting fat metabolism; and chelated minerals, which improve absorption of trace minerals. It is made with a low-fat recipe, and contains no artificial flavours, preservatives or colours, grains, GMO, corn, gluten, soy, beef or pork. The pack is said to be nitrogen flushed to preserve nutrients, and metal coated to preserve flavour.
For more information
The Canadian Trade Commissioner Service:
International Trade Commissioners can provide Canadian industry with on-the-ground expertise regarding market potential, current conditions and local business contacts, and are an excellent point of contact for export advice.
More agri-food market intelligence:
International agri-food market intelligence
Discover global agriculture and food opportunities, the complete library of Global Analysis reports, market trends and forecasts, and information on Canada's free trade agreements.
Agri-food market intelligence service
Canadian agri-food and seafood businesses can take advantage of a customized service of reports and analysis, and join our email subscription service to have the latest reports delivered directly to their inbox.
More on Canada's agriculture and agri-food sectors:
Canada's agriculture sectors
Information on the agriculture industry by sector. Data on international markets. Initiatives to support awareness of the industry in Canada. How the department engages with the industry.
Resources
- Business Today, India cuts import duties on cranberries, blueberries, and frozen turkey Surabhi, updated February 20, 2024.
- Euromonitor International, 2024
- Global Trade Tracker, 2024
- Mintel Global New Products Database, 2024
Customized Report Service – Cranberry products in India
Global Analysis Report
Prepared by: Laurie Bernardi, International Market Research Analyst
© His Majesty the King in Right of Canada, represented by the Minister of Agriculture and Agri-Food (2024).
Photo credits
All photographs reproduced in this publication are used by permission of the rights holders.
All images, unless otherwise noted, are copyright His Majesty the King in Right of Canada.
To join our distribution list or to suggest additional report topics or markets, please contact:
Agriculture and Agri-Food Canada, Global Analysis1341 Baseline Rd, Tower 5, 3rd floor
Ottawa ON K1A 0C5
Canada
Email: aafc.mas-sam.aac@agr.gc.ca
The Government of Canada has prepared this report based on primary and secondary sources of information. Although every effort has been made to ensure that the information is accurate, Agriculture and Agri-Food Canada (AAFC) assumes no liability for any actions taken based on the information contained herein.
Reproduction or redistribution of this document, in whole or in part, must include acknowledgement of agriculture and agri-food Canada as the owner of the copyright in the document, through a reference citing AAFC, the title of the document and the year. Where the reproduction or redistribution includes data from this document, it must also include an acknowledgement of the specific data source(s), as noted in this document.
Agriculture and Agri-Food Canada provides this document and other report services to agriculture and food industry clients free of charge.