

Note: This report includes forecasting data that is based on baseline historical data.
Executive summary
In 2023, global imports of unroasted malt ingredients (HS:110710) totaled US$4.8 billion (6,567.2 thousand tonnes) and imports of germ of cereals (HS:110430) reached US$186.8 million (323.3 thousand tonnes). Top import markets for unroasted malt over the year included Brazil, Mexico, Japan, United States (US), and Vietnam; while top markets of germ of cereals were Turkey, Italy, Belgium, United States, and Romania in 2023.
Off/on-trade volume sales of malt totaled 26.2 million tonnes across the world with off-trade (retail) sales accounting for 80.3% and the remainder 19.7% in on-trade (foodservice) sales in 2023. The regions that had the highest volume sales of malt were Asia Pacific (within top 10: incl. China, Vietnam, Japan), followed by Latin America (Brazil, Mexico), and Western Europe (Germany, United Kingdom, Spain). In 2023, volume sales of malt extract totaled 286.2 thousand tonnes across the world - 80.1% in retail and 19.9% in foodservice sales in 2023. Top global markets for volume sales of malt extract over the year were India, US, Nigeria, Brazil and the UK with Canada ranking as the 20th largest market.
99.6% of all malt ingredients found within alcoholic drinks goes into beer products. Global consumption of malt products was equivalent to 3.3 tonnes per '000 people in 2023. In 2022, global sales of beer totaled US$711.6 billion (200.0 billion litres) consisting of off-trade retail sales of US$324.6 billion (133.3 billion litres) and in on-trade or foodservice sales at US$387.0 billion (66.8 billion litres) - based on retailer selling prices (RSP). These totals consisted of dark beer (incl. Ale, Sorghum, Weissbier/Weizen/wheat Beer) at a value of US$63.9 billion (market share: 9.0%), Lager beer (incl. domestic and imported standard, flavoured/mixed Lager) at US$610.6 billion (85.8%), Stout beer at US$16.2 billion (2.3%), and non/low alcohol beer at US$20.8 billion (2.9%). In 2023, leading global markets with the highest volume off/on-trade sales in the beer sector were China (US$103.1 billion) at 43.1 billion litres (market share: 21.5%), the United States (US$114.2 billion) at 22.5 billion litres (11.3%), Brazil (US$56.2 billion) at 15.1 billion litres (7.5%), Mexico (US$32.4 billion) at 9.7 billion litres (4.9%), and Germany (US$31.8 billion) at 9.2 billion litres (4.6%). Canada was the 10th largest market at US$13.3 billion at a volume share of 1.1% (2.3 billion litres) in 2022.
According to Mintel, there were 24,751 new food, drink, health, and petfood products containing malt ingredients (excl. malt extract) launched globally across grocery retailer outlets (incl. new variety/range extension, packaging, formulation or relaunched) between the period of January 2019 and March 27, 2024. Top global sub-categories for these product launches were beer (59.2%), bread and bread products (5.2%), cold cereals (5.1%), sweet biscuits/cookies (3.3%), and cakes, pastries and sweet goods (2%). In Mintel's report, innovation in these sectors are mainly pivoting around new packaging and limited edition flavours, while low/no alcohol options are gaining share of launch activity. In the Europe, Middle Eastern and Africa (EMEA) region, canned formats are taking a growing share in beer and cider launches, whereby brands are increasingly experimenting with new exciting flavour infusions much like in the Asia Pacific (APAC) region. Limited edition launches and flagging up social media claims are also, trends driving consumer engagement in the APAC. Meanwhile, flavoured beer launches have declined in the Americas region, although consumer interest remains - especially in low and no alcohol beers (A Year of Innovation in beer and cider, 2024).
Trade overview
Malt
In 2023, global imports of malt, excluding roasted (HS:110710) reached a total of US$4.8 billion (6,567.2 thousand tonnes). This total import value has been increasing at a compound annual growth rate (CAGR) of 5.6%, between 2019 and 2023. Smaller malt ingredients in the unroasted malt category that have registered the highest growth between the review period include malted barley grains (including 97.6% brewery barley) at a CAGR of 187.7%, along with malted oats or rye, not roasted growing at a CAGR of 66.6%. During this time period, the imports experiencing a decline were for unroasted malted sorghum or millet at a CAGR of −54.4% and unroasted malt for use in brewing (−34.1%).
The top global importers of unroasted malt were Brazil at a market value share of 19.4%, Mexico (9.4%), Japan (7.8%), the United States (US) (6.2%), and Vietnam (5.2%), with Canada (ranking 47th in value terms) importing US$12.3 million (0.3%) in 2023. The largest malt (excluding roasted) categories were malt (excluding wheat and flour) at a total of US$1.2 billion in 2023 (CAGR: 10.6%), wheat malt (excluding flour) at US$999.4 million (+12.5%), and malt flour from wheat, rye, meslin or triticale at US$82.4 million (+5.8%).
| Country | 2019 | 2020 | 2021 | 2022 | 2023 | CAGR* % 2019-2023 |
|---|---|---|---|---|---|---|
| Total - global imports | 3,847.4 | 3,351.4 | 4,081.1 | 4,671.6 | 4,780.2 | 5.6 |
| 1. Brazil | 580.9 | 578.5 | 765.0 | 815.9 | 928.2 | 12.4 |
| 2. Mexico | 335.3 | 268.8 | 383.4 | 416.2 | 448.8 | 7.6 |
| 3. Japan | 272.7 | 237.4 | 210.2 | 273.8 | 370.7 | 8.0 |
| 4. United States | 287.6 | 247.2 | 284.0 | 273.7 | 294.1 | 0.6 |
| 5. Vietnam | 194.0 | 155.2 | 125.5 | 265.5 | 249.6 | 6.5 |
| 6. Belgium | 163.9 | 132.0 | 221.2 | 210.1 | 214.7 | 7.0 |
| 7. Thailand | 113.4 | 107.6 | 105.1 | 132.1 | 198.3 | 15.0 |
| 8. Netherlands | 106.4 | 96.6 | 121.6 | 132.9 | 160.8 | 10.9 |
| 9. Poland | 87.8 | 94.3 | 110.6 | 117.2 | 152.6 | 14.8 |
| 10. Italy | 71.3 | 58.9 | 83.4 | 80.8 | 141.8 | 18.8 |
| Subtotal - top 10 importers | 2,213.2 | 1,976.5 | 2,410.1 | 2,718.3 | 3,159.5 | 9.3 |
| Canada (47th) | 13.7 | 16.1 | 16.3 | 16.3 | 12.3 | −2.8 |
|
Source: Global trade tracker, 2024 *CAGR: Compound Annual Growth Rate |
||||||
| Country | 2019 | 2020 | 2021 | 2022 | 2023 | CAGR* % 2019-2023 |
|---|---|---|---|---|---|---|
| Total - global imports | 7,255.1 | 6,582.0 | 7,520.3 | 7,399.5 | 6,567.2 | −2.5 |
| 1. Brazil | 1,086.3 | 1,139.5 | 1,418.7 | 1,272.3 | 1,293.3 | 4.5 |
| 2. Mexico | 602.2 | 462.8 | 640.4 | 605.5 | 586.5 | −0.7 |
| 3. Japan | 485.0 | 424.0 | 375.2 | 450.3 | 461.6 | −1.2 |
| 4. Belgium | 435.5 | 336.3 | 490.0 | 447.9 | 412.0 | −1.4 |
| 5. Vietnam | 408.4 | 339.6 | 270.0 | 480.6 | 362.5 | −2.9 |
| 6. United States | 419.6 | 363.1 | 410.3 | 354.4 | 361.2 | −3.7 |
| 7. Thailand | 237.1 | 227.8 | 232.8 | 215.3 | 266.3 | 2.9 |
| 8. Netherlands | 282.5 | 261.5 | 310.5 | 299.1 | 264.2 | −1.7 |
| 9. Poland | 204.2 | 224.3 | 266.1 | 234.6 | 215.4 | 1.3 |
| 11. Germany | 222.4 | 193.6 | 177.8 | 190.1 | 197.1 | −3.0 |
| Subtotal - top 10 importers | 4,383.2 | 3,972.6 | 4,591.9 | 4,550.1 | 4,420.2 | 0.2 |
| Italy (11th) | 147.8 | 131.1 | 178.4 | 160.8 | 195.1 | 7.2 |
| Canada (17th) | 18.5 | 79.1 | 23.8 | 56.1 | 77.1 | 42.9 |
|
Source: Global trade tracker, 2024 *CAGR: Compound Annual Growth Rate |
||||||
| Description | 2019 | 2020 | 2021 | 2022 | 2023 | CAGR* % 2019-2023 |
|---|---|---|---|---|---|---|
| Total - malt, not roasted (HS[1]:110710) | 3,847.4 | 3,351.4 | 4,081.1 | 4,671.6 | 4,780.2 | 5.6 |
| Malt (excluding roasted, wheat and flour) | 769.4 | 678.5 | 817.1 | 914.7 | 1,151.5 | 10.6 |
| Wheat malt, not roasted (excluding flour) | 623.2 | 615.3 | 821.0 | 867.0 | 999.4 | 12.5 |
| Malt flour from wheat, rye, meslin or triticale (excluding roasted) | 65.8 | 64.2 | 82.7 | 60.6 | 82.4 | 5.8 |
| Malted barley grains, not roasted (including brewery barley[2]) | 0.432 | 0.777 | 0.326 | 27.4 | 29.6 | 187.7 |
| Malted oats or rye, not roasted | 1.1 | 0.697 | 7.9 | 1.7 | 8.4 | 66.6 |
| Malt for use in brewing, not roasted | 2.3 | 1.6 | 0.935 | 0.737 | 0.436 | −34.1 |
| Malted sorghum or millet, not roasted | 2.4 | 0.483 | 0.023 | 0.003 | 0.103 | −54.4 |
| Other - malt, not roasted | 2,171.2 | 1,822.7 | 2,138.0 | 2,571.9 | 2,507.1 | 3.7 |
| Total - roasted malt (HS:110720) | 341.1 | 274.1 | 295.4 | 306.3 | 327.6 | −1.0 |
|
Source: Global trade tracker, 2024 *CAGR: Compound Annual Growth Rate 1 - HS codes used in malt definition (excluding roasted): Malt (excluding roasted, wheat and flour) - 11071099; Wheat malt (excluding flour) - 11071010, 1107019, 110710100000; Malt flour - 1107101000, 11071011, 11071091, 11071091000, 11071020000; Malted barley grains (including brewery barley) - 1107100010, 1107100090, 1107101010, 1107102010, 110710200000; Malted oats or rye - 1107100010, 1107100090, 1107101010, 1107102010, 110710200000; Malt for use in brewing - 1107100001; Malted sorghum or millet - 11071020, 11071025; 11071030, 11071050, 110710500000 2: Malted barley grains, not roasted - Total in 2023, includes 97.6% of brewery barley |
||||||
| Description | 2019 | 2020 | 2021 | 2022 | 2023 | CAGR* % 2019-2023 |
|---|---|---|---|---|---|---|
| Total - malt, not roasted (HS[1]:110710) | 7,255.1 | 6,582.0 | 7,520.2 | 7,399.5 | 6,567.1 | −2.5 |
| Malt (excluding roasted, wheat and flour) | 1,841.3 | 1,639.9 | 1,869.6 | 1,869.9 | 1,770.1 | −1.0 |
| Wheat malt, not roasted (excluding flour) | 1,167.9 | 1,215.2 | 1,529.0 | 1,366.2 | 1,390.0 | 4.4 |
| Malt flour from wheat, rye, meslin or triticale (excluding roasted) | 132.3 | 143.3 | 161.7 | 105.8 | 107.8 | −5.0 |
| Malted barley grains, not roasted (including brewery barley[2]) | 0.600 | 1.3 | 0.516 | 34.0 | 33.5 | 173.3 |
| Malted oats or rye, not roasted | 1.5 | 0.690 | 17.7 | 2.1 | 11.5 | 65.6 |
| Malt for use in brewing, not roasted | 3.9 | 2.6 | 1.3 | 0.484 | 0.342 | −45.7 |
| Malted sorghum or millet, not roasted | 3.8 | 0.919 | 0.037 | 0.010 | 0.180 | −53.3 |
| Other - malt, not roasted | 3,723.4 | 3,251.9 | 3,549.9 | 3,679.9 | 3,252.8 | −3.3 |
| Total - roasted malt (HS:110720) | 559.2 | 490.5 | 465.6 | 425.2 | 421.0 | −6.9 |
|
Source: Global trade tracker, 2024 *CAGR: Compound Annual Growth Rate 1 - HS codes used in malt definition (excluding roasted): Malt (excluding roasted, wheat and flour) - 11071099; Wheat malt (excluding flour) - 11071010, 1107019, 110710100000; Malt flour - 1107101000, 11071011, 11071091, 11071091000, 11071020000; Malted barley grains (including brewery barley) - 1107100010, 1107100090, 1107101010, 1107102010, 110710200000; Malted oats or rye - 1107100010, 1107100090, 1107101010, 1107102010, 110710200000; Malt for use in brewing - 1107100001; Malted sorghum or millet - 11071020, 11071025; 11071030, 11071050, 110710500000 2: Malted barley grains, not roasted - Total in 2023, includes 97.6% of brewery barley |
||||||
Canada's trade performance - malt
In 2023, Canada's imports from the world of unroasted malt (HS:110710) totaled Can$16.5 million (77.1 thousand tonnes) and roasted malt (HS:110720) at Can$6.4 million (4.2 thousand tonnes). Total import values for roasted malt has been increasing by a CAGR of 1.8%, while unroasted malt has declined by 2.4% between 2019 and 2023.
In terms of export performance, Canada exported to the world a total of Can$571.6 million (574.6 thousand tonnes) growing at a CAGR of 6.3% in value (2019-2023), with zero exports of roasted malt in 2023 - down from Can$850 thousand in 2022. In 2023, Canada's top export markets for unroasted malt included the United States at a value of Can$307.2 million (market share: 53.7%), Japan at Can$130.5 million (22.8%), Mexico at Can$88.4 million (15.5%), South Korea at Can$22.7 million (4.0%), and Peru at Can$8.6 million (1.5%). Other smaller markets showing high growth over the review period for importing Canadian unroasted malt, including Peru at a CAGR of 158.9% were Côte d'Ivoire (+86.7%), Guatemala (+74%), Burkina Faso (+69.8%), and Angola (+12.9%).
| Description | 2019 | 2020 | 2021 | 2022 | 2023 | CAGR* % 2019-2023 |
|---|---|---|---|---|---|---|
| Total - malt, not roasted (HS:110710) | 18.2 | 21.6 | 20.4 | 21.2 | 16.5 | −2.4 |
| 1107101100 - Malt, not roasted, whole, within access commitment | 14.6 | 16.1 | 15.4 | 13.9 | 12.0 | −4.7 |
| 1107101200 - Malt, not roasted, whole, over access commitment | 3.2 | 5.2 | 4.6 | 6.8 | 4.0 | 6.2 |
| 1107109200 - Malt, not roasted, other than whole, over access commitment | 0.188 | 0.115 | 0.241 | 0.277 | 0.259 | 8.4 |
| 1107109100 - Malt, not roasted, other than whole, within access commitment | 0.266 | 0.188 | 0.151 | 0.207 | 0.208 | −5.9 |
| Total - roasted malt (HS:110720) | 6.0 | 5.0 | 5.6 | 5.4 | 6.4 | 1.8 |
|
Source: Global trade tracker, 2024 *CAGR: Compound Annual Growth Rate |
||||||
| Description | 2019 | 2020 | 2021 | 2022 | 2023 | CAGR* % 2019-2023 |
|---|---|---|---|---|---|---|
| Total - malt, not roasted (HS:110710) | 18.4 | 79.1 | 23.8 | 56.1 | 77.1 | 42.9 |
| 1107101100 - Malt, not roasted, whole, within access commitment | 3.7 | 60.9 | 4.7 | 43.1 | 67.4 | 106.0 |
| 1107101200 - Malt, not roasted, whole, over access commitment | 14.0 | 17.7 | 18.6 | 12.2 | 9.0 | −10.5 |
| 1107109200 - Malt, not roasted, other than whole, over access commitment | 0.202 | 0.098 | 0.211 | 0.332 | 0.327 | 12.8 |
| 1107109100 - Malt, not roasted, other than whole, within access commitment | 0.540 | 0.415 | 0.272 | 0.467 | 0.313 | −12.7 |
| Total - roasted malt (HS:110720) | 5.1 | 29.4 | 7.8 | 5.2 | 4.2 | −4.7 |
|
Source: Global trade tracker, 2024 *CAGR: Compound Annual Growth Rate |
||||||
| Country | 2019 | 2020 | 2021 | 2022 | 2023 | CAGR* % 2019-2023 |
|---|---|---|---|---|---|---|
| Total - exports of malt, roasted | 0.006 | 0.0 | 0.023 | 0.850 | 0.0 | −100.0 |
| Total - exports of malt, excluding roasted | 448.0 | 396.6 | 392.2 | 451.9 | 571.6 | 6.3 |
| 1. United States | 260.7 | 231.5 | 235.8 | 255.6 | 307.2 | 4.2 |
| 2. Japan | 100.1 | 81.5 | 63.7 | 88.6 | 130.5 | 6.9 |
| 3. Mexico | 58.1 | 55.1 | 58.6 | 79.3 | 88.4 | 11.0 |
| 4. South Korea | 10.3 | 10.6 | 13.2 | 6.5 | 22.7 | 22.0 |
| 5. Peru | 0.0 | 0.496 | 0.221 | 3.1 | 8.6 | 158.9 |
| 6. Angola | 0.0 | 0.0 | 0.0 | 3.5 | 4.0 | 12.9 |
| 7. Colombia | 3.8 | 6.5 | 4.9 | 10.7 | 4.0 | 0.7 |
| 8. Burkina Faso | 0.0 | 0.0 | 0.0 | 1.4 | 2.3 | 69.8 |
| 9. Guatemala | 0.0 | 0.437 | 0.786 | 1.1 | 2.3 | 74.0 |
| 10. Côte d'Ivoire | 0.0 | 0.0 | 0.0 | 0.780 | 1.5 | 86.7 |
| Subtotal - top 10 countries | 433.1 | 386.1 | 377.2 | 450.5 | 571.5 | 7.2 |
|
Source: Global trade tracker, 2024 *CAGR: Compound Annual Growth Rate |
||||||
| Country | 2019 | 2020 | 2021 | 2022 | 2023 | CAGR* % 2019-2023 |
|---|---|---|---|---|---|---|
| Total - exports of malt, roasted (kilograms) | 12,617 | 670 | 9,979 | 678,646 | 0.0 | −100 |
| Total - exports of malt, excluding roasted | 588,795 | 515,129 | 543,804 | 517,453 | 574,624 | −0.6 |
| 1. United States | 316,121 | 277,426 | 304,831 | 276,108 | 302,107 | −1.1 |
| 2. Japan | 142,192 | 114,688 | 95,452 | 111,925 | 128,614 | −2.5 |
| 3. Mexico | 88,591 | 81,659 | 91,550 | 93,542 | 88,453 | 0.0 |
| 4. South Korea | 15,802 | 17,251 | 21,481 | 7,277 | 24,636 | 11.7 |
| 5. Peru | 0.0 | 609 | 313 | 3,017 | 11,850 | 169.0 |
| 6. Angola | 0.0 | 0.0 | 0.0 | 4,861 | 5,487 | 12.9 |
| 7. Colombia | 5,370 | 9,021 | 7,964 | 14,642 | 4,923 | −2.1 |
| 8. Burkina Faso | 0.0 | 0.0 | 0.0 | 1,906 | 3,236 | 69.8 |
| 9. Guatemala | 0.0 | 547 | 1,046 | 1,431 | 3,168 | 79.6 |
| 10. Côte d'Ivoire | 0.0 | 0.0 | 0.0 | 1,046 | 2,010 | 92.2 |
| Subtotal - top 10 countries | 588,795 | 515,129 | 543,804 | 517,453 | 574,624 | −0.6 |
|
Source: Global trade tracker, 2024 *CAGR: Compound Annual Growth Rate |
||||||
Germ of cereals (whole, rolled, flaked, ground)
In 2023, global imports of germ of cereals (HS:110430) reached a total of US$186.8 million (323.3 thousand tonnes). This total import value has been increasing at a CAGR of 9.1%, while the total import volume has decreased by 3.9% between 2019 and 2023. Germ of cereals ingredients that have grown the most between the review period include cereal grains otherwise worked, excluding rice of heading 10.06 (HS: 11043000/00 - ie; hulled, rolled, flaked, pearled, sliced or kibbled) at a CAGR of 23.5%, along with the smaller market for germ of cereals for the production of brewing malt or beer, whole, squashed, flaked or ground (HS: 11043091, 11043099) growing at a CAGR of 106.9%.
The top global importers of germ of cereals were Turkey at a market share of 22.8%, Italy (15.5%), Belgium (13.2%), the US (11.6%), and Romania (7.6%), with Canada (11th largest value market) importing US$3.0 million (1.6%) in 2023. The largest germ of cereals categories over the last year, were cereal germ, whole, rolled, flaked or ground (excluding wheat)) at US$142.3 million (CAGR: 7.7%), cereal grains otherwise worked at US$29.8 million (+23.5%), and germ of cereals, whole/rolled/flaked or ground used as breakfast at US$9.1 million (+5.3%).
| Country | 2019 | 2020 | 2021 | 2022 | 2023 | CAGR* % 2019-2023 |
|---|---|---|---|---|---|---|
| Total - global imports | 131.9 | 151.8 | 226.7 | 279.9 | 186.8 | 9.1 |
| 1. Turkey | 28.6 | 39.6 | 74.0 | 93.0 | 42.6 | 10.5 |
| 2. Italy | 22.0 | 27.3 | 38.6 | 46.1 | 29.0 | 7.2 |
| 3. Belgium | 28.0 | 32.1 | 42.8 | 36.9 | 24.8 | −2.9 |
| 4. United States | 10.5 | 11.9 | 18.6 | 26.6 | 21.6 | 19.6 |
| 5. Romania | 0.207 | 0.211 | 2.3 | 7.6 | 14.2 | 187.6 |
| 6. Hungary | 5.8 | 4.9 | 8.0 | 10.5 | 9.4 | 13.0 |
| 7. Germany | 5.3 | 5.3 | 7.6 | 15.8 | 7.2 | 7.6 |
| 8. Nigeria | 0.051 | 1.2 | 0.186 | 5.9 | 6.4 | 385.9 |
| 9. Netherlands | 2.8 | 3.3 | 5.1 | 5.5 | 5.7 | 19.5 |
| 10. France | 4.7 | 4.2 | 5.2 | 4.3 | 5.1 | 1.9 |
| Subtotal - top 10 importers | 107.9 | 130.1 | 202.5 | 252.1 | 166.0 | 11.4 |
| Canada (11th) | 3.3 | 2.8 | 2.9 | 3.9 | 3.0 | −2.1 |
|
Source: Global trade tracker, 2024 *CAGR: Compound Annual Growth Rate |
||||||
| Country | 2019 | 2020 | 2021 | 2022 | 2023 | CAGR* % 2019-2023 |
|---|---|---|---|---|---|---|
| Total - global imports | 379.3 | 380.7 | 424.1 | 434.6 | 323.3 | −3.9 |
| 1. Turkey | 78.4 | 97.3 | 127.3 | 134.7 | 74.4 | −1.3 |
| 2. Italy | 70.3 | 77.2 | 79.9 | 81.4 | 57.7 | −4.8 |
| 3. Belgium | 87.5 | 88.4 | 87.3 | 69.1 | 56.0 | −10.6 |
| 4. United States | 35.9 | 27.8 | 30.9 | 33.2 | 30.3 | −4.2 |
| 5. Romania | 0.642 | 0.293 | 4.3 | 11.6 | 24.7 | 149.1 |
| 6. Hungary | 18.1 | 12.5 | 15.3 | 16.9 | 16.1 | −2.8 |
| 7. Germany | 8.1 | 8.6 | 12.2 | 21.5 | 10.6 | 7.0 |
| 8. Canada | 16.7 | 13.1 | 10.3 | 13.7 | 9.2 | −13.9 |
| 9. Netherlands | 6.4 | 7.7 | 9.7 | 8.6 | 8.0 | 5.7 |
| 10. France | 10.8 | 9.0 | 10.4 | 7.6 | 6.9 | −10.6 |
| Subtotal - top 10 importers | 332.9 | 341.8 | 387.5 | 398.3 | 293.9 | −3.1 |
| Nigeria (12th) | 0.038 | 1.2 | 0.180 | 2.8 | 3.2 | 204.0 |
|
Source: Global trade tracker, 2024 *CAGR: Compound Annual Growth Rate |
||||||
| Description | 2019 | 2020 | 2021 | 2022 | 2023 | CAGR* % 2019-2023 |
|---|---|---|---|---|---|---|
| Total - germ of cereals[1] | 131.9 | 151.8 | 226.7 | 279.9 | 186.8 | 9.1 |
| Cereal germ, whole, rolled, flaked or ground (excluding wheat) | 105.6 | 122.7 | 190.8 | 227.3 | 142.3 | 7.7 |
| Cereal grains otherwise worked (that is, hulled, rolled, flaked, pearled, sliced or kibbled), excluding rice of heading 10.06; and germ of cereals | 12.8 | 15.2 | 21.3 | 34.6 | 29.8 | 23.5 |
| Germ of cereals, whole, rolled, flaked or ground used as breakfast for human consumption | 7.4 | 7.5 | 8.0 | 8.8 | 9.1 | 5.3 |
| Wheat germ for human consumption, whole, rolled, flaked or ground (including rye, meslin or triticale seeds) | 1.8 | 1.9 | 1.5 | 1.5 | 1.8 | 0.8 |
| Cereal or wheat germs for animal feed | 0.551 | 0.644 | 0.452 | 0.364 | 0.519 | −1.5 |
| Germ of cereals, whole, rolled, flaked or ground | 0.378 | 0.498 | 0.610 | 0.808 | 0.317 | −4.3 |
| Germ of cereals for the production of brewing malt or beer, whole, squashed, flaked or ground | 0.00010 | 0.00101 | 0.00105 | 0.00260 | 0.00183 | 106.9 |
| Other - germs of cereals, nes, whole, rolled, flaked or ground (often for the production of oils or fats for edible purposes) | 3.0 | 2.6 | 3.6 | 5.9 | 3.0 | −0.1 |
|
Source: Global trade tracker, 2024 *CAGR: Compound Annual Growth Rate 1 - Codes used in germ of cereals definition under HS 110430: Cereal germ (excluding wheat) - 11043090, 11043092; Cereal grains otherwise worked - 11043000/00; Germ of cereals used as breakfast for consumption - 11043010; Wheat germ - 11043089, 1104300010, 1104301000/0, 1104301100, 110401200; Cereal germs for animal feed - 11043001, 11043070, 11043081, 11043093; Germ of cereals, whole/rolled/flaked or ground - 11043009, 110430000/00/0, 11043000007, 1104300020; germ for use in brewing malt or beer - 11043091, 11043099; Other germs of oils or fats - 11043012, 11043021, 11043039, 1104300090, 1104309000/0 |
||||||
| Description | 2019 | 2020 | 2021 | 2022 | 2023 | CAGR* % 2019-2023 |
|---|---|---|---|---|---|---|
| Total - germ of cereals[1] | 379.3 | 380.7 | 424.1 | 434.6 | 323.3 | −3.9 |
| Cereal germ, whole, rolled, flaked or ground (excluding wheat) | 308.9 | 318.7 | 363.5 | 365.5 | 264.4 | −3.8 |
| Cereal grains otherwise worked (ie; hulled, rolled, flaked, pearled, sliced or kibbled), excluding rice of heading 10.06; and germ of cereals | 37.1 | 32.1 | 34.5 | 37.8 | 34.9 | −1.5 |
| Germ of cereals, whole, rolled, flaked or ground used as breakfast for human consumption | 12. | 11.3 | 10.2 | 10.8 | 10.6 | −3.0 |
| Wheat germ for human consumption, whole, rolled, flaked or ground (including rye, meslin or triticale seeds) | 1.5 | 1.7 | 1.2 | 1.0 | 0.917 | −11.8 |
| Cereal or wheat germs for animal feed | 1.1 | 1.2 | 0.848 | 0.621 | 0.853 | −6.9 |
| Germ of cereals, whole, rolled, flaked or ground | 0.221 | .201 | 0.203 | 0.201 | 0.144 | −10.2 |
| Germ of cereals for the production of brewing malt or beer, whole, squashed, flaked or ground | 0.027 | 1.4 | .133 | 1.011 | 0.047 | 14.9 |
| Other - germs of cereals, nes, whole, rolled, flaked or ground (often for the production of oils or fats for edible purposes) | 18.2 | 15.1 | 13.2 | 18.3 | 11.5 | −10.9 |
|
Source: Global trade tracker, 2024 *CAGR: Compound Annual Growth Rate 1 - Codes used in germ of cereals definition under HS 110430: Cereal germ (excluding wheat) - 11043090, 11043092; Cereal grains otherwise worked - 11043000/00; Germ of cereals used as breakfast for consumption - 11043010; Wheat germ - 11043089, 1104300010, 1104301000/0, 1104301100, 110401200; Cereal germs for animal feed - 11043001, 11043070, 11043081, 11043093; Germ of cereals, whole/rolled/flaked or ground - 11043009, 110430000/00/0, 11043000007, 1104300020; germ for use in brewing malt or beer - 11043091, 11043099; Other germs of oils or fats - 11043012, 11043021, 11043039, 1104300090, 1104309000/0 |
||||||
Canada's trade performance - germ of cereals
In 2023, Canada's imports from the world of germ of cereals, whole, rolled, flaked (HS:110430) totaled Can$4.0 million (9.2 thousand tonnes). This total import value for germ of cereals has been decreasing by a CAGR value of 1.7% between 2019 and 2023. Over the review period, other germ of cereals, nowhere else specified (n.e.s.) have declined the most in value at a CAGR of −7.8%, while wheat germ (both over/within access commitment) have been increasing by 6.3% and 3.3%, respectively.
Basically, all of Canada's exports for germ of cereals in 2023 were to the United States at a total of Can$28.8 million (30.1 thousand tonnes) growing at a value CAGR of 20.3% (2019-2023). A small amount of germ of cereals were exported to France over last year, while other small export markets over the previous 5-yr period have been Trinidad and Tobago, Qatar, and China.
| Description | 2019 | 2020 | 2021 | 2022 | 2023 | CAGR* % 2019-2023 |
|---|---|---|---|---|---|---|
| Total - Germ of cereals, whole, rolled, flaked | 4.3 | 3.7 | 3.6 | 5.0 | 4.0 | −1.7 |
| 1104309000 - Germs of cereals, nowhere else specified | 2.6 | 1.8 | 2.0 | 3.3 | 1.9 | −7.8 |
| 1104301200 - Wheat germ, over access commitment | 1.3 | 1.6 | 1.4 | 1.4 | 1.7 | 6.3 |
| 1104301100 - Wheat germ, within access commitment | 0.418 | 0.277 | 0.245 | 0.321 | 0.477 | 3.3 |
|
Source: Global trade tracker, 2024 *CAGR: Compound Annual Growth Rate |
||||||
| Description | 2019 | 2020 | 2021 | 2022 | 2023 | CAGR* % 2019-2023 |
|---|---|---|---|---|---|---|
| Total - Germ of cereals, whole, rolled, flaked | 16.7 | 13.1 | 10.3 | 13.7 | 9.2 | −13.9 |
| 1104309000 - Germs of cereals, nowhere else specified | 15.7 | 11.9 | 9.2 | 12.9 | 8.4 | −14.5 |
| 1104301200 - Wheat germ, over access commitment | 0.798 | 1.0 | 0.938 | 0.713 | 0.678 | −4.0 |
| 1104301100 - Wheat germ, within access commitment | 0.247 | 0.152 | 0.185 | 0.165 | 0.164 | −9.7 |
|
Source: Global trade tracker, 2024 *CAGR: Compound Annual Growth Rate |
||||||
| Country | 2019 | 2020 | 2021 | 2022 | 2023 | CAGR* % 2019-2023 |
|---|---|---|---|---|---|---|
| Total - Exports of germ of cereals | 13,770.4 | 15,450.5 | 23,057.5 | 34,172.6 | 28,842.6 | 20.3 |
| 1. United States | 13,768.1 | 15,443.4 | 23,055.8 | 34,172.0 | 28,842.3 | 20.3 |
| 2. France | 0.144 | 0.478 | 0.479 | 0.648 | 0.330 | 23.0 |
| 3. Trinidad and Tobago | 0.0 | 3.2 | 1.3 | 0.0 | 0.0 | −100.0 |
| 4. Qatar | 0.0 | 3.4 | 0.0 | 0.0 | 0.0 | |
| 5. China | 2.2 | 0.0 | 0.0 | 0.0 | 0.0 | |
|
Source: Global trade tracker, 2024 *CAGR: Compound Annual Growth Rate |
||||||
| Country | 2019 | 2020 | 2021 | 2022 | 2023 | CAGR* % 2019-2023 |
|---|---|---|---|---|---|---|
| Total - Exports of germ of cereals | 35,695.5 | 27,480.9 | 30,762.6 | 32,956.3 | 30,062.4 | −4.2 |
| 1. United States | 35,691.4 | 27,468.0 | 30,759.9 | 32,955.1 | 30,061.8 | −4.2 |
| 2. France | 0.261 | 0.868 | 0.869 | 1.2 | 0.601 | 23.2 |
| 3. Trinidad and Tobago | 0.0 | 5.8 | 1.8 | 0.0 | 0.0 | −100.0 |
| 4. Qatar | 0.0 | 6.3 | 0.0 | 0.0 | 0.0 | |
| 5. China | 3.9 | 0.0 | 0.0 | 0.0 | 0.0 | |
|
Source: Global trade tracker, 2024 *CAGR: Compound Annual Growth Rate |
||||||
Retail sales and market sizes
Global view - malt and malt extract
In 2023, volume sales of malt totaled 26.2 million tonnes across the world with off-trade retail sales accounting for 80.3% (21.1 million tonnes) and the remainder 19.7% (5.2 million tonnes) in on-trade (foodservice) sales based on retailer selling price (RSP). Total on-trade volume sales have suffered the most over the pandemic declining by a CAGR of 0.5% (2018-2023), while off-trade sales have historically increased by a CAGR of 1.5%; with both sectors expected to grow almost equally by an overall CAGR of 2.6% over the forecast period between 2023 and 2028.
99.6% of all malt ingredients found within alcoholic drinks goes into beer products. Lager (91.9%) contains the highest volume of malt as an ingredient, followed by dark beer (4.0%), non/low alcohol beer (2.7%), Stout (0.9%), malt-based RTDs (0.3%), and bourbon or other US Whisky (0.2%). Global consumption of malt products was equivalent to 3.3 tonnes per '000 people in 2023. The Czech Republic was the largest consumer of malt products at 18 tonnes (per '000 people), followed by Germany (14.9 tonnes), Austria (14.1 tonnes), Croatia (12.7 tonnes), and Poland (11.7 tonnes); The US (9.2 tonnes) and Canada (7.3 tonnes) were the 23rd and 39th largest consumers of malt products, respectively in 2023.
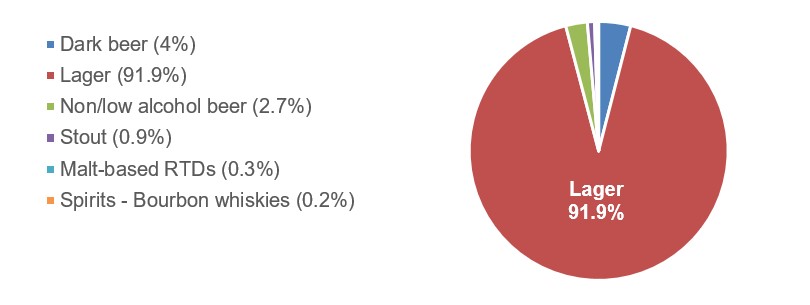
Description of above image
- Dark beer: 4%
- Lager: 91.9%
- Non/low alcohol beer: 2.7%
- Stout: 0.9%
- Malt-based ready-to-drinks: 0.3%
- Spirits - Bourbon whiskies: 0.2%
| Region | 2018 | 2023 | CAGR* % 2018-2023 | 2024 | 2028 | CAGR* % 2023-2028 | |
|---|---|---|---|---|---|---|---|
| World (Total) | Off-trade | 19,557.1 | 21,073.8 | 1.5 | 21,672.4 | 24,024.2 | 2.7 |
| On-trade | 5,283.1 | 5,159.4 | −0.5 | 5,415.8 | 5,789.2 | 2.3 | |
| Total | 24,840.1 | 26,233.2 | 1.1 | 27,088.2 | 29,813.4 | 2.6 | |
| Asia Pacific | Off-trade | 6,819.6 | 7,305.6 | 1.4 | 7,631.3 | 8,467.6 | 3.0 |
| On-trade | 1,926.4 | 1,787.2 | −1.5 | 1,918.1 | 2,286.7 | 5.1 | |
| Total | 8,745.9 | 9,092.8 | 0.8 | 9,549.4 | 10,754.3 | 3.4 | |
| Australasia | Off-trade | 181.6 | 196.9 | 1.6 | 200.9 | 214.4 | 1.7 |
| On-trade | 51.5 | 46.1 | −2.2 | 47.7 | 52.9 | 2.8 | |
| Total | 233.1 | 242.9 | 0.8 | 248.6 | 267.3 | 1.9 | |
| Eastern Europe | Off-trade | 2,467.3 | 2,468.7 | 0.0 | 2,497.6 | 2,618.0 | 1.2 |
| On-trade | 348.9 | 302.6 | −2.8 | 315.8 | 359.9 | 3.5 | |
| Total | 2,816.3 | 2,771.3 | −0.3 | 2,813.4 | 2,977.9 | 1.4 | |
| Latin America | Off-trade | 3,190.9 | 3,993.2 | 4.6 | 4,151.2 | 5,146.2 | 5.2 |
| On-trade | 852.7 | 980.5 | 2.8 | 1,027.5 | 806.5 | −3.8 | |
| Total | 4,043.5 | 4,973.7 | 4.2 | 5,178.8 | 5,952.6 | 3.7 | |
| Middle Eastern and Africa | Off-trade | 1,221.0 | 1,433.9 | 3.3 | 1,501.1 | 1,803.5 | 4.7 |
| On-trade | 364.5 | 398.0 | 1.8 | 416.9 | 499.1 | 4.6 | |
| Total | 1,585.5 | 1,832.0 | 2.9 | 1,918.0 | 2,302.6 | 4.7 | |
| North America | Off-trade | 2,566.7 | 2,516.3 | −0.4 | 2,523.7 | 2,568.2 | 0.4 |
| On-trade | 918.5 | 857.3 | −1.4 | 872.6 | 904.9 | 1.1 | |
| Total | 3,485.2 | 3,373.6 | −0.6 | 3,396.3 | 3,473.2 | 0.6 | |
| Western Europe | Off-trade | 3,110.1 | 3,159.2 | 0.3 | 3,166.6 | 3,206.4 | 0.3 |
| On-trade | 820.6 | 787.7 | −0.8 | 817.2 | 879.1 | 2.2 | |
| Total | 3,930.6 | 3,947.0 | 0.1 | 3,983.7 | 4,085.6 | 0.7 | |
|
Source: Euromonitor International, 2024 *CAGR: Compound Annual Growth Rate |
|||||||
The top regions with the highest volume sales of malt were Asia Pacific at a total of 9.1 million tonnes in 2023 (within top 10: including China, Vietnam, Japan); followed by Latin America at 5.0 million tonnes (Brazil, Mexico), Western Europe at 3.9 million tonnes (Germany, United Kingdom, Spain), North America at 3.4 million tonnes (91.5% from the United States), and Eastern Europe at 2.8 million tonnes (Russia). Volume sales of malt totalled 1.8 million tonnes in the Middle Eastern and Africa (MENA) region and the Australasia region totalled volume sales of 242.9 thousand tonnes in 2023. Canada was the 19th largest market for sales of malt over the year at a total off/on-trade volume of 287.2 thousand tonnes.
| Region | 2018 | 2023 | CAGR* % 2018-2023 | 2024 | 2028 | CAGR* % 2023-2028 | |
|---|---|---|---|---|---|---|---|
| World - malt | Off-trade | 19,557.1 | 21,073.8 | 1.5 | 21,672.4 | 24,024.2 | 2.7 |
| On-trade | 5,283.1 | 5,159.4 | −0.5 | 5,415.8 | 5,789.2 | 2.3 | |
| Total | 24,840.1 | 26,233.2 | 1.1 | 27,088.2 | 29,813.4 | 2.6 | |
| 1. China | Off-trade | 4,524.3 | 4,680.1 | 0.7 | 4,859.2 | 5,093.0 | 1.7 |
| On-trade | 1,246.1 | 1,149.8 | −1.6 | 1,217.5 | 1,345.5 | 3.2 | |
| Total | 5,770.4 | 5,829.9 | 0.2 | 6,076.7 | 6,438.5 | 2.0 | |
| 2. United States | Off-trade | 2,334.9 | 2,298.6 | −0.3 | 2,308.6 | 2,355.5 | 0.5 |
| On-trade | 840.1 | 787.8 | −1.3 | 801.1 | 828.5 | 1.0 | |
| Total | 3,175.0 | 3,086.4 | −0.6 | 3,109.7 | 3,184.1 | 0.6 | |
| 3. Brazil | Off-trade | 1,149.0 | 1,530.5 | 5.9 | 1,589.7 | 2,198.1 | 7.5 |
| On-trade | 406.9 | 485.5 | 3.6 | 503.5 | 187.7 | −17.3 | |
| Total | 1,556.0 | 2,015.9 | 5.3 | 2,093.2 | 2,385.8 | 3.4 | |
| 4. Mexico | Off-trade | 836.6 | 1,023.3 | 4.1 | 1,064.6 | 1,217.2 | 3.5 |
| On-trade | 221.5 | 246.1 | 2.1 | 258.6 | 297.0 | 3.8 | |
| Total | 1,058.1 | 1,269.4 | 3.7 | 1,323.2 | 1,514.2 | 3.6 | |
| 5. Germany | Off-trade | 1,063.8 | 1,014.3 | −0.9 | 1,006.5 | 976.0 | −0.8 |
| On-trade | 264.7 | 243.4 | −1.7 | 246.8 | 247.8 | 0.4 | |
| Total | 1,328.6 | 1,257.8 | −1.1 | 1,253.4 | 1,223.8 | −0.5 | |
| 6. Russia | Off-trade | 933.7 | 1,022.6 | 1.8 | 1,027.9 | 1,054.8 | 0.6 |
| On-trade | 101.8 | 94.8 | −1.4 | 97.0 | 103.4 | 1.8 | |
| Total | 1,035.5 | 1,117.4 | 1.5 | 1,124.9 | 1,158.2 | 0.7 | |
| 7. Vietnam | Off-trade | 374.0 | 533.0 | 7.3 | 586.7 | 810.5 | 8.7 |
| On-trade | 168.5 | 162.4 | −0.7 | 186.6 | 285.8 | 12.0 | |
| Total | 542.4 | 695.4 | 5.1 | 773.3 | 1,096.3 | 9.5 | |
| 8. United Kingdom | Off-trade | 476.7 | 484.0 | 0.3 | 481.7 | 491.6 | 0.3 |
| On-trade | 132.5 | 119.4 | −2.1 | 123.8 | 133.5 | 2.3 | |
| Total | 609.3 | 603.4 | −0.2 | 605.5 | 625.0 | 0.7 | |
| 9. Japan | Off-trade | 586.3 | 514.6 | −2.6 | 504.4 | 458.0 | −2.3 |
| On-trade | 111.1 | 75.1 | −7.5 | 76.8 | 75.9 | 0.2 | |
| Total | 697.4 | 589.7 | −3.3 | 581.2 | 533.9 | −2.0 | |
| 10. Spain | Off-trade | 384.4 | 403.6 | 1.0 | 405.8 | 432.3 | 1.4 |
| On-trade | 113.4 | 117.7 | 0.7 | 124.3 | 145.3 | 4.3 | |
| Total | 497.8 | 521.4 | 0.9 | 530.0 | 577.6 | 2.1 | |
| Sub-total (top 10 markets) | Off-trade | 12,663.7 | 13,504.6 | 1.3 | 13,835.1 | 15,087.0 | 2.2 |
| On-trade | 3,606.6 | 3,482.0 | −0.7 | 3,636.0 | 3,650.4 | 0.9 | |
| Total | 16,270.5 | 16,986.7 | 0.9 | 17,471.1 | 18,737.4 | 2.0 | |
| Canada (19th) | Off-trade | 231.8 | 217.7 | −1.2 | 215.1 | 212.7 | −0.5 |
| On-trade | 78.4 | 69.5 | −2.4 | 71.5 | 76.4 | 1.9 | |
| Total | 310.2 | 287.2 | −1.5 | 286.6 | 289.1 | 0.1 | |
|
Source: Euromonitor International, 2024 *CAGR: Compound Annual Growth Rate |
|||||||
In 2023, volume sales of malt extract totaled 286.2 thousand tonnes across the world with off-trade retail sales accounting for 80.1% (229.3 thousand tonnes) and the remainder 19.9% (56.9 thousand tonnes) in on-trade foodservice sales. The regions in order of the highest volume sales of malt extract were Asia Pacific (132.5 thousand tonnes), MENA (36.3 thousand tonnes), followed by North America (33.8 thousand tonnes), Latin America (33.2 thousand tonnes), Western Europe (32.8 thousand tonnes), Eastern Europe (12.3 thousand tonnes), and Australasia (5.2 thousand tonnes) in 2023. Top global markets for volume sales of malt extract over the year were India, the US, Nigeria, Brazil and the United Kingdom (UK). Canada ranked as the 20th largest market at volume sales of 3.3 thousand tonnes in 2023.
| Region | 2018 | 2023 | CAGR* % 2018-2023 | 2024 | 2028 | CAGR* % 2023-2028 | |
|---|---|---|---|---|---|---|---|
| World - malt extract | Off-trade | 204,491.1 | 229,313.4 | 2.3 | 234,788.8 | 262,007.8 | 2.7 |
| On-trade | 57,647.2 | 56,888.5 | −0.3 | 59,476.3 | 65,958.0 | 3.0 | |
| Total | 262,138.4 | 286,201.9 | 1.8 | 294,265.1 | 327,965.8 | 2.8 | |
| 1. India | Off-trade | 42,796.9 | 54,574.5 | 5.0 | 56,968.3 | 66,387.2 | 4.0 |
| On-trade | 11,954.0 | 12,140.5 | 0.3 | 12,991.5 | 16,387.8 | 6.2 | |
| Total | 54,750.9 | 66,715.0 | 4.0 | 69,959.8 | 82,775.1 | 4.4 | |
| 2. United States | Off-trade | 22,443.4 | 22,704.1 | 0.2 | 22,993.3 | 24,321.9 | 1.4 |
| On-trade | 8,075.2 | 7,781.7 | −0.7 | 7,978.4 | 8,555.0 | 1.9 | |
| Total | 30,518.6 | 30,485.8 | 0.0 | 30,971.7 | 32,876.9 | 1.5 | |
| 3. Nigeria | Off-trade | 9,717.8 | 11,980.7 | 4.3 | 12,718.4 | 16,410.7 | 6.5 |
| On-trade | 2,990.1 | 3,607.4 | 3.8 | 3,873.1 | 5,178.4 | 7.5 | |
| Total | 12,707.9 | 15,588.0 | 4.2 | 16,591.5 | 21,589.1 | 6.7 | |
| 4. Brazil | Off-trade | 9,708.7 | 11,245.5 | 3.0 | 11,657.2 | 16,218.3 | 7.6 |
| On-trade | 3,438.5 | 3,567.0 | 0.7 | 3,692.0 | 1,385.0 | −17.2 | |
| Total | 13,147.1 | 14,812.5 | 2.4 | 15,349.1 | 17,603.3 | 3.5 | |
| 5. United Kingdom | Off-trade | 8,649.4 | 8,768.2 | 0.3 | 8,616.4 | 8,405.1 | −0.8 |
| On-trade | 2,404.4 | 2,162.7 | −2.1 | 2,214.1 | 2,281.9 | 1.1 | |
| Total | 11,053.8 | 10,930.9 | −0.2 | 10,830.5 | 10,687.0 | −0.5 | |
| 6. China | Off-trade | 7,609.8 | 8,209.9 | 1.5 | 8,299.5 | 8,644.2 | 1.0 |
| On-trade | 2,095.9 | 2,016.9 | −0.8 | 2,079.4 | 2,283.8 | 2.5 | |
| Total | 9,705.7 | 10,226.8 | 1.1 | 10,378.9 | 10,928.0 | 1.3 | |
| 7. Malaysia | Off-trade | 6,292.6 | 6,593.2 | 0.9 | 6,729.5 | 7,613.1 | 2.9 |
| On-trade | 2,711.5 | 2,314.0 | −3.1 | 2,449.6 | 2,866.9 | 4.4 | |
| Total | 9,004.1 | 8,907.2 | −0.2 | 9,179.1 | 10,480.0 | 3.3 | |
| 8. Japan | Off-trade | 6,706.6 | 7,398.0 | 2.0 | 7,317.6 | 7,184.5 | −0.6 |
| On-trade | 1,271.0 | 1,079.6 | −3.2 | 1,113.9 | 1,190.6 | 2.0 | |
| Total | 7,977.6 | 8,477.6 | 1.2 | 8,431.6 | 8,375.1 | −0.2 | |
| 9. Indonesia | Off-trade | 5,875.0 | 6,661.5 | 2.5 | 6,832.6 | 7,503.1 | 2.4 |
| On-trade | 1,244.3 | 1,477.5 | 3.5 | 1,522.8 | 1,760.5 | 3.6 | |
| Total | 7,119.3 | 8,139.0 | 2.7 | 8,355.4 | 9,263.5 | 2.6 | |
| 10. Russia | Off-trade | 7,486.0 | 6,727.4 | −2.1 | 6,882.4 | 7,362.8 | 1.8 |
| On-trade | 816.1 | 623.9 | −5.2 | 649.4 | 721.8 | 3.0 | |
| Total | 8,302.1 | 7,351.2 | −2.4 | 7,531.8 | 8,084.6 | 1.9 | |
| Sub-total (top 10 markets) | Off-trade | 127,286.2 | 144,863.0 | 2.6 | 149,015.2 | 170,050.9 | 3.3 |
| On-trade | 37,001.0 | 36,771.2 | −0.1 | 38,564.2 | 42,611.7 | 3.0 | |
| Total | 164,287.1 | 181,634.0 | 2.0 | 187,579.4 | 212,662.6 | 3.2 | |
| Canada (20th) | Off-trade | 2,620.8 | 2,536.8 | −0.6 | 2,450.4 | 2,207.9 | −2.7 |
| On-trade | 886.0 | 809.6 | −1.8 | 814.9 | 792.8 | −0.4 | |
| Total | 3,506.9 | 3,346.4 | −0.9 | 3,265.3 | 3,000.8 | −2.2 | |
|
Source: Euromonitor International, 2024 *CAGR: Compound Annual Growth Rate |
|||||||
Global view - beer
In 2022, global sales of beer (including dark beer, lager, stout, non/low alcohol) totaled US$711.6 billion (200.0 billion litres) consisting of off-trade retail sales at US$324.6 billion (133.3 billion litres) and on-trade or foodservice sales at US$387.0 billion (66.8 billion litres) based on retailer selling prices (RSP). Total retail value sales of beer in the world have been growing by a CAGR of 6.5% (2017 to 2022), while foodservice sales have historically increased by approximately half this rate at a CAGR of 3.1%. However, the foodservice sector is expected to recover from the impact of the pandemic, where both off/on-trade sectors are forecast to grow by a CAGR of 8.6% and 10.6%, respectively (2022 to 2027).
The United States was the largest consumer of beer beverages in terms of off/on-trade value at a total of US$114.2 billion (22,518.3 million litres) in 2022. Anheuser-Busch InBev NV was the leading American player with a total volume share of 41% in 2022. Total value growth in off/on-trade beer sales in the US turned to a decline of −15.4% starting in 2020, reaching US$88.7 million from US$104.9 billion in 2019; which returned to higher sales in 2022, registering a total value sales growth of 2.0% (2017 to 2022) - set to slightly improve by a CAGR of 4.2% over the forecast period (2022 to 2027) to reach sales of US$140.3 billion (22.9 billion litres) in 2027. Non/low alcohol beer was the best performing category in 2022, with total volume sales increasing by 12% to reach 271 million litres. In the last five years, non-alcoholic beer in the US has shown growth unmatched by any other beer category, holding a place of its own in the sector aided by technological improvements and aggressive marketing efforts with the introduction of award-winning new products that is often trailblazing over its alcoholic counterparts. Coupled with a growing consumer desire for health and mindfulness, the non-alcoholic beer category is believed to continue to grow aggressively in a short period of time. The Boston Beer Company made recent headway with a hazy and hop-forward offering, while Athletic Brewing is unique with no comparable peers in the craft non-alcoholic beer space.Footnote 1
China was the 2nd largest consumer of beer beverages with a total off/on-trade value of US$103.1 billion (43,104.9 million litres) in 2022. Stout was the best performing category in 2022, with total volume sales still decreasing by 1% to reach 376 million litres. China Resources Beer (Holdings) Company Ltd. was the leading player with a total volume sales share of 25% in 2022. Total value sales first decreased by 5.1% in 2020 down to US$91.5 billion from US$96.5 billion in 2019, yet has historically grown by a CAGR of 3.9% (2017 to 2022) and is set to grow by a CAGR of 9.6% over the forecast period (2022 to 2027) to reach US$163.0 billion by 2027. Historically, off-trade retail sales in China grew by a CAGR of 6.5%, while on-trade foodservice sales grew by a CAGR of 2.6%. Albeit, foodservice volumes - which accounted for half of total beer volumes in China in 2021 - declined at a double-digit rate in 2022 due to lockdowns as a result of the wide spread of the second wave of the Omicron variant of COVID-19. Meanwhile, with a hotter summer season than usual and the stress and anxiety from spending more time at home, the demand for alcoholic beer drinks increased with boosted volume sales being in the retail channel. The expansion of the online-to-offline (O2O) commerce channel, was a business strategy that also drew in more sales in retail convenience stores, supermarkets, etc. Nevertheless, the rise in off-trade sales was not enough to completely offset the on-trade decline, which led to a total volume decline in 2022 by 3% to 43 billion litres.Footnote 2
Brazil was the 3rd largest consumer of beer beverages with a total off/on-trade value of US$56.2 billion (15,098.5 million litres) in 2022. Non/low alcohol beer was the best performing category in 2022, with total volume sales rising by 38% to reach 394 million litres. Cia Brasileira de Bebidas was the leading Brazilian player in 2022, with a total volume share of 62%. Total volume sales of beer rose by 5% in 2022 to 15.1 billion litres, which is set to increase at a CAGR of 3.6% over the forecast period to reach 18 billion litres. Total value sales of beer continued to show resilience and achieve total growth in 2020 to US$35.7 billion, historically growing by a CAGR of 15.9% (2017 to 2022), which is set to grow by a CAGR of 14% over the forecast period (2022 to 2027) to reach US$108.2 billion by 2027. The quick return of socialization and ongoing events, played a significant role in sustaining growth momentum, especially with continued consumption in the on-trade sector. However, despite the positive trend, the category now faces a potential threat due to the impact of inflation and rising living costs exerting added pressure on consumers' wallets, particularly amongst the middle-classes. Beer is likely to retain its position as the top Brazilian consumers choice amongst alcoholic drinks, yet the disposable income share dedicated to beer is expected to decline. Simultaneously, companies are strategizing by increasingly investing in premium categories to possibly strengthen their bottom lines.Footnote 3
| Category | 2017 | 2022 | CAGR* % 2017-2022 | 2023 | 2027 | CAGR* % 2022-2027 | |
|---|---|---|---|---|---|---|---|
| Beer[1] (Total) | Off-trade | 236,876.6 | 324,616.7 | 6.5 | 359,550.3 | 491,491.7 | 8.6 |
| On-trade | 332,757.8 | 386,957.4 | 3.1 | 446,615.1 | 640,376.6 | 10.6 | |
| Total | 569,634.4 | 711,574.1 | 4.6 | 806,165.4 | 1,131,868.4 | 9.7 | |
| Dark beer | Off-trade | 17,748.7 | 23,873.5 | 6.1 | 25,336.4 | 32,783.1 | 6.5 |
| On-trade | 33,924.0 | 40,041.8 | 3.4 | 46,725.5 | 68,954.7 | 11.5 | |
| Total | 51,672.7 | 63,915.4 | 4.3 | 72,061.9 | 101,737.8 | 9.7 | |
| - Ale | Off-trade | 11,229.6 | 15,255.6 | 6.3 | 16,230.2 | 19,239.3 | 4.7 |
| On-trade | 21,647.5 | 23,833.4 | 1.9 | 26,984.4 | 30,997.5 | 5.4 | |
| Total | 32,877.1 | 39,089.0 | 3.5 | 43,214.6 | 50,236.8 | 5.1 | |
| - Sorghum | Off-trade | 1,300.1 | 1,333.6 | 0.5 | 1,358.6 | 1,648.0 | 4.3 |
| On-trade | 461.9 | 596.2 | 5.2 | 644.5 | 874.3 | 8.0 | |
| Total | 1,762.0 | 1,929.8 | 1.8 | 2,003.1 | 2,522.3 | 5.5 | |
| - Weissbier/Weizen/wheat beer | Off-trade | 5,219.0 | 7,284.3 | 6.9 | 7,747.6 | 11,895.7 | 10.3 |
| On-trade | 11,814.6 | 15,612.3 | 5.7 | 19,096.6 | 37,082.9 | 18.9 | |
| Total | 17,033.6 | 22,896.6 | 6.1 | 26,844.2 | 48,978.7 | 16.4 | |
| Lager | Off-trade | 209,970.0 | 285,747.5 | 6.4 | 316,981.5 | 431,309.0 | 8.6 |
| On-trade | 282,060.5 | 324,873.0 | 2.9 | 374,621.3 | 534,204.9 | 10.5 | |
| Total | 492,030.4 | 610,620.5 | 4.4 | 691,602.8 | 965,513.9 | 9.6 | |
| - Flavoured/mixed lager | Off-trade | 5,181.8 | 8,067.7 | 9.3 | 9,056.5 | 12,037.9 | 8.3 |
| On-trade | 4,405.2 | 5,195.1 | 3.4 | 5,694.2 | 7,309.3 | 7.1 | |
| Total | 9,587.0 | 13,262.8 | 6.7 | 14,750.7 | 19,347.2 | 7.8 | |
| - Domestic Lager | Off-trade | 177,530.3 | 240,237.8 | 6.2 | 266,799.0 | 364,293.6 | 8.7 |
| On-trade | 240,192.1 | 277,169.1 | 2.9 | 319,970.9 | 457,747.0 | 10.6 | |
| Total | 417,722.4 | 517,406.9 | 4.4 | 586,769.8 | 822,040.6 | 9.7 | |
| - Imported Lager | Off-trade | 27,257.8 | 37,442.0 | 6.6 | 41,126.0 | 54,977.5 | 8.0 |
| On-trade | 37,463.2 | 42,508.8 | 2.6 | 48,956.2 | 69,148.6 | 10.2 | |
| Total | 64,721.0 | 79,950.8 | 4.3 | 90,082.3 | 124,126.2 | 9.2 | |
| Non/low alcohol beer | Off-trade | 6,259.2 | 11,077.2 | 12.1 | 12,951.6 | 21,413.4 | 14.1 |
| On-trade | 7,738.0 | 9,768.3 | 4.8 | 11,286.0 | 16,952.6 | 11.7 | |
| Total | 13,997.2 | 20,845.5 | 8.3 | 24,237.6 | 38,366.0 | 13.0 | |
| Stout | Off-trade | 2,898.7 | 3,918.5 | 6.2 | 4,280.7 | 5,986.3 | 8.8 |
| On-trade | 9,035.4 | 12,274.3 | 6.3 | 13,982.3 | 20,264.4 | 10.5 | |
| Total | 11,934.1 | 16,192.8 | 6.3 | 18,263.1 | 26,250.6 | 10.1 | |
|
Source: Euromonitor International, 2024 *CAGR: Compound Annual Growth Rate 1: Sales value - Retailer selling price (RSP) |
|||||||
In terms of Canada's performance, the country was the 10th largest consumer of beer beverages in terms of total off/on-trade value sales US$13.3 billion (17th largest market - volume: 2,253.9 million litres) in 2022. The most dynamic growth and the best performing category in 2022 has been in non/low alcohol beer, with total volume Canadian sales growing by 21% to 46 million litres. Labatt Brewing Company Ltd. was the leading player in 2022, with a total volume share of 41%. Total volume sales of beer fell by 1% in 2022 to 2.3 billion litres, which is set to continue to fall at a CAGR of 0.03% over the forecast period to remain around 2.3 billion litres. Total value sales first decreased by 10.1% in 2020 down to US$12.4 billion from US$13.8 billion in 2019, and has historically declined by a CAGR of 0.3% (2017 to 2022) and is set to grow by a CAGR of 3.2% over the forecast period (2022 to 2027) to reach US$15.5 billion by 2027. Beer continues to lose market share to other types of alcoholic drinks, most notably ready-to-drink (RTDs) and spirits. The young population of the country is gradually moving away from beer to more innovative and exciting product offerings. Increasing health consciousness is driving the non-alcoholic beer category, which discourages alcohol consumption amongst consumers. Non-alcohol beer is gaining shelf space in grocery retailers and convenience stores, however, due to its small market size, it has not contributed overall to the growth of the beer market.Footnote 4
| Category | 2017 | 2022 | CAGR* % 2017-2022 | 2023 | 2027 | CAGR* % 2022-2027 | |
|---|---|---|---|---|---|---|---|
| Beer[1] (Total) | Off-trade | 122,041.8 | 133,275.3 | 1.8 | 136,460.2 | 148,975.2 | 2.3 |
| On-trade | 72,585.2 | 66,765.1 | −1.7 | 71,111.0 | 81,557.4 | 4.1 | |
| Total | 194,627.0 | 200,040.4 | 0.6 | 207,571.2 | 230,532.6 | 2.9 | |
| Dark beer | Off-trade | 5,667.8 | 6,169.3 | 1.7 | 6,171.3 | 6,739.7 | 1.8 |
| On-trade | 3,657.7 | 3,562.3 | −0.5 | 3,815.9 | 4,706.5 | 5.7 | |
| Total | 9,325.5 | 9,731.6 | 0.9 | 9,987.3 | 11,446.2 | 3.3 | |
| - Ale | Off-trade | 2,728.7 | 3,233.2 | 3.5 | 3,255.5 | 3,479.3 | 1.5 |
| On-trade | 2,073.8 | 1,866.2 | −2.1 | 1,981.3 | 2,108.1 | 2.5 | |
| Total | 4,802.6 | 5,099.4 | 1.2 | 5,236.8 | 5,587.4 | 1.8 | |
| - Sorghum | Off-trade | 1,280.7 | 1,099.6 | −3.0 | 1,091.9 | 1,114.5 | 0.3 |
| On-trade | 443.0 | 423.8 | −0.9 | 425.8 | 454.4 | 1.4 | |
| Total | 1,723.7 | 1,523.4 | −2.4 | 1,517.6 | 1,568.9 | 0.6 | |
| - Weissbier/Weizen/wheat beer | Off-trade | 1,658.4 | 1,836.5 | 2.1 | 1,824.0 | 2,145.8 | 3.2 |
| On-trade | 1,140.8 | 1,272.2 | 2.2 | 1,408.8 | 2,144.1 | 11.0 | |
| Total | 2,799.2 | 3,108.7 | 2.1 | 3,232.8 | 4,289.9 | 6.7 | |
| Lager | Off-trade | 111,866.5 | 121,606.1 | 1.7 | 124,510.7 | 134,911.2 | 2.1 |
| On-trade | 65,937.6 | 60,062.5 | −1.8 | 63,934.4 | 72,638.0 | 3.9 | |
| Total | 177,804.1 | 181,668.6 | 0.4 | 188,445.1 | 207,549.2 | 2.7 | |
| - Flavoured/mixed lager | Off-trade | 2,291.9 | 3,250.9 | 7.2 | 3,392.2 | 3,923.6 | 3.8 |
| On-trade | 652.3 | 689.5 | 1.1 | 708.0 | 816.1 | 3.4 | |
| Total | 2,944.2 | 3,940.4 | 6.0 | 4,100.2 | 4,739.7 | 3.8 | |
| - Domestic Lager | Off-trade | 102,096.7 | 109,758.7 | 1.5 | 112,336.4 | 121,049.5 | 2.0 |
| On-trade | 62,113.5 | 56,276.0 | −2.0 | 59,924.0 | 67,880.7 | 3.8 | |
| Total | 164,210.2 | 166,034.7 | 0.2 | 172,260.4 | 188,930.2 | 2.6 | |
| - Imported Lager | Off-trade | 7,477.9 | 8,596.5 | 2.8 | 8,782.1 | 9,938.1 | 2.9 |
| On-trade | 3,171.7 | 3,097.0 | −0.5 | 3,302.4 | 3,941.2 | 4.9 | |
| Total | 10,649.7 | 11,693.5 | 1.9 | 12,084.5 | 13,879.3 | 3.5 | |
| Non/low alcohol beer | Off-trade | 3,754.3 | 4,633.8 | 4.3 | 4,890.1 | 6,280.6 | 6.3 |
| On-trade | 1,845.2 | 1,869.9 | 0.3 | 1,998.4 | 2,491.2 | 5.9 | |
| Total | 5,599.5 | 6,503.6 | 3.0 | 6,888.4 | 8,771.8 | 6.2 | |
| Stout | Off-trade | 753.2 | 866.1 | 2.8 | 888.1 | 1,043.6 | 3.8 |
| On-trade | 1,144.8 | 1,270.5 | 2.1 | 1,362.3 | 1,721.7 | 6.3 | |
| Total | 1,898.0 | 2,136.6 | 2.4 | 2,250.4 | 2,765.4 | 5.3 | |
|
Source: Euromonitor International, 2024 *CAGR: Compound Annual Growth Rate 1: Sales value - Retailer selling price (RSP) |
|||||||
| Region | 2017 | 2022 | CAGR* % 2017-2022 | 2023 | 2027 | CAGR* % 2022-2027 | |
|---|---|---|---|---|---|---|---|
| World - Beer | Off-trade | 236,876.6 | 324,616.7 | 6.5 | 359,550.3 | 491,491.7 | 8.6 |
| On-trade | 332,757.8 | 386,957.4 | 3.1 | 446,615.1 | 640,376.6 | 10.6 | |
| Total | 569,634.4 | 711,574.1 | 4.6 | 806,165.4 | 1,131,868.4 | 9.7 | |
| 1. United States | Off-trade | 48,959.8 | 55,792.5 | 2.6 | 58,603.4 | 66,159.3 | 3.5 |
| On-trade | 54,651.3 | 58,362.1 | 1.3 | 64,818.3 | 74,122.1 | 4.9 | |
| Total | 103,611.1 | 114,154.6 | 2.0 | 123,421.7 | 140,281.3 | 4.2 | |
| 2. China | Off-trade | 28,204.2 | 38,648.9 | 6.5 | 42,979.1 | 53,934.8 | 6.9 |
| On-trade | 56,827.7 | 64,468.3 | 2.6 | 75,347.1 | 109,074.4 | 11.1 | |
| Total | 85,031.9 | 103,117.3 | 3.9 | 118,326.2 | 163,009.2 | 9.6 | |
| 3. Brazil | Off-trade | 6,549.0 | 16,504.9 | 20.3 | 20,053.9 | 35,835.4 | 16.8 |
| On-trade | 20,281.6 | 39,666.4 | 14.4 | 45,770.4 | 72,371.8 | 12.8 | |
| Total | 26,830.6 | 56,171.4 | 15.9 | 65,824.3 | 108,207.2 | 14.0 | |
| 4. Mexico | Off-trade | 10,408.6 | 18,025.8 | 11.6 | 20,018.8 | 27,208.1 | 8.6 |
| On-trade | 9,723.6 | 14,382.3 | 8.1 | 16,329.7 | 22,125.5 | 9.0 | |
| Total | 20,132.2 | 32,408.0 | 10.0 | 36,348.5 | 49,333.6 | 8.8 | |
| 5. Germany | Off-trade | 8,056.4 | 8,978.5 | 2.2 | 9,494.4 | 10,267.4 | 2.7 |
| On-trade | 22,133.8 | 22,814.4 | 0.6 | 24,669.8 | 26,730.7 | 3.2 | |
| Total | 30,190.2 | 31,792.9 | 1.0 | 34,164.2 | 36,998.1 | 3.1 | |
| 6. United Kingdom | Off-trade | 8,552.8 | 11,792.8 | 6.6 | 12,646.0 | 14,379.9 | 4.0 |
| On-trade | 17,432.3 | 18,558.0 | 1.3 | 20,674.9 | 24,409.7 | 5.6 | |
| Total | 25,985.2 | 30,350.8 | 3.2 | 33,320.9 | 38,789.6 | 5.0 | |
| 7. Japan | Off-trade | 16,359.1 | 16,248.9 | −0.1 | 16,836.2 | 16,012.9 | −0.3 |
| On-trade | 14,503.6 | 8,068.0 | −11.1 | 9,501.5 | 9,743.2 | 3.8 | |
| Total | 30,862.7 | 24,316.9 | −4.7 | 26,337.7 | 25,756.1 | 1.2 | |
| 8. Russia | Off-trade | 9,618.0 | 14,409.1 | 8.4 | 15,759.6 | 20,095.6 | 6.9 |
| On-trade | 4,188.8 | 5,159.1 | 4.3 | 5,603.7 | 7,248.9 | 7.0 | |
| Total | 13,806.8 | 19,568.2 | 7.2 | 21,363.3 | 27,344.5 | 6.9 | |
| 9. Spain | Off-trade | 2,253.6 | 2,628.7 | 3.1 | 2,855.4 | 3,278.4 | 4.5 |
| On-trade | 12,949.1 | 14,056.8 | 1.7 | 15,517.4 | 19,300.5 | 6.5 | |
| Total | 15,202.8 | 16,685.5 | 1.9 | 18,372.8 | 22,578.9 | 6.2 | |
| 10. Canada | Off-trade | 7,642.8 | 8,088.2 | 1.1 | 8,240.1 | 8,716.3 | 1.5 |
| On-trade | 5,861.5 | 5,194.6 | −2.4 | 5,685.2 | 6,812.3 | 5.6 | |
| Total | 13,504.4 | 13,282.8 | −0.3 | 13,925.3 | 15,528.5 | 3.2 | |
| Sub-total (top 10 markets) | Off-trade | 146,604.3 | 191,118.3 | 5.4 | 207,486.9 | 255,888.1 | 6.0 |
| On-trade | 218,553.3 | 250,730.0 | 2.8 | 283,918.0 | 371,939.1 | 8.2 | |
| Total | 365,157.9 | 441,848.4 | 3.9 | 491,404.9 | 627,827.0 | 7.3 | |
|
Source: Euromonitor International, 2024 *CAGR: Compound Annual Growth Rate |
|||||||
| Region | 2017 | 2022 | CAGR* % 2017-2022 | 2023 | 2027 | CAGR* % 2022-2027 | |
|---|---|---|---|---|---|---|---|
| World - Beer | Off-trade | 122,041.8 | 133,275.3 | 1.8 | 136,460.2 | 148,975.2 | 2.3 |
| On-trade | 72,585.2 | 66,765.1 | −1.7 | 71,111.0 | 81,557.4 | 4.1 | |
| Total | 194,627.0 | 200,040.4 | 0.6 | 207,571.2 | 230,532.6 | 2.9 | |
| 1. China | Off-trade | 22,027.7 | 23,533.9 | 1.3 | 24,788.6 | 26,848.9 | 2.7 |
| On-trade | 23,378.4 | 19,571.0 | −3.5 | 21,045.4 | 23,050.3 | 3.3 | |
| Total | 45,406.1 | 43,104.9 | −1.0 | 45,834.1 | 49,899.2 | 3.0 | |
| 2. United States | Off-trade | 17,613.4 | 16,826.3 | −0.9 | 16,611.3 | 16,795.8 | 0.0 |
| On-trade | 6,302.6 | 5,692.0 | −2.0 | 5,919.7 | 6,147.0 | 1.5 | |
| Total | 23,916.0 | 22,518.3 | −1.2 | 22,531.0 | 22,942.8 | 0.4 | |
| 3. Brazil | Off-trade | 4,678.6 | 6,372.0 | 6.4 | 6,706.0 | 8,085.4 | 4.9 |
| On-trade | 7,706.4 | 8,726.5 | 2.5 | 9,040.0 | 9,954.1 | 2.7 | |
| Total | 12,385.0 | 15,098.5 | 4.0 | 15,746.0 | 18,039.5 | 3.6 | |
| 4. Mexico | Off-trade | 6,139.3 | 7,925.7 | 5.2 | 8,267.0 | 9,543.8 | 3.8 |
| On-trade | 1,738.3 | 1,786.3 | 0.5 | 1,908.9 | 2,218.1 | 4.4 | |
| Total | 7,877.6 | 9,712.0 | 4.3 | 10,175.9 | 11,761.9 | 3.9 | |
| 5. Germany | Off-trade | 6,167.7 | 6,149.6 | −0.1 | 6,082.0 | 5,938.8 | −0.7 |
| On-trade | 3,227.7 | 3,027.1 | −1.3 | 3,061.1 | 3,020.6 | 0.0 | |
| Total | 9,395.4 | 9,176.7 | −0.5 | 9,143.1 | 8,959.4 | −0.5 | |
| 6. Russia | Off-trade | 6,542.8 | 7,433.8 | 2.6 | 7,450.0 | 7,673.4 | 0.6 |
| On-trade | 829.1 | 737.8 | −2.3 | 737.9 | 754.8 |
0.5 |
|
| Total | 7,371.9 | 8,171.6 | 2.1 | 8,187.9 | 8,428.1 | 0.6 | |
| 7. Japan | Off-trade | 4,604.8 | 4,261.4 | −1.5 | 4,043.4 | 3,674.5 | −2.9 |
| On-trade | 1,122.1 | 592.8 | −12.0 | 676.3 | 690.2 | 3.1 | |
| Total | 5,726.9 | 4,854.2 | −3.3 | 4,719.7 | 4,364.8 | −2.1 | |
| 8. United Kingdom | Off-trade | 2,234.9 | 2,517.5 | 2.4 | 2,491.9 | 2,507.5 | −0.1 |
| On-trade | 2,250.1 | 1,901.1 | −3.3 | 1,943.5 | 2,047.9 | 1.5 | |
| Total | 4,485.0 | 4,418.7 | −0.3 | 4,435.5 | 4,555.3 | 0.6 | |
| 9. Spain | Off-trade | 1,562.4 | 1,668.8 | 1.3 | 1,675.5 | 1,710.9 | 0.5 |
| On-trade | 2,188.6 | 2,218.9 | 0.3 | 2,297.4 | 2,592.6 | 3.2 | |
| Total | 3,751.0 | 3,887.7 | 0.7 | 3,972.9 | 4,303.4 | 2.1 | |
| 10. Canada | Off-trade | 1,905.6 | 1,853.8 | −0.5 | 1,823.1 | 1,771.5 | −0.9 |
| On-trade | 490.9 | 400.0 | −4.0 | 423.6 | 479.6 | 3.7 | |
| Total | 2,396.5 | 2,253.9 | −1.2 | 2,246.7 | 2,251.0 | −0.03 | |
| Sub-total (top 10 markets) | Off-trade | 73,477.2 | 78,542.8 | 1.3 | 79,938.8 | 84,550.5 | 1.5 |
| On-trade | 49,234.2 | 44,653.5 | −1.9 | 47,053.8 | 50,955.2 | 2.7 | |
| Total | 122,711.4 | 123,196.5 | 0.1 | 126,992.8 | 135,505.4 | 1.9 | |
|
Source: Euromonitor International, 2024 *CAGR: Compound Annual Growth Rate |
|||||||
Dark beer
In 2022, total off/on-trade sales of dark beer (including Ale, Sorghum, Weissbier/Weizen/Wheat Beer) was US$63.9 billion (9.7 billion litres), which consisted of US$23.9 billion (6.2 billion litres) in off-trade retail sales and US$40.0 billion (3.6 billion litres) in on-trade foodservice sales. Retail sales of dark beer grew the most at a CAGR of 6.1% compared to foodservice sales at a CAGR of 3.4% between 2017 and 2022. However, on-trade sales are forecast to turn around with a CAGR of 11.5% versus stable off-trade (6.5%) sales between 2022 and 2027.
The largest regions with the most total off/on-trade value sales of dark beer were Western Europe (US$23.2 billion), North America (US$22.7 billion), and Asia Pacific (US$9.9 billion) in 2022. Top regions with the highest total historical value growth (2017 to 2022) of dark beer were Asia Pacific (CAGR: 16.2%), followed by Latin America (13.5%), and Eastern Europe (12.8%).
Off-trade sales of dark beer brought in the most value over on-trade sales within the following regions: Australasia (off-trade share: 67.4%), Eastern Europe (73.8%), and MENA (63.2%) in 2022. Alternatively, the Asia Pacific (72.1%), Latin America (59.5%), North America (64.4%), and Western Europe (66.2%) regions registered higher sales within the on-trade sector of dark beer in 2022.
| Region | 2017 | 2022 | CAGR* % 2017-2022 | 2023 | 2027 | CAGR* % 2022-2027 | |
|---|---|---|---|---|---|---|---|
| World (Total) | Off-trade | 17,748.7 | 23,873.5 | 6.1 | 25,336.4 | 32,783.1 | 6.5 |
| On-trade | 33,924.0 | 40,041.8 | 3.4 | 46,725.5 | 68,954.7 | 11.5 | |
| Total | 51,672.7 | 63,915.4 | 4.3 | 72,061.9 | 101,737.8 | 9.7 | |
| Asia Pacific | Off-trade | 1,051.6 | 2,775.6 | 21.4 | 3,118.9 | 5,783.6 | 15.8 |
| On-trade | 3,629.7 | 7,161.1 | 14.6 | 9,832.6 | 25,947.8 | 29.4 | |
| Total | 4,681.3 | 9,936.7 | 16.2 | 12,951.5 | 31,731.4 | 26.1 | |
| Australasia | Off-trade | 917.3 | 1,447.3 | 9.5 | 1,612.5 | 2,188.1 | 8.6 |
| On-trade | 591.7 | 699.9 | 3.4 | 795.3 | 1,129.2 | 10.0 | |
| Total | 1,509.0 | 2,147.3 | 7.3 | 2,407.8 | 3,317.3 | 9.1 | |
| Eastern Europe | Off-trade | 891.9 | 1,696.9 | 13.7 | 1,890.3 | 2,511.0 | 8.2 |
| On-trade | 368.5 | 603.7 | 10.4 | 707.0 | 1,017.6 | 11.0 | |
| Total | 1,260.4 | 2,300.6 | 12.8 | 2,597.3 | 3,528.6 | 8.9 | |
| Latin America | Off-trade | 194.6 | 477.7 | 19.7 | 578.7 | 1,616.7 | 27.6 |
| On-trade | 432.8 | 702.0 | 10.2 | 839.5 | 1,501.7 | 16.4 | |
| Total | 627.5 | 1,179.7 | 13.5 | 1,418.1 | 3,118.4 | 21.5 | |
| Middle Eastern and Africa (MENA) | Off-trade | 1,406.0 | 1,528.8 | 1.7 | 1,582.4 | 1,992.3 | 5.4 |
| On-trade | 685.4 | 891.4 | 5.4 | 993.0 | 1,446.3 | 10.2 | |
| Total | 2,091.4 | 2,420.2 | 3.0 | 2,575.5 | 3,438.6 | 7.3 | |
| North America | Off-trade | 7,311.0 | 8,094.8 | 2.1 | 8,251.0 | 9,159.7 | 2.5 |
| On-trade | 13,869.3 | 14,634.9 | 1.1 | 16,660.7 | 18,040.0 | 4.3 | |
| Total | 21,180.2 | 22,729.6 | 1.4 | 24,911.7 | 27,199.7 | 3.7 | |
| Western Europe | Off-trade | 5,976.3 | 7,852.4 | 5.6 | 8,302.6 | 9,531.7 | 4.0 |
| On-trade | 14,346.7 | 15,348.9 | 1.4 | 16,897.4 | 19,872.2 | 5.3 | |
| Total | 20,323.0 | 23,201.3 | 2.7 | 25,200.0 | 29,403.8 | 4.9 | |
|
Source: Euromonitor International, 2024 *CAGR: Compound Annual Growth Rate |
|||||||
| Region | 2017 | 2022 | CAGR* % 2017-2022 | 2023 | 2027 | CAGR* % 2022-2027 | |
|---|---|---|---|---|---|---|---|
| World (Total) | Off-trade | 5,667.8 | 6,169.3 | 1.7 | 6,171.3 | 6,739.7 | 1.8 |
| On-trade | 3,657.7 | 3,562.3 | −0.5 | 3,815.9 | 4,706.5 | 5.7 | |
| Total | 9,325.5 | 9,731.6 | 0.9 | 9,987.3 | 11,446.2 | 3.3 | |
| Asia Pacific | Off-trade | 168.5 | 394.6 | 18.6 | 444.8 | 757.8 | 13.9 |
| On-trade | 265.5 | 481.0 | 12.6 | 598.4 | 1,308.4 | 22.2 | |
| Total | 434.0 | 875.6 | 15.1 | 1,043.2 | 2,066.2 | 18.7 | |
| Australasia | Off-trade | 156.9 | 223.6 | 7.3 | 233.0 | 279.6 | 4.6 |
| On-trade | 58.9 | 60.6 | 0.6 | 64.7 | 82.7 | 6.4 | |
| Total | 215.8 | 284.1 | 5.7 | 297.7 | 362.4 | 5.0 | |
| Eastern Europe | Off-trade | 370.0 | 530.3 | 7.5 | 523.4 | 563.9 | 1.2 |
| On-trade | 59.2 | 72.5 | 4.1 | 76.5 | 94.2 | 5.4 | |
| Total | 429.2 | 602.7 | 7.0 | 599.9 | 658.2 | 1.8 | |
| Latin America | Off-trade | 46.8 | 99.7 | 16.3 | 103.1 | 129.0 | 5.3 |
| On-trade | 40.6 | 57.2 | 7.1 | 61.8 | 74.4 | 5.4 | |
| Total | 87.5 | 156.9 | 12.4 | 164.9 | 203.4 | 5.3 | |
| Middle Eastern and Africa | Off-trade | 1,308.1 | 1,143.7 | −2.7 | 1,140.9 | 1,189.9 | 0.8 |
| On-trade | 484.2 | 468.3 | −0.7 | 475.6 | 527.9 | 2.4 | |
| Total | 1,792.3 | 1,612.0 | −2.1 | 1,616.5 | 1,717.8 | 1.3 | |
| North America | Off-trade | 1,643.1 | 1,661.8 | 0.2 | 1,626.8 | 1,668.8 | 0.1 |
| On-trade | 1,088.2 | 970.5 | −2.3 | 1,062.8 | 1,093.2 | 2.4 | |
| Total | 2,731.3 | 2,632.3 | −0.7 | 2,689.7 | 2,762.0 | 1.0 | |
| Western Europe | Off-trade | 1,974.3 | 2,115.6 | 1.4 | 2,099.3 | 2,150.6 | 0.3 |
| On-trade | 1,661.1 | 1,452.2 | −2.7 | 1,476.2 | 1,525.6 | 1.0 | |
| Total | 3,635.4 | 3,567.9 | −0.4 | 3,575.4 | 3,676.2 | 0.6 | |
|
Source: Euromonitor International, 2024 *CAGR: Compound Annual Growth Rate |
|||||||
In 2022, leading dark beer global markets registering the highest total on/off-trade sales were the United States at US$20.0 billion (2.3 billion litres), China at US$7.5 billion (600.1 million litres), the United Kingdom at US$6.2 billion (933.2 million litres), Germany at US$5.4 billion (1.3 billion litres), and the France at US$3.3 billion (566 million litres). Canada was the 6th largest market in terms of value sales of dark beer at US$2.7 billion (291.1 million litres) in 2022.
Within the top 10 markets in 2022, those countries with larger off-trade dark beer sales over on-trade sales were France (off-trade share: 60.4%), Canada (51.1%), and Russia (82.2%). Alternatively, the US (on-trade share: 66.5%), China (78.1%), the UK (61.9%), Germany (77.2%), Netherlands (78.6%), Belgium (72.8%), and Italy (85.5%) were regions that registered higher sales within the on-trade sector of dark beer in 2022.
| Region | 2017 | 2022 | CAGR* % 2017-2022 | 2023 | 2027 | CAGR* % 2022-2027 | |
|---|---|---|---|---|---|---|---|
| World - dark beer | Off-trade | 17,748.7 | 23,873.5 | 6.1 | 25,336.4 | 32,783.1 | 6.5 |
| On-trade | 33,924.0 | 40,041.8 | 3.4 | 46,725.5 | 68,954.7 | 11.5 | |
| Total | 51,672.7 | 63,915.4 | 4.3 | 72,061.9 | 101,737.8 | 9.7 | |
| 1. United States | Off-trade | 6,152.4 | 6,700.9 | 1.7 | 6,795.1 | 7,485.8 | 2.2 |
| On-trade | 12,497.9 | 13,322.4 | 1.3 | 15,270.0 | 16,559.8 | 4.4 | |
| Total | 18,650.3 | 20,023.3 | 1.4 | 22,065.1 | 24,045.6 | 3.7 | |
| 2. China | Off-trade | 572.5 | 1,634.1 | 23.3 | 1,877.2 | 4,180.0 | 20.7 |
| On-trade | 2,381.2 | 5,831.1 | 19.6 | 8,231.7 | 23,765.0 | 32.4 | |
| Total | 2,953.7 | 7,465.2 | 20.4 | 10,108.9 | 27,944.9 | 30.2 | |
| 3. United Kingdom | Off-trade | 1,895.8 | 2,365.4 | 4.5 | 2,544.6 | 2,867.8 | 3.9 |
| On-trade | 3,737.6 | 3,842.9 | 0.6 | 4,269.6 | 4,961.9 | 5.2 | |
| Total | 5,633.4 | 6,208.4 | 2.0 | 6,814.1 | 7,829.7 | 4.7 | |
| 4. Germany | Off-trade | 1,309.5 | 1,235.8 | −1.2 | 1,293.1 | 1,346.1 | 1.7 |
| On-trade | 4,390.4 | 4,186.5 | −0.9 | 4,520.7 | 4,891.2 | 3.2 | |
| Total | 5,699.9 | 5,422.2 | −1.0 | 5,813.8 | 6,237.2 | 2.8 | |
| 5. France | Off-trade | 1,288.2 | 2,018.3 | 9.4 | 2,110.0 | 2,463.7 | 4.1 |
| On-trade | 1,321.0 | 1,323.2 | 0.0 | 1,461.9 | 1,924.7 | 7.8 | |
| Total | 2,609.2 | 3,341.5 | 5.1 | 3,571.9 | 4,388.4 | 5.6 | |
| 6. Canada | Off-trade | 1,158.5 | 1,393.9 | 3.8 | 1,455.9 | 1,674.0 | 3.7 |
| On-trade | 1,371.4 | 1,312.4 | −0.9 | 1,390.7 | 1,480.2 | 2.4 | |
| Total | 2,529.9 | 2,706.3 | 1.4 | 2,846.6 | 3,154.2 | 3.1 | |
| 7. Netherlands | Off-trade | 263.3 | 461.4 | 11.9 | 483.6 | 573.0 | 4.4 |
| On-trade | 1,118.5 | 1,698.9 | 8.7 | 1,873.0 | 2,193.1 | 5.2 | |
| Total | 1,381.8 | 2,160.3 | 9.3 | 2,356.6 | 2,766.1 | 5.1 | |
| 8. Belgium | Off-trade | 440.3 | 535.7 | 4.0 | 549.0 | 689.2 | 5.2 |
| On-trade | 1,313.7 | 1,432.1 | 1.7 | 1,534.1 | 1,737.5 | 3.9 | |
| Total | 1,754.0 | 1,967.9 | 2.3 | 2,083.1 | 2,426.6 | 4.3 | |
| 9. Italy | Off-trade | 166.5 | 214.4 | 5.2 | 236.5 | 275.2 | 5.1 |
| On-trade | 1,073.8 | 1,264.8 | 3.3 | 1,408.7 | 1,781.7 | 7.1 | |
| Total | 1,240.3 | 1,479.2 | 3.6 | 1,645.2 | 2,057.0 | 6.8 | |
| 10. Russia | Off-trade | 557.2 | 1,069.7 | 13.9 | 1,120.0 | 1,376.7 | 5.2 |
| On-trade | 149.4 | 231.1 | 9.1 | 247.3 | 305.4 | 5.7 | |
| Total | 706.6 | 1,300.8 | 13.0 | 1,367.3 | 1,682.1 | 5.3 | |
| Sub-total (top 10 markets) | Off-trade | 13,804.2 | 17,629.6 | 5.0 | 18,465.0 | 22,931.5 | 5.4 |
| On-trade | 29,354.9 | 34,445.4 | 3.3 | 40,207.7 | 59,600.5 | 11.6 | |
| Total | 43,159.1 | 52,075.1 | 3.8 | 58,672.6 | 82,531.8 | 9.6 | |
|
Source: Euromonitor International, 2024 *CAGR: Compound Annual Growth Rate |
|||||||
| Region | 2017 | 2022 | CAGR* % 2017-2022 | 2023 | 2027 | CAGR* % 2022-2027 | |
|---|---|---|---|---|---|---|---|
| World - dark beer | Off-trade | 5,667.8 | 6,169.3 | 1.7 | 6,171.3 | 6,739.7 | 1.8 |
| On-trade | 3,657.7 | 3,562.3 | −0.5 | 3,815.9 | 4,706.5 | 5.7 | |
| Total | 9,325.5 | 9,731.6 | 0.9 | 9,987.3 | 11,446.2 | 3.3 | |
| 1. United States | Off-trade | 1,443.7 | 1,452.1 | 0.1 | 1,415.9 | 1,442.6 | −0.1 |
| On-trade | 992.3 | 889.1 | −2.2 | 979.7 | 1,010.8 | 2.6 | |
| Total | 2,435.9 | 2,341.2 | −0.8 | 2,395.6 | 2,453.4 | 0.9 | |
| 2. Germany | Off-trade | 818.1 | 706.4 | −2.9 | 693.1 | 661.8 | −1.3 |
| On-trade | 668.8 | 568.1 | −3.2 | 573.4 | 562.3 | −0.2 | |
| Total | 1,486.8 | 1,274.5 | −3.0 | 1,266.5 | 1,224.1 | −0.8 | |
| 3. United Kingdom | Off-trade | 455.8 | 482.9 | 1.2 | 481.0 | 483.8 | 0.0 |
| On-trade | 560.2 | 450.3 | −4.3 | 457.7 | 469.2 | 0.8 | |
| Total | 1,016.0 | 933.2 | −1.7 | 938.7 | 953.0 | 0.4 | |
| 4. China | Off-trade | 76.6 | 200.8 | 21.3 | 249.3 | 546.9 | 22.2 |
| On-trade | 184.7 | 399.3 | 16.7 | 505.5 | 1,198.3 | 24.6 | |
| Total | 261.3 | 600.1 | 18.1 | 754.8 | 1,745.2 | 23.8 | |
| 5. France | Off-trade | 362.1 | 503.6 | 6.8 | 509.0 | 554.8 | 2.0 |
| On-trade | 73.3 | 62.5 | −3.1 | 65.0 | 75.4 | 3.8 | |
| Total | 435.3 | 566.0 | 5.4 | 574.0 | 630.1 | 2.2 | |
| 6. Russia | Off-trade | 210.1 | 317.4 | 8.6 | 300.7 | 297.7 | −1.3 |
| On-trade | 19.9 | 22.6 | 2.6 | 22.1 | 22.0 | −0.5 | |
| Total | 230.0 | 339.9 | 8.1 | 322.7 | 319.6 | −1.2 | |
| 7. Canada | Off-trade | 199.5 | 209.7 | 1.0 | 210.9 | 226.2 | 1.5 |
| On-trade | 95.9 | 81.5 | −3.2 | 83.1 | 82.4 | 0.2 | |
| Total | 295.4 | 291.1 | −0.3 | 294.0 | 308.6 | 1.2 | |
| 8. Belgium | Off-trade | 125.6 | 131.4 | 0.9 | 125.8 | 135.8 | 0.7 |
| On-trade | 122.3 | 118.7 | −0.6 | 119.6 | 123.1 | 0.7 | |
| Total | 247.9 | 250.1 | 0.2 | 245.4 | 258.9 | 0.7 | |
| 9. Netherlands | Off-trade | 81.0 | 115.3 | 7.3 | 113.0 | 120.3 | 0.9 |
| On-trade | 79.7 | 99.4 | 4.5 | 98.2 | 109.6 | 2.0 | |
| Total | 160.7 | 214.7 | 6.0 | 211.2 | 229.9 | 1.4 | |
| 10. Italy | Off-trade | 33.7 | 38.3 | 2.6 | 39.3 | 42.0 | 1.9 |
| On-trade | 50.8 | 50.8 | 0.0 | 52.4 | 60.8 | 3.7 | |
| Total | 84.5 | 89.1 | 1.1 | 91.7 | 102.8 | 2.9 | |
| Sub-total (top 10 markets) | Off-trade | 3,806.2 | 4,157.9 | 1.8 | 4,138.0 | 4,511.9 | 1.6 |
| On-trade | 2,828.0 | 2,743.2 | −0.6 | 2,957.2 | 3,713.9 | 6.4 | |
| Total | 6,653.8 | 6,899.9 | 0.7 | 7,094.6 | 8,225.6 | 3.6 | |
|
Source: Euromonitor International, 2024 *CAGR: Compound Annual Growth Rate |
|||||||
Competitive landscape - dark beer
In 2022, the leading global companies in the dark beer category were Anheuser-Busch InBev NV (top brands: Hoegaarden, Leffe, Franziskaner, Labatt) at a global market value share of 13.4% (US$8.6 billion), Molson Coors Brewing Co. (top brands: Blue Moon, Red's, Leinenkugel, Worthington) at 6.6% (US$4.2 billion), and Heineken NV (top brands: John Smith's, Lagunitas, Newcastle Brown Ale, Affligem) at 5.0% (US$3.2 billion). Private labels of dark beer throughout the world registered a market value share of 0.2% (US$129.0 million) in 2022.
| Market | Company | Top brand(s) | Retail sales (US$M) | Market share % in 2022 |
|---|---|---|---|---|
| United States | Molson Coors Brewing Co. | Blue Moon, Redd's, Leinenkugel | 2,880.3 | 14.4 |
| New Belgium Brewing Co. | Voodoo Ranger, Fat Tire Amber Ale | 1,219.2 | 6.1 | |
| Sierra Nevada Brewing Co. | Hazy Little Thing, Sierra Nevada | 1,012.9 | 5.1 | |
| Total - Dark beer in the United States | 20,023.3 | 100.0 | ||
| China | Anheuser-Busch InBev NV | Hoegaarden, Franziskaner | 1,319.3 | 17.7 |
| Carlsberg A/S | Kronenbourg | 829.9 | 11.1 | |
| Beijing Yanjing Brewery Co Ltd. | Yanjing | 90.3 | 1.2 | |
| Total - Dark beer in China | 7,465.2 | 100.0 | ||
| United Kingdom | Anheuser-Busch InBev NV | Hoegaarden, Boddingtons, Bass, Whitbread | 942.1 | 15.2 |
| Molson Coors Brewing Co. | Worthington, Doom Bar, Stone's, Blue Moon, Caffrey's, Hancock's HB, Toby | 758.0 | 12.2 | |
| Heineken NV | John Smith's, Newcastle Brown Ale, Deuchars IPA | 743.3 | 12.0 | |
| Private label | Private label | 89.3 | 1.4 | |
| Total - Dark beer in the United Kingdom | 6,208.4 | 100.0 | ||
| Germany | Paulaner Brauerei GmbH & Co KG | Paulaner, Hacker Pschorr, Kapuziner, Thurn & Taxis Weissbier, AuerBräu, Fürstenberg, Hoepfner Schmucker | 985.9 | 18.2 |
| Oetker-Gruppe | Schöfferhofer, Dom/Sion/Gilden/ Küppers Kölsch, Schlösser Alt | 555.8 | 10.2 | |
| Anheuser-Busch InBev NV | Franziskaner, Diebels | 465.7 | 8.6 | |
| Private label | Private label | 23.1 | 0.4 | |
| Total - Dark beer in Germany | 5,422.2 | 100.0 | ||
| France | Anheuser-Busch InBev NV | Leffe, Hoegaarden, Triple Karmeliet, Victoria, Kwak | 1,541.0 | 46.1 |
| Carlsberg A/S | Grimbergen, 1664 Blanc | 779.5 | 23.3 | |
| Heineken NV | Affligem, Pelforth, Mort Subite, Edelweiss, Adelscott | 347.2 | 10.4 | |
| Total - Dark beer in France | 3,341.5 | 100.0 | ||
| Canada | Anheuser-Busch InBev NV | Labatt, Alexander Keith's, Shock Top | 857.0 | 31.7 |
| Molson Coors Brewing Co. | Molson (Export), Granville Island, Gastown Ale | 579.2 | 21.4 | |
| Sapporo Holdings Ltd. | Okanagan, Sleeman | 337.3 | 12.5 | |
| Total - Dark beer in Canada | 2,706.3 | 100.0 | ||
| Netherlands | Anheuser-Busch InBev NV | Hertog Jan, Leffe, Hoegaarden, Franziskaner | 708.1 | 32.8 |
| Asahi Group Holdings Ltd | Grolsch | 257.9 | 11.9 | |
| Heineken NV | Brand, Affligen, Wieckse Witte, Heineken | 236.2 | 10.9 | |
| Total - Dark beer in the Netherlands | 2,160.3 | 100.0 | ||
| Belgium | Anheuser-Busch InBev NV | Leffe, Hoegaarden, Belle-Vue, Tripel Karmeliet, Vieux Temps, Kwak, Ginder Ale | 657.0 | 33.4 |
| Duvel Moortgat NV | Chouffe, Duvel, Liefmans, Maredsous, De Koninck | 225.7 | 11.5 | |
| Heineken NV | Grimbergen, Mort Subite, Ciney, Judas, Affligem | 176.3 | 9.0 | |
| Private label | Private label | 10.0 | 0.5 | |
| Total - Dark beer in Belgium | 1,967.9 | 100.0 | ||
| Italy | Anheuser-Busch InBev NV | Leffe, Hoegaarden | 357.6 | 24.2 |
| Heineken NV | Moretti, McFarland, Mort Subite, Edelweiss | 252.7 | 17.1 | |
| Paulaner Brauerei GmbH & Co KG | Paulaner | 161.2 | 10.9 | |
| Total - Dark beer in Italy | 1,479.2 | 100.0 | ||
| Russia | Anheuser-Busch InBev NV | Hoegaarden, Leffe, Franziskaner, Chernigivske, | 337.0 | 25.9 |
| Oasis Group | Hamovniki Bavarskoye, 5 Okean, Mokhnaty Shmel | 90.5 | 7.0 | |
| Carlsberg A/S | Baltika, Grimbergen, Old Bobby Ale | 76.2 | 5.9 | |
| Total - Dark beer in Russia | 1,300.8 | 100.0 | ||
| Source: Euromonitor International, 2024 | ||||
Lager
In 2022, total sales of Lager beer (including premium/mid-priced/economy domestic and imported standard Lager, flavoured/mixed Lager) was US$610.6 billion (181.7 billion litres), which consisted of US$285.7 billion (121.6 billion litres) in off-trade retail sales and US$324.9 billion (60.1 billion litres) in on-trade sales. Both off-trade and on-trade sales increased by 6.4% and 2.9%, respectively between 2017 and 2022. Although on-trade sales of Lager beer suffered during the pandemic lockdown periods, the foodservice sector is forecast to turn around with a CAGR of 10.5% versus retail off-trade (8.6%) between 2022 and 2027.
The largest regions with the most total value of off/on-trade sales of Lager beer were Asia Pacific (US$171.6 billion), Latin America (US$124.6 billion), Western Europe (US$113.5 billion), and North America (US$100.5 billion) in 2022. Top regions with the highest total historical growth (2017 to 2022) of Lager beer were Latin America (CAGR:11.8%) and MENA (9.8%). Australasia and Asia Pacific regions suffered the most during the COVID-19 period within the foodservice sector, registering negative on-trade sales growths of −3.4% and −0.8% respectively.
Off-trade sales of Lager beer brought in the most value over on-trade sales within the following regions: Australasia (off-trade share: 73.7%), Eastern Europe (67.5%), and North America (53.8%) in 2022. Alternatively, the Asia Pacific (52%), Latin America (57.8%), MENA (54.2%), and Western Europe (65%) regions registered higher sales within the on-trade sector of Lager beer in 2022.
| Region | 2017 | 2022 | CAGR* % 2017-2022 | 2023 | 2027 | CAGR* % 2022-2027 | |
|---|---|---|---|---|---|---|---|
| World (Total) | Off-trade | 209,970.0 | 285,747.5 | 6.4 | 316,981.5 | 431,309.0 | 8.6 |
| On-trade | 282,060.5 | 324,873.0 | 2.9 | 374,621.3 | 534,204.9 | 10.5 | |
| Total | 492,030.4 | 610,620.5 | 4.4 | 691,602.8 | 965,513.9 | 9.6 | |
| Asia Pacific | Off-trade | 64,084.2 | 82,401.9 | 5.2 | 91,128.8 | 115,276.8 | 6.9 |
| On-trade | 92,899.2 | 89,224.3 | −0.8 | 105,508.7 | 144,007.9 | 10.0 | |
| Total | 156,983.4 | 171,626.3 | 1.8 | 196,637.5 | 259,284.7 | 8.6 | |
| Australasia | Off-trade | 5,025.1 | 5,872.9 | 3.2 | 6,282.8 | 7,060.7 | 3.8 |
| On-trade | 2,486.9 | 2,094.5 | −3.4 | 2,443.8 | 3,438.5 | 10.4 | |
| Total | 7,512.1 | 7,967.4 | 1.2 | 8,726.6 | 10,499.2 | 5.7 | |
| Eastern Europe | Off-trade | 20,083.1 | 27,225.3 | 6.3 | 30,550.8 | 38,581.4 | 7.2 |
| On-trade | 11,572.4 | 13,098.0 | 2.5 | 15,139.1 | 21,113.6 | 10.0 | |
| Total | 31,655.5 | 40,323.3 | 5.0 | 45,689.9 | 59,695.1 | 8.2 | |
| Latin America | Off-trade | 28,787.9 | 52,579.2 | 12.8 | 62,390.8 | 114,415.5 | 16.8 |
| On-trade | 42,599.2 | 72,028.4 | 11.1 | 85,537.9 | 152,124.8 | 16.1 | |
| Total | 71,387.1 | 124,607.7 | 11.8 | 147,928.7 | 266,540.3 | 16.4 | |
| Middle Eastern and Africa | Off-trade | 13,547.7 | 23,839.6 | 12.0 | 26,359.2 | 38,523.5 | 10.1 |
| On-trade | 19,142.8 | 28,217.9 | 8.1 | 32,449.3 | 53,255.6 | 13.5 | |
| Total | 32,690.6 | 52,057.5 | 9.8 | 58,808.5 | 91,779.1 | 12.0 | |
| North America | Off-trade | 48,161.0 | 54,077.5 | 2.3 | 56,688.0 | 62,969.0 | 3.1 |
| On-trade | 44,539.3 | 46,436.7 | 0.8 | 51,125.6 | 59,822.0 | 5.2 | |
| Total | 92,700.3 | 100,514.3 | 1.6 | 107,813.6 | 122,791.0 | 4.1 | |
| Western Europe | Off-trade | 30,280.9 | 39,751.0 | 5.6 | 43,581.1 | 54,482.0 | 6.5 |
| On-trade | 68,820.7 | 73,773.1 | 1.4 | 82,416.9 | 100,442.5 | 6.4 | |
| Total | 99,101.6 | 113,524.1 | 2.8 | 125,998.0 | 154,924.5 | 6.4 | |
|
Source: Euromonitor International, 2024 *CAGR: Compound Annual Growth Rate |
|||||||
| Region | 2017 | 2022 | CAGR* % 2017-2022 | 2023 | 2027 | CAGR* % 2022-2027 | |
|---|---|---|---|---|---|---|---|
| World (Total) | Off-trade | 111,866.5 | 121,606.1 | 1.7 | 124,510.7 | 134,911.2 | 2.1 |
| On-trade | 65,937.6 | 60,062.5 | −1.8 | 63,934.4 | 72,638.0 | 3.9 | |
| Total | 177,804.1 | 181,668.6 | 0.4 | 188,445.1 | 207,549.2 | 2.7 | |
| Asia Pacific | Off-trade | 36,820.9 | 40,347.7 | 1.8 | 42,276.9 | 47,524.9 | 3.3 |
| On-trade | 30,280.8 | 24,716.5 | −4.0 | 27,054.9 | 31,105.8 | 4.7 | |
| Total | 67,101.7 | 65,064.2 | −0.6 | 69,331.8 | 78,630.7 | 3.9 | |
| Australasia | Off-trade | 1,069.7 | 1,083.1 | 0.2 | 1,077.2 | 1,051.7 | −0.6 |
| On-trade | 339.2 | 255.4 | −5.5 | 274.3 | 328.0 | 5.1 | |
| Total | 1,408.9 | 1,338.5 | −1.0 | 1,351.5 | 1,379.7 | 0.6 | |
| Eastern Europe | Off-trade | 16,319.9 | 16,248.3 | −0.1 | 16,369.3 | 16,850.9 | 0.7 |
| On-trade | 3,333.5 | 2,695.8 | −4.2 | 2,828.3 | 3,296.1 | 4.1 | |
| Total | 19,653.3 | 18,944.1 | −0.7 | 19,197.6 | 20,147.0 | 1.2 | |
| Latin America | Off-trade | 18,331.0 | 22,983.9 | 4.6 | 23,757.1 | 26,875.4 | 3.2 |
| On-trade | 12,048.5 | 13,182.6 | 1.8 | 13,843.7 | 15,713.4 | 3.6 | |
| Total | 30,379.4 | 36,166.5 | 3.5 | 37,600.8 | 42,588.8 | 3.3 | |
| Middle Eastern and Africa | Off-trade | 7,633.2 | 9,352.9 | 4.1 | 9,736.6 | 11,338.6 | 3.9 |
| On-trade | 5,833.9 | 6,364.4 | 1.8 | 6,718.1 | 8,303.3 | 5.5 | |
| Total | 13,467.2 | 15,717.3 | 3.1 | 16,454.7 | 19,641.9 | 4.6 | |
| North America | Off-trade | 17,581.3 | 16,639.2 | −1.1 | 16,410.1 | 16,375.8 | −0.3 |
| On-trade | 5,530.1 | 4,949.1 | −2.2 | 5,093.1 | 5,329.5 | 1.5 | |
| Total | 23,111.4 | 21,588.3 | −1.4 | 21,503.3 | 21,705.3 | 0.1 | |
| Western Europe | Off-trade | 14,110.5 | 14,951.0 | 1.2 | 14,883.5 | 14,893.9 | −0.1 |
| On-trade | 8,571.6 | 7,898.7 | −1.6 | 8,121.9 | 8,561.9 | 1.6 | |
| Total | 22,682.1 | 22,849.7 | 0.1 | 23,005.4 | 23,455.7 | 0.5 | |
|
Source: Euromonitor International, 2024 *CAGR: Compound Annual Growth Rate |
|||||||
In 2022, leading Lager beer markets throughout the world that registered the highest total on/off-trade sales were China at US$91.1 billion (42.1 billion litres), the United States at US$90.3 billion (19.7 billion litres), Brazil at US$55.0 billion (14.7 billion litres), Mexico at US$32.3 billion (9.7 billion litres), and Germany at US$23.6 billion (6.9 billion litres). Canada was the 12th largest market in terms of value sales of Lager beer at US$10.2 billion (1.9 billion litres) in 2022.
Within the top 10 markets (including Canada) in 2022, those countries with larger off-trade Lager beer sales over on-trade value sales were the United States (off-trade share: 52.7%), Mexico (55.5%), Japan (67.4%), Russia (72.6%), and Canada (63.4%). Alternatively, China (on-trade share: 60.5%), Brazil (71.5%), Germany (73.1%), the United Kingdom (60.1%), Spain (83%), and South Africa (57.4%) were regions that registered higher sales within the on-trade sector for Lager beer in 2022.
| Market (category) | 2017 | 2022 | CAGR* % 2017-2022 | 2023 | 2027 | CAGR* % 2022-2027 | |
|---|---|---|---|---|---|---|---|
| World - Lager | Off-trade | 209,970.0 | 285,747.5 | 6.4 | 316,981.5 | 431,309.0 | 8.6 |
| On-trade | 282,060.5 | 324,873.0 | 2.9 | 374,621.3 | 534,204.9 | 10.5 | |
| Total | 492,030.4 | 610,620.5 | 4.4 | 691,602.8 | 965,513.9 | 9.6 | |
| 1. China | Off-trade | 27,154.7 | 36,037.8 | 5.8 | 39,997.9 | 48,189.8 | 6.0 |
| On-trade | 52,663.6 | 55,109.8 | 0.9 | 63,066.6 | 79,141.2 | 7.5 | |
| Total | 79,818.3 | 91,147.7 | 2.7 | 103,064.5 | 127,331.1 | 6.9 | |
| 2. United States | Off-trade | 41,764.8 | 47,586.8 | 2.6 | 50,136.9 | 56,307.2 | 3.4 |
| On-trade | 40,192.0 | 42,691.2 | 1.2 | 46,985.3 | 54,688.3 | 5.1 | |
| Total | 81,956.8 | 90,278.0 | 2.0 | 97,122.2 | 110,995.4 | 4.2 | |
| 3. Brazil | Off-trade | 6,372.7 | 15,637.6 | 19.7 | 18,808.2 | 32,141.1 | 15.5 |
| On-trade | 20,145.5 | 39,318.7 | 14.3 | 45,335.4 | 71,619.1 | 12.7 | |
| Total | 26,518.2 | 54,956.3 | 15.7 | 64,143.6 | 103,760.2 | 13.6 | |
| 4. Mexico | Off-trade | 10,374.0 | 17,919.4 | 11.6 | 19,885.4 | 26,965.0 | 8.5 |
| On-trade | 9,723.6 | 14,382.3 | 8.1 | 16,329.7 | 22,125.5 | 9.0 | |
| Total | 20,097.6 | 32,301.7 | 10.0 | 36,215.1 | 49,090.5 | 8.7 | |
| 5. Germany | Off-trade | 5,563.4 | 6,334.0 | 2.6 | 6,693.4 | 7,233.1 | 2.7 |
| On-trade | 16,556.0 | 17,234.3 | 0.8 | 18,643.4 | 20,167.4 | 3.2 | |
| Total | 22,119.4 | 23,568.3 | 1.3 | 25,336.8 | 27,400.5 | 3.1 | |
| 6. Japan | Off-trade | 15,619.4 | 15,294.4 | −0.4 | 15,823.6 | 14,853.8 | −0.6 |
| On-trade | 13,558.7 | 7,401.3 | −11.4 | 8,725.6 | 8,915.5 | 3.8 | |
| Total | 29,178.1 | 22,695.7 | −4.9 | 24,549.1 | 23,769.3 | 0.9 | |
| 7. United Kingdom | Off-trade | 6,361.2 | 8,914.6 | 7.0 | 9,526.9 | 10,769.2 | 3.9 |
| On-trade | 12,549.9 | 13,422.0 | 1.4 | 14,959.1 | 17,726.8 | 5.7 | |
| Total | 18,911.1 | 22,336.5 | 3.4 | 24,486.0 | 28,496.1 | 5.0 | |
| 8. Russia | Off-trade | 8,879.5 | 12,928.9 | 7.8 | 14,193.1 | 18,133.0 | 7.0 |
| On-trade | 4,009.3 | 4,877.8 | 4.0 | 5,302.4 | 6,875.0 | 7.1 | |
| Total | 12,888.8 | 17,806.7 | 6.7 | 19,495.4 | 25,008.1 | 7.0 | |
| 9. Spain | Off-trade | 2,002.3 | 2,324.1 | 3.0 | 2,524.7 | 2,859.8 | 4.2 |
| On-trade | 10,714.4 | 11,377.2 | 1.2 | 12,539.6 | 15,209.1 | 6.0 | |
| Total | 12,716.7 | 13,701.3 | 1.5 | 15,064.4 | 18,068.8 | 5.7 | |
| 10. South Africa | Off-trade | 3,367.2 | 5,420.2 | 10.0 | 5,963.9 | 9,000.2 | 10.7 |
| On-trade | 4,533.5 | 7,307.3 | 10.0 | 8,064.1 | 11,669.1 | 9.8 | |
| Total | 7,900.7 | 12,727.5 | 10.0 | 14,028.0 | 20,669.3 | 10.2 | |
| Sub-total (top 10 markets) | Off-trade | 127,459.2 | 168,397.8 | 5.7 | 183,554.0 | 226,452.2 | 6.1 |
| On-trade | 184,646.5 | 213,121.9 | 2.9 | 239,951.2 | 308,137.0 | 7.7 | |
| Total | 312,105.7 | 381,519.7 | 4.1 | 423,505.1 | 534,589.3 | 7.0 | |
| Canada (12th) | Off-trade | 6,396.2 | 6,490.8 | 0.3 | 6,551.1 | 6,661.9 | 0.5 |
| On-trade | 4,347.2 | 3,745.6 | −2.9 | 4,140.3 | 5,133.7 | 6.5 | |
| Total | 10,743.5 | 10,236.3 | −1.0 | 10,691.4 | 11,795.6 | 2.9 | |
|
Source: Euromonitor International, 2024 *CAGR: Compound Annual Growth Rate |
|||||||
| Market (category) | 2017 | 2022 | CAGR* % 2017-2022 | 2023 | 2027 | CAGR* % 2022-2027 | |
|---|---|---|---|---|---|---|---|
| World - lager | Off-trade | 111,866.5 | 121,606.1 | 1.7 | 124,510.7 | 134,911.2 | 2.1 |
| On-trade | 65,937.6 | 60,062.5 | −1.8 | 63,934.4 | 72,638.0 | 3.9 | |
| Total | 177,804.1 | 181,668.6 | 0.4 | 188,445.1 | 207,549.2 | 2.7 | |
| 1. China | Off-trade | 21,841.1 | 23,157.4 | 1.2 | 24,349.7 | 26,060.4 | 2.4 |
| On-trade | 23,039.6 | 18,921.9 | −3.9 | 20,265.7 | 21,472.4 | 2.6 | |
| Total | 44,880.7 | 42,079.3 | −1.3 | 44,615.4 | 47,532.7 | 2.5 | |
| 2. United States | Off-trade | 15,897.9 | 15,043.6 | −1.1 | 14,851.9 | 14,914.3 | −0.2 |
| On-trade | 5,145.1 | 4,640.0 | −2.0 | 4,763.1 | 4,945.8 | 1.3 | |
| Total | 21,043.0 | 19,683.6 | −1.3 | 19,615.0 | 19,860.0 | 0.2 | |
| 3. Brazil | Off-trade | 4,581.7 | 6,042.3 | 5.7 | 6,266.1 | 7,028.4 | 3.1 |
| On-trade | 7,665.1 | 8,650.7 | 2.4 | 8,951.5 | 9,838.8 | 2.6 | |
| Total | 12,246.8 | 14,692.9 | 3.7 | 15,217.6 | 16,867.3 | 2.8 | |
| 4. Mexico | Off-trade | 6,120.2 | 7,881.7 | 5.2 | 8,215.0 | 9,462.9 | 3.7 |
| On-trade | 1,738.3 | 1,786.3 | 0.5 | 1,908.9 | 2,218.1 | 4.4 | |
| Total | 7,858.4 | 9,668.0 | 4.2 | 10,124.0 | 11,681.0 | 3.9 | |
| 5. Russia | Off-trade | 6,230.3 | 6,926.4 | 2.1 | 6,962.4 | 7,182.3 | 0.7 |
| On-trade | 803.9 | 708.5 | −2.5 | 709.3 | 726.1 | 0.5 | |
| Total | 7,034.2 | 7,634.9 | 1.7 | 7,671.7 | 7,908.3 | 0.7 | |
| 6. Germany | Off-trade | 4,614.7 | 4,627.6 | 0.1 | 4,572.0 | 4,438.4 | −0.8 |
| On-trade | 2,346.6 | 2,232.7 | −1.0 | 2,258.8 | 2,226.9 | −0.1 | |
| Total | 6,961.3 | 6,860.3 | −0.3 | 6,830.8 | 6,665.3 | −0.6 | |
| 7. Japan | Off-trade | 4,353.4 | 3,963.6 | −1.9 | 3,742.8 | 3,347.2 | −3.3 |
| On-trade | 1,044.6 | 543.2 | −12.3 | 621.1 | 632.6 | 3.1 | |
| Total | 5,397.9 | 4,506.9 | −3.5 | 4,363.9 | 3,979.7 | −2.5 | |
| 8. South Africa | Off-trade | 1,844.2 | 2,148.0 | 3.1 | 2,205.9 | 2,492.6 | 3.0 |
| On-trade | 1,059.4 | 1,218.8 | 2.8 | 1,253.8 | 1,384.8 | 2.6 | |
| Total | 2,903.6 | 3,366.8 | 3.0 | 3,459.7 | 3,877.3 | 2.9 | |
| 9. United Kingdom | Off-trade | 1,707.1 | 1,923.6 | 2.4 | 1,895.6 | 1,887.4 | −0.4 |
| On-trade | 1,535.7 | 1,305.5 | −3.2 | 1,336.1 | 1,418.7 | 1.7 | |
| Total | 3,242.8 | 3,229.1 | −0.1 | 3,231.7 | 3,306.1 | 0.5 | |
| 10. Spain | Off-trade | 1,379.5 | 1,459.1 | 1.1 | 1,460.7 | 1,470.3 | 0.2 |
| On-trade | 1,774.7 | 1,748.2 | −0.3 | 1,789.0 | 1,960.9 | 2.3 | |
| Total | 3,154.2 | 3,207.2 | 0.3 | 3,249.8 | 3,431.2 | 1.4 | |
| Sub-total (top 10 markets) | Off-trade | 87,965.7 | 94,202.2 | 1.4 | 96,367.1 | 102,288.1 | 1.7 |
| On-trade | 46,153.0 | 41,755.8 | −2.0 | 43,857.3 | 46,825.1 | 2.3 | |
| Total | 114,722.9 | 114,929.0 | 0.0 | 118,379.6 | 125,108.9 | 1.7 | |
| Canada (12th in value) | Off-trade | 1,683.5 | 1,595.7 | −1.1 | 1,558.2 | 1,461.6 | −1.7 |
| On-trade | 385.0 | 309.1 | −4.3 | 330.1 | 383.7 | 4.4 | |
| Total | 2,068.4 | 1,904.7 | −1.6 | 1,888.3 | 1,845.3 | −0.6 | |
|
Source: Euromonitor International, 2024 *CAGR: Compound Annual Growth Rate |
|||||||
Competitive landscape - lager
In 2022, the leading global companies in the Lager beer category were Anheuser-Busch InBev NV (top brands: Budweiser, Corona, Brahma, Bud Light) at a total market value share of 29.7% (US$181.2 billion), Heineken NV (top brands: Heineken, Tecate, Tiger, Kingfisher) at 13.9% (US$84.8 billion), and Carlsberg A/S (brands: Tuborg, Carlsberg, Kronenbourg, Wusu) at a market share of 6.3% (US$38.3 billion). Private labels registered total Lager beer sales of US$2.5 billion (0.4%) in 2022.
| Market | Company | Top brand(s) | Retail sales (US$M) | Market share % in 2022 |
|---|---|---|---|---|
| China | Anheuser-Busch InBev NV | Harbin, Budweiser, Sedrin, Jinlongquan, Boss | 17,692.9 | 19.4 |
| China Resources Holdings Co Ltd. | Snow, Kingway, Blue Sword, Siwo, Zhong Hua | 17,264.6 | 18.9 | |
| Tsingtao Brewery Co Ltd. | Tsingtao, Laoshan, Hans Beer, Xin Immense | 15,302.2 | 16.8 | |
| Total - Lager in China | 91,147.7 | 100.0 | ||
| United States | Anheuser-Busch InBev NV | Bud Light, Michelob, Busch, Budweiser, Natural | 39,585.4 | 43.8 |
| Constellation Brands Inc | Modelo, Corona, Pacífico, Victoria | 19,133.0 | 21.2 | |
| Molson Coors Brewing Co | Coors, Miller, Keystone, Milwaukee, Foster's | 18,675.6 | 20.7 | |
| Total - Lager in the USA | 90,278.0 | 100.0 | ||
| Brazil | Anheuser-Busch InBev NV | Skol, Brahma, Antarctica, Bohemia, Budweiser | 35,513.3 | 64.6 |
| Heineken NV | Nova Schin, Kaiser, Heineken, Bavaria, Sol | 9,495.3 | 17.3 | |
| Cervejaria Petrópolis SA | Itaipava, Crystal | 6,481.1 | 11.8 | |
| Total - Lager in Brazil | 54,956.3 | 100.0 | ||
| Mexico | Anheuser-Busch InBev NV | Corona, Victoria, Modelo, Estrella, Pacífico | 19,076.0 | 59.1 |
| Heineken NV | Tecate, Dos Equis XX, Sol, Indio, Superior | 12,664.6 | 39.2 | |
| Molson Coors Brewing Co | Miller, Coors | 55.8 | 0.2 | |
| Total - Lager in Mexico | 32,301.7 | 100.0 | ||
| Germany | Oetker-Gruppe | Radeberger, Jever, Sternburg, Ur-Krostitzer | 2,569.7 | 10.9 |
| Bitburger Braugruppe GmbH | Bitburger, König Pilsener, Licher | 2,034.8 | 8.6 | |
| Krombacher Brauerei Bhd Schadeberg GmbH & Co KG | Krombacher | 1,910.0 | 8.1 | |
| Private label | Private label | 294.9 | 1.3 | |
| Total - Lager in Germany | 23,568.3 | 100.0 | ||
| Japan | Asahi Group Holdings Ltd | Clear (Asahi), Style Free | 8,728.8 | 38.5 |
| Kirin Holdings Co Ltd | Kirin Tanrei, Nodogoshi, Spring Valley | 6,333.7 | 27.9 | |
| Suntory Holdings Ltd | Kinmugi, Suntory, Jokki Nama, The Malt's | 2,736.5 | 12.1 | |
| Private label | Private label | 572.3 | 2.5 | |
| Total - Lager in Japan | 22,695.7 | 100.0 | ||
| United Kingdom | Anheuser-Busch InBev NV | Stella Artois, Budweiser, Corona, Beck's | 6,535.6 | 29.3 |
| Heineken NV | Foster's, Moretti, Heineken, Desperados, Sol | 4,646.1 | 20.8 | |
| Molson Coors Brewing Co | Carling, Coors, Cobra, Staropramen, Miller | 3,870.7 | 17.3 | |
| Private label | Private label | 14.8 | 0.1 | |
| Total - Lager in the UK | 22,336.5 | 100.0 | ||
| Russia | Carlsberg A/S | Baltika, Zhigulevskoye, Zatecky Gus, Carlsberg | 4,389.8 | 24.7 |
| Anheuser-Busch InBev NV | Gold Mine Beer, Budwieser, Löwenbräu | 3,210.9 | 18.0 | |
| Heineken NV | Okhota, Heineken, Bochkarov, Krušovice | 1,919.0 | 10.8 | |
| Total - Lager in Russia | 17,806.7 | 100.0 | ||
| Spain | Grupo Mahou-San Miguel SA | Mahou, San Miguel, Mixta Shandy, Alhambra | 4,109.7 | 30.0 |
| Heineken NV | Cruzcampo, Amstel, Heineken, Desperados | 3,357.4 | 24.5 | |
| Damm SA | Estrella/Voll/Xibeca Damm | 1,740.7 | 12.7 | |
| Private label | Private label | 387.9 | 2.8 | |
| Total - Lager in Spain | 13,701.3 | 100.0 | ||
| South Africa | Anheuser-Busch InBev NV | Castle, Carling, Hansa Pilsner, Flying Fish | 9,954.5 | 78.2 |
| Heineken NV | Heineken, Amstel | 1,742.5 | 13.7 | |
| Namibia Breweries Ltd | Windhoek, Tafel Lager | 633.7 | 5.0 | |
| Total - Lager in South Africa | 12,727.5 | 100.0 | ||
| Canada | Anheuser-Busch InBev NV | Budweiser, Bud Light, Labatt, Lucky Lager | 4,216.7 | 41.2 |
| Molson Coors Brewing Co | Coors, Carling, Molson (CDN), Old Style Pilsner | 3,107.6 | 30.4 | |
| Sapporo Holdings Ltd | Okanagan, Sleeman | 380.1 | 3.7 | |
| Total - Lager in Canada | 10,236.3 | 100.0 | ||
| Source: Euromonitor International, 2024 | ||||
Stout beer
In 2022, total sales of Stout beer was US$16.2 billion (2.1 billion litres), which consisted of US$3.9 billion (866.1 million litres) in off-trade retail sales and US$12.3 billion (1.3 billion litres) in on-trade sales. Off-trade sales grew at a value CAGR of 6.2% and similarly, on-trade sales at a CAGR of 6.3% between 2017 and 2022. On-trade sales are forecast to pick up at a CAGR of 10.5% versus off-trade (8.8%) between 2022 and 2027.
The largest regions with the most total off/on-trade value sales of Stout beer were the Asia Pacific (US$5.5 billion), Western Europe (US$4.0 billion), and MENA (US$3.2 billion) in 2022. Top regions with the highest total historical growth (2017 to 2022) were the Asia Pacific (CAGR:11.1%), Latin America (9.5%), and MENA (9.5%); while Australasia (+1.5%), North America (+1.6%) and Western Europe (+2.3%) suffered the most during the pandemic with lower growth during the review period.
Off-trade sales of Stout beer brought in the most value over on-trade sales within the following regions: Australasia (off-trade share: 65.8%), Eastern Europe (50.8%), and Latin America (57.7%) in 2022. Alternatively, the Asia Pacific (76.9%), MENA (72.8%), North America (75.3%), and Western Europe (83.9%) regions registered higher sales within the on-trade sector for Stout beer in 2022.
| Region | 2017 | 2022 | CAGR* % 2017-2022 | 2023 | 2027 | CAGR* % 2022-2027 | |
|---|---|---|---|---|---|---|---|
| World (Total) | Off-trade | 2,898.7 | 3,918.5 | 6.2 | 4,280.7 | 5,986.3 | 8.8 |
| On-trade | 9,035.4 | 12,274.3 | 6.3 | 13,982.3 | 20,264.4 | 10.5 | |
| Total | 11,934.1 | 16,192.8 | 6.3 | 18,263.1 | 26,250.6 | 10.1 | |
| Asia Pacific | Off-trade | 724.1 | 1,263.4 | 11.8 | 1,421.6 | 2,007.0 | 9.7 |
| On-trade | 2,515.6 | 4,212.4 | 10.9 | 4,857.8 | 7,421.6 | 12.0 | |
| Total | 3,239.7 | 5,475.8 | 11.1 | 6,279.4 | 9,428.7 | 11.5 | |
| Australasia | Off-trade | 74.1 | 92.8 | 4.6 | 92.9 | 104.8 | 2.5 |
| On-trade | 56.9 | 48.2 | −3.3 | 58.1 | 92.9 | 14.0 | |
| Total | 131.0 | 141.0 | 1.5 | 151.1 | 197.7 | 7.0 | |
| Eastern Europe | Off-trade | 122.2 | 163.2 | 6.0 | 202.9 | 317.6 | 14.2 |
| On-trade | 129.0 | 158.3 | 4.2 | 194.3 | 305.9 | 14.1 | |
| Total | 251.2 | 321.5 | 5.1 | 397.2 | 623.4 | 14.2 | |
| Latin America | Off-trade | 153.3 | 226.8 | 8.1 | 266.2 | 517.9 | 18.0 |
| On-trade | 96.0 | 166.5 | 11.6 | 251.0 | 962.3 | 42.0 | |
| Total | 249.3 | 393.3 | 9.5 | 517.2 | 1,480.3 | 30.4 | |
| Middle Eastern and Africa | Off-trade | 521.3 | 872.7 | 10.9 | 989.6 | 1,627.8 | 13.3 |
| On-trade | 1,520.1 | 2,335.3 | 9.0 | 2,729.0 | 4,900.2 | 16.0 | |
| Total | 2,041.4 | 3,208.0 | 9.5 | 3,718.7 | 6,528.0 | 15.3 | |
| North America | Off-trade | 783.5 | 659.7 | −3.4 | 616.8 | 624.0 | −1.1 |
| On-trade | 1,676.8 | 2,009.2 | 3.7 | 2,155.7 | 2,208.6 | 1.9 | |
| Total | 2,460.4 | 2,668.9 | 1.6 | 2,772.5 | 2,832.6 | 1.2 | |
| Western Europe | Off-trade | 520.1 | 639.9 | 4.2 | 690.7 | 787.0 | 4.2 |
| On-trade | 3,041.0 | 3,344.5 | 1.9 | 3,736.4 | 4,372.9 | 5.5 | |
| Total | 3,561.1 | 3,984.4 | 2.3 | 4,427.0 | 5,160.0 | 5.3 | |
|
Source: Euromonitor International, 2024 *CAGR: Compound Annual Growth Rate |
|||||||
| Region | 2017 | 2022 | CAGR* % 2017-2022 | 2023 | 2027 | CAGR* % 2022-2027 | |
|---|---|---|---|---|---|---|---|
| World (Total) | Off-trade | 753.2 | 866.1 | 2.8 | 888.1 | 1,043.6 | 3.8 |
| On-trade | 1,144.8 | 1,270.5 | 2.1 | 1,362.3 | 1,721.7 | 6.3 | |
| Total | 1,898.0 | 2,136.6 | 2.4 | 2,250.4 | 2,765.4 | 5.3 | |
| Asia Pacific | Off-trade | 126.8 | 204.3 | 10.0 | 220.6 | 281.2 | 6.6 |
| On-trade | 196.5 | 287.0 | 7.9 | 317.0 | 438.4 | 8.8 | |
| Total | 323.4 | 491.3 | 8.7 | 537.6 | 719.5 | 7.9 | |
| Australasia | Off-trade | 15.0 | 17.2 | 2.8 | 16.3 | 17.2 | 0.0 |
| On-trade | 5.9 | 4.2 | −6.6 | 4.8 | 6.9 | 10.4 | |
| Total | 20.8 | 21.4 | 0.6 | 21.1 | 24.1 | 2.4 | |
| Eastern Europe | Off-trade | 49.9 | 46.8 | −1.3 | 49.2 | 59.1 | 4.8 |
| On-trade | 22.8 | 19.7 | −2.9 | 21.0 | 27.3 | 6.7 | |
| Total | 72.7 | 66.5 | −1.8 | 70.2 | 86.4 | 5.4 | |
| Latin America | Off-trade | 50.0 | 58.2 | 3.1 | 58.9 | 65.3 | 2.3 |
| On-trade | 15.2 | 14.9 | −0.4 | 16.9 | 21.8 | 7.9 | |
| Total | 65.2 | 73.1 | 2.3 | 75.8 | 87.1 | 3.6 | |
| Middle Eastern and Africa | Off-trade | 246.9 | 309.8 | 4.6 | 324.6 | 406.3 | 5.6 |
| On-trade | 470.8 | 524.4 | 2.2 | 566.6 | 784.7 | 8.4 | |
| Total | 717.7 | 834.2 | 3.1 | 891.2 | 1,191.0 | 7.4 | |
| North America | Off-trade | 157.0 | 116.4 | −5.8 | 104.9 | 96.9 | −3.6 |
| On-trade | 112.6 | 118.3 | 1.0 | 124.5 | 117.3 | −0.2 | |
| Total | 269.6 | 234.7 | −2.7 | 229.5 | 214.1 | −1.8 | |
| Western Europe | Off-trade | 107.6 | 113.4 | 1.1 | 113.7 | 117.8 | 0.8 |
| On-trade | 321.0 | 302.1 | −1.2 | 311.4 | 325.3 | 1.5 | |
| Total | 428.6 | 415.5 | −0.6 | 425.1 | 443.1 | 1.3 | |
|
Source: Euromonitor International, 2024 *CAGR: Compound Annual Growth Rate |
|||||||
In 2022, leading Stout beer markets registering the highest total off/on-trade sales were China at US$4.4 billion (375.8 million litres), the United States at US$2.5 billion (222.7 million litres), the United Kingdom at US$1.5 billion (181.4 million litres), Ireland at US$1.3 billion (122.6 million litres), and Kenya at US$631.7 million (75.1 million litres). Canada was the 18th largest market in terms of value sales at US$126.0 million (12.0 million litres) in 2022.
Within the top 10 markets (including Canada), the only country with larger off-trade Stout beer value sales over on-trade sales was South Africa (off-trade share: 59.9%) in 2022. Alternatively, China (on-trade share: 79.1%), the US (75.5%), the UK (82.1%), Ireland (93.1%), Kenya (94.9%), Cameroon (82.1%), Italy (74.9%), Uganda (88.6%), Malaysia (81.6%), and Canada (70.2%) were regions that registered higher sales within the on-trade sector for Stout beer in 2022.
| Region | 2017 | 2022 | CAGR* % 2017-2022 | 2023 | 2027 | CAGR* % 2022-2027 | |
|---|---|---|---|---|---|---|---|
| World - Stout beer | Off-trade | 2,898.7 | 3,918.5 | 6.2 | 4,280.7 | 5,986.3 | 8.8 |
| On-trade | 9,035.4 | 12,274.3 | 6.3 | 13,982.3 | 20,264.4 | 10.5 | |
| Total | 11,934.1 | 16,192.8 | 6.3 | 18,263.1 | 26,250.6 | 10.1 | |
| 1. China | Off-trade | 415.2 | 916.6 | 17.2 | 1,041.7 | 1,495.3 | 10.3 |
| On-trade | 1,705.6 | 3,462.2 | 15.2 | 3,982.0 | 6,093.6 | 12.0 | |
| Total | 2,120.8 | 4,378.8 | 15.6 | 5,023.8 | 7,589.0 | 11.6 | |
| 2. United States | Off-trade | 744.0 | 622.0 | −3.5 | 580.4 | 591.8 | −1.0 |
| On-trade | 1,560.2 | 1,920.8 | 4.2 | 2,059.8 | 2,103.5 | 1.8 | |
| Total | 2,304.1 | 2,542.9 | 2.0 | 2,640.1 | 2,695.3 | 1.2 | |
| 3. United Kingdom | Off-trade | 210.4 | 263.8 | 4.6 | 284.0 | 322.9 | 4.1 |
| On-trade | 1,105.8 | 1,210.1 | 1.8 | 1,347.7 | 1,571.9 | 5.4 | |
| Total | 1,316.1 | 1,474.0 | 2.3 | 1,631.8 | 1,894.7 | 5.1 | |
| 4. Ireland | Off-trade | 83.0 | 89.9 | 1.6 | 100.7 | 121.1 | 6.1 |
| On-trade | 1,053.2 | 1,216.4 | 2.9 | 1,359.5 | 1,515.4 | 4.5 | |
| Total | 1,136.2 | 1,306.3 | 2.8 | 1,460.2 | 1,636.5 | 4.6 | |
| 5. Kenya | Off-trade | 18.2 | 32.1 | 12.0 | 36.5 | 60.9 | 13.7 |
| On-trade | 389.6 | 599.6 | 9.0 | 688.0 | 1,109.6 | 13.1 | |
| Total | 407.9 | 631.7 | 9.1 | 724.6 | 1,170.5 | 13.1 | |
| 6. Cameroon | Off-trade | 58.5 | 91.5 | 9.4 | 97.3 | 139.7 | 8.8 |
| On-trade | 270.9 | 420.1 | 9.2 | 476.3 | 868.5 | 15.6 | |
| Total | 329.4 | 511.6 | 9.2 | 573.6 | 1,008.2 | 14.5 | |
| 7. Italy | Off-trade | 106.2 | 124.5 | 3.2 | 135.0 | 149.8 | 3.8 |
| On-trade | 386.3 | 372.3 | −0.7 | 419.3 | 543.1 | 7.8 | |
| Total | 492.5 | 496.8 | 0.2 | 554.4 | 693.0 | 6.9 | |
| 8. Uganda | Off-trade | 19.5 | 43.9 | 17.6 | 52.7 | 149.3 | 27.7 |
| On-trade | 173.2 | 339.7 | 14.4 | 419.2 | 918.4 | 22.0 | |
| Total | 192.7 | 383.6 | 14.8 | 471.9 | 1,067.7 | 22.7 | |
| 9. South Africa | Off-trade | 142.5 | 216.5 | 8.7 | 237.6 | 326.5 | 8.6 |
| On-trade | 89.7 | 145.2 | 10.1 | 160.7 | 226.3 | 9.3 | |
| Total | 232.1 | 361.7 | 9.3 | 398.2 | 552.8 | 8.9 | |
| 10. Malaysia | Off-trade | 42.2 | 64.0 | 8.7 | 69.2 | 85.9 | 6.1 |
| On-trade | 245.5 | 283.3 | 2.9 | 321.4 | 470.5 | 10.7 | |
| Total | 287.7 | 347.3 | 3.8 | 390.6 | 556.4 | 9.9 | |
| Sub-total (top 10 markets) | Off-trade | 1,839.7 | 2,464.8 | 6.0 | 2,635.1 | 3,443.2 |
6.9 |
| On-trade | 6,980.0 | 9,969.7 | 7.4 | 11,233.9 | 15,420.8 | 9.1 | |
| Total | 8,819.5 | 12,434.7 | 7.1 | 13,869.2 | 18,864.1 | 8.7 | |
| Canada (18th) | Off-trade | 39.5 | 37.6 | −1.0 | 36.4 | 32.2 | −3.1 |
| On-trade | 116.7 | 88.4 | −5.4 | 96.0 | 105.1 | 3.5 | |
| Total | 156.2 | 126.0 | −4.2 | 132.4 | 137.3 | 1.7 | |
|
Source: Euromonitor International, 2024 *CAGR: Compound Annual Growth Rate |
|||||||
| Market | 2017 | 2022 | CAGR* % 2017-2022 | 2023 | 2027 | CAGR* % 2022-2027 | |
|---|---|---|---|---|---|---|---|
| World - Stout beer | Off-trade | 753.2 | 866.1 | 2.8 | 888.1 | 1,043.6 | 3.8 |
| On-trade | 1,144.8 | 1,270.5 | 2.1 | 1,362.3 | 1,721.7 | 6.3 | |
| Total | 1,898.0 | 2,136.6 | 2.4 | 2,250.4 | 2,765.4 | 5.3 | |
| 1. China | Off-trade | 68.4 | 140.6 | 15.5 | 155.0 | 207.3 | 8.1 |
| On-trade | 132.6 | 235.2 | 12.1 | 260.3 | 366.2 | 9.3 | |
| Total | 201.0 | 375.8 | 13.3 | 415.2 | 573.5 | 8.8 | |
| 2. United States | Off-trade | 148.8 | 109.4 | −6.0 | 98.3 | 91.3 | −3.6 |
| On-trade | 105.4 | 113.4 | 1.5 | 119.4 | 112.0 | −0.2 | |
| Total | 254.2 | 222.7 | −2.6 | 217.7 | 203.3 | −1.8 | |
| 3. United Kingdom | Off-trade | 44.2 | 47.0 | 1.2 | 46.8 | 47.9 | 0.4 |
| On-trade | 147.7 | 134.4 | −1.9 | 137.8 | 143.8 | 1.4 | |
| Total | 191.8 | 181.4 | −1.1 | 184.6 | 191.7 | 1.1 | |
| 4. Cameroon | Off-trade | 27.9 | 38.5 | 6.7 | 40.2 | 52.4 | 6.4 |
| On-trade | 89.0 | 113.0 | 4.9 | 125.8 | 208.4 | 13.0 | |
| Total | 116.8 | 151.4 | 5.3 | 166.1 | 260.8 | 11.5 | |
| 5. Ireland | Off-trade | 18.9 | 18.4 | −0.5 | 18.6 | 20.5 | 2.2 |
| On-trade | 104.9 | 104.2 | −0.1 | 107.3 | 107.5 | 0.6 | |
| Total | 123.8 | 122.6 | −0.2 | 125.9 | 128.0 | 0.9 | |
| 6. South Africa | Off-trade | 68.8 | 81.8 | 3.5 | 84.6 | 95.4 | 3.1 |
| On-trade | 27.4 | 32.7 | 3.6 | 34.2 | 40.1 | 4.2 | |
| Total | 96.2 | 114.5 | 3.5 | 118.8 | 135.5 | 3.4 | |
| 7. Uganda | Off-trade | 7.1 | 11.1 | 9.3 | 11.9 | 20.8 | 13.4 |
| On-trade | 73.9 | 94.0 | 4.9 | 105.3 | 146.2 | 9.2 | |
| Total | 80.9 | 105.2 | 5.4 | 117.2 | 167.1 | 9.7 | |
| 8. Kenya | Off-trade | 4.5 | 6.3 | 7.0 | 6.8 | 9.2 | 7.9 |
| On-trade | 67.0 | 68.8 | 0.5 | 71.9 | 85.0 | 4.3 | |
| Total | 71.5 | 75.1 | 1.0 | 78.7 | 94.2 | 4.6 | |
| 9. Italy | Off-trade | 20.8 | 21.2 | 0.4 | 21.4 | 21.8 | 0.6 |
| On-trade | 21.3 | 17.8 | −3.5 | 18.6 | 22.0 | 4.3 | |
| Total | 42.1 | 39.0 | −1.5 | 39.9 | 43.7 | 2.3 | |
| 10. Malaysia | Off-trade | 7.6 | 10.0 | 5.6 | 10.1 | 10.7 | 1.4% |
| On-trade | 17.1 | 16.1 | −1.2 | 16.7 | 19.2 | 3.6 | |
| Total | 24.7 | 26.0 | 1.0 | 26.9 | 29.9 | 2.8 | |
| Sub-total (top 10 markets) | Off-trade | 417.0 | 484.3 | 3.0 | 493.7 | 577.3 | 3.6 |
| On-trade | 786.3 | 929.6 | 3.4 | 997.3 | 1,250.4 | 6.1 | |
| Total | 1,203.0 | 1,413.7 | 3.3 | 1,491.0 | 1,827.7 | 5.3 | |
| Canada (18th in value) | Off-trade | 8.2 | 7.1 | −2.8 | 6.6 | 5.5 | −5.0 |
| On-trade | 7.2 | 4.9 | −7.4 | 5.1 | 5.3 | 1.6 | |
| Total | 15.3 | 12.0 | −4.7 | 11.7 | 10.8 | −2.1 | |
|
Source: Euromonitor International, 2024 *CAGR: Compound Annual Growth Rate |
|||||||
Competitive landscape - Stout beer
In 2022, the leading global companies in the Stout beer category were Diageo Plc (brand: Guinness) at a global market value share of 36.4% (US$5.9 billion), Heineken NV (brands: Murphy's, Zywiec, Beamish, ABC Extra Stout, Pelforth) at 3.9% (US$624.4 million), and Anheuser-Busch InBev NV (brands: Castle, Quilmes, Pilsen, Trophy) at a market share of 3.1% (US$501.7 million). There were no private label brands reported in the Stout category.
| Market | Company | Top brand(s) | Retail sales (US$M) | Market share % in 2022 |
|---|---|---|---|---|
| China | Diageo Plc | Guinness | 53.4 | 1.2 |
| Total - Stout in China | 4,378.8 | 100.0 | ||
| United States | Diageo Plc | Guinness | 1,240.2 | 48.8 |
| Total - Stout in the United States | 2,542.9 | 100.0 | ||
| United Kingdom | Diageo Plc | Guinness | 1,381.0 | 93.7 |
| Heineken NV | Murphy's | 35.8 | 2.4 | |
| Asahi Group Holdings Ltd | Fuller's | 5.2 | 0.4 | |
| Anheuser-Busch InBev NV | Mackeson | |||
| Total - Stout in the United Kingdom | 1,474.0 | 100.0 | ||
| Ireland | Diageo Plc | Guinness | 721.5 | 55.2 |
| Heineken NV | Beamish, Murphy's | 140.6 | 10.8 | |
| Total - Stout in Ireland | 1,306.3 | 100.0 | ||
| Kenya | Diageo Plc | Guinness | 332.5 | 52.6 |
| Anheuser-Busch InBev NV | Castle | 69.5 | 11.0 | |
| Total - Stout in Kenya | 631.7 | 100.0 | ||
| Cameroon | Diageo Plc | Guinness | 324.6 | 63.4 |
| Anheuser-Busch InBev NV | Castle | 26.2 | 5.1 | |
| Heineken NV | Pelforth | 6.4 | 1.2 | |
| Total - Stout in Cameroon | 511.6 | 100.0 | ||
| Italy | Heineken NV | Murphy's | 87.8 | 17.7 |
| Diageo Plc | Guinness | 19.7 | 4.0 | |
| Total - Stout in Italy | 496.8 | 100.0 | ||
| Uganda | Total - Stout in Uganda | 383.6 | 100.0 | |
| South Africa | Anheuser-Busch InBev NV | Castle | 316.3 | 87.5 |
| Diageo Plc | Guinness | 3.3 | 0.9 | |
| Total - Stout in South Africa | 361.7 | 100.0 | ||
| Malaysia | Diageo Plc | Guinness | 282.6 | 81.4 |
| Carlsberg A/S | Danish Royal, Connor's Stout Porter | 64.3 | 18.5 | |
| Total - Stout in Malaysia | 347.3 | 100.0 | ||
| Canada | Diageo Plc | Guinness | 115.2 | 91.5 |
| Heineken NV | Murphy's, Beamish | 2.5 | 2.0 | |
| Total - Stout in Canada | 126.0 | 100.0 | ||
| Source: Euromonitor International, 2024 | ||||
Non/low alcohol beer
In 2022, total sales of non/low alcohol beer was US$20.8 billion (6.5 billion litres), which consisted of US$11.1 billion (4.6 billion litres) in off-trade retail sales and US$9.8 billion (1.9 billion litres) in on-trade sales. Off-trade sales grew the most at a CAGR of 12.1% compared to on-trade sales at a CAGR of 4.8% between 2017 and 2022. However, on-trade sales are forecast to turn around with a CAGR of 11.7%, yet still growing lower than off-trade sales (14.1%) between 2022 and 2027.
The largest regions with the most total off/on-trade value sales of non/low alcohol beer were Western Europe (US$8.2 billion), MENA (US$3.6 billion), and Latin America (US$3.1 billion) in 2022. Top regions with the highest total historical value growth (2017 to 2022) were Eastern Europe (CAGR:18.8%), MENA (16.3%), and North America (14.5%); while the Asia Pacific (3.6%) and Latin America (4.2%) have grown at a lower rate over the same period.
Off-trade sales reigned over on-trade sales of non/low alcohol beer throughout the world, bringing in the most value within the following regions: Eastern Europe (off-trade share: 76.4%), Australasia (72.2%), North America (68.8%), Asia Pacific (65.0%), Latin America (59.4%), and MENA (55.3%) in 2022. Alternatively, Western Europe (63%) was the only region that registered higher sales within on-trade sector in 2022.
| Region | 2017 | 2022 | CAGR* % 2017-2022 | 2023 | 2027 | CAGR* % 2022-2027 | |
|---|---|---|---|---|---|---|---|
| World (Total) | Off-trade | 6,259.2 | 11,077.2 | 12.1 | 12,951.6 | 21,413.4 | 14.1 |
| On-trade | 7,738.0 | 9,768.3 | 4.8 | 11,286.0 | 16,952.6 | 11.7 | |
| Total | 13,997.2 | 20,845.5 | 8.3 | 24,237.6 | 38,366.0 | 13.0 | |
| Asia Pacific | Off-trade | 688.6 | 1,015.1 | 8.1 | 1,107.6 | 1,546.7 | 8.8 |
| On-trade | 622.7 | 546.3 | −2.6 | 599.0 | 822.0 | 8.5 | |
| Total | 1,311.3 | 1,561.4 | 3.6 | 1,706.6 | 2,368.7 | 8.7 | |
| Australasia | Off-trade | 568.6 | 931.8 | 10.4 | 1,045.3 | 1,383.7 | 8.2 |
| On-trade | 316.7 | 358.8 | 2.5 | 430.0 | 657.8 | 12.9 | |
| Total | 885.3 | 1,290.6 | 7.8 | 1,475.3 | 2,041.5 | 9.6 | |
| Eastern Europe | Off-trade | 423.9 | 1,228.8 | 23.7 | 1,434.4 | 2,095.1 | 11.3 |
| On-trade | 257.3 | 380.6 | 8.1 | 463.1 | 705.2 | 13.1 | |
| Total | 681.3 | 1,609.4 | 18.8 | 1,897.4 | 2,800.3 | 11.7 | |
| Latin America | Off-trade | 1,226.2 | 1,858.4 | 8.7 | 2,398.1 | 5,769.9 | 25.4 |
| On-trade | 1,327.1 | 1,270.6 | −0.9 | 1,534.5 | 2,527.9 | 14.7 | |
| Total | 2,553.3 | 3,129.1 | 4.2 | 3,932.6 | 8,297.8 | 21.5 | |
| Middle Eastern and Africa | Off-trade | 886.7 | 1,966.4 | 17.3 | 2,355.5 | 4,333.6 | 17.1 |
| On-trade | 786.1 | 1,587.9 | 15.1 | 1,949.3 | 3,844.6 | 19.3 | |
| Total | 1,672.8 | 3,554.4 | 16.3 | 4,304.7 | 8,178.2 | 18.1 | |
| North America | Off-trade | 347.2 | 1,048.7 | 24.7 | 1,287.8 | 2,122.7 | 15.1 |
| On-trade | 427.5 | 475.9 | 2.2 | 561.4 | 863.7 | 12.7 | |
| Total | 774.7 | 1,524.6 | 14.5 | 1,849.2 | 2,986.5 | 14.4 | |
| Western Europe | Off-trade | 2,118.1 | 3,027.8 | 7.4 | 3,323.0 | 4,161.6 | 6.6 |
| On-trade | 4,000.4 | 5,148.1 | 5.2 | 5,748.7 | 7,531.4 | 7.9 | |
| Total | 6,118.5 | 8,176.0 | 6.0 | 9,071.7 | 11,693.0 | 7.4 | |
|
Source: Euromonitor International, 2024 *CAGR: Compound Annual Growth Rate |
|||||||
| Region | 2017 | 2022 | CAGR* % 2017-2022 | 2023 | 2027 | CAGR* % 2022-2027 | |
|---|---|---|---|---|---|---|---|
| World (Total) | Off-trade | 3,754.3 | 4,633.8 | 4.3 | 4,890.1 | 6,280.6 | 6.3 |
| On-trade | 1,845.2 | 1,869.9 | 0.3 | 1,998.4 | 2,491.2 | 5.9 | |
| Total | 5,599.5 | 6,503.6 | 3.0 | 6,888.4 | 8,771.8 | 6.2 | |
| Asia Pacific | Off-trade | 291.1 | 393.4 | 6.2 | 409.5 | 493.4 | 4.6 |
| On-trade | 79.6 | 77.0 | −0.7 | 82.1 | 102.0 | 5.8 | |
| Total | 370.7 | 470.3 | 4.9 | 491.6 | 595.4 | 4.8 | |
| Australasia | Off-trade | 139.1 | 198.7 | 7.4 | 208.0 | 247.9 | 4.5 |
| On-trade | 52.5 | 49.3 | −1.2 | 54.3 | 74.6 | 8.6 | |
| Total | 191.6 | 248.0 | 5.3 | 262.3 | 322.5 | 5.4 | |
| Eastern Europe | Off-trade | 284.5 | 623.6 | 17.0 | 652.1 | 796.8 | 5.0 |
| On-trade | 81.1 | 87.3 | 1.5 | 95.9 | 126.3 | 7.7 | |
| Total | 365.6 | 710.9 | 14.2 | 748.1 | 923.1 | 5.4 | |
| Latin America | Off-trade | 806.0 | 821.3 | 0.4 | 939.6 | 1,634.0 | 14.7 |
| On-trade | 311.4 | 276.0 | −2.4 | 311.3 | 431.0 | 9.3 | |
| Total | 1,117.4 | 1,097.3 | −0.4 | 1,250.9 | 2,065.0 | 13.5 | |
| Middle Eastern and Africa | Off-trade | 894.2 | 868.1 | −0.6 | 893.0 | 1,039.0 | 3.7 |
| On-trade | 562.2 | 525.6 | −1.3 | 541.2 | 664.8 | 4.8 | |
| Total | 1,456.4 | 1,393.7 | −0.9 | 1,434.1 | 1,703.8 | 4.1 | |
| North America | Off-trade | 137.5 | 262.7 | 13.8 | 292.5 | 425.7 | 10.1 |
| On-trade | 62.7 | 54.1 | −2.9 | 62.8 | 86.6 | 9.9 | |
| Total | 200.2 | 316.8 | 9.6 | 355.3 | 512.3 | 10.1 | |
| Western Europe | Off-trade | 1,201.9 | 1,466.0 | 4.1 | 1,495.4 | 1,643.9 | 2.3 |
| On-trade | 695.8 | 800.6 | 2.8 | 850.7 | 1,005.8 | 4.7 | |
| Total | 1,897.7 | 2,266.6 | 3.6 | 2,346.1 | 2,649.7 | 3.2 | |
|
Source: Euromonitor International, 2024 *CAGR: Compound Annual Growth Rate |
|||||||
In 2022, leading non/low alcohol beer markets registering the highest total on/off-trade sales were Spain at US$2.7 billion (657.4 million litres), Germany at US$2.65 billion (1,022.4 million litres), the United States at US$1.3 billion (270.8 million litres), Australia at US$1.2 billion (240.4 million litres), and Brazil at US$1.1 billion (393.6 million litres). Canada was the 20th largest market in terms of value sales at US$214.1 million (46 million litres) in 2022.
Within the top 10 markets (including Canada) in 2022, those countries with larger off-trade non/low alcohol beer sales were Germany (off-trade share: 52.6%), the US (67.4%), Australia (74.7%), Brazil (75%), Japan (66.4%), Iran (58.1%), and Canada (77.5%). Alternatively, Spain (on-trade share: 90.3%), Nigeria (60.2%), Colombia (51.9%), and the Netherlands (72.7%) were regions that registered higher sales within the on-trade sector in 2022.
| Region | 2017 | 2022 | CAGR* % 2017-2022 | 2023 | 2027 | CAGR* % 2022-2027 | |
|---|---|---|---|---|---|---|---|
| World - non/low alcohol beer | Off-trade | 6,259.2 | 11,077.2 | 12.1 | 12,951.6 | 21,413.4 | 14.1 |
| On-trade | 7,738.0 | 9,768.3 | 4.8 | 11,286.0 | 16,952.6 | 11.7 | |
| Total | 13,997.2 | 20,845.5 | 8.3 | 24,237.6 | 38,366.0 | 13.0 | |
| 1. Spain | Off-trade | 218.2 | 267.5 | 4.2 | 290.3 | 370.5 | 6.7 |
| On-trade | 2,038.9 | 2,476.6 | 4.0 | 2,752.5 | 3,807.9 | 9.0 | |
| Total | 2,257.1 | 2,744.1 | 4.0 | 3,042.7 | 4,178.4 | 8.8 | |
| 2. Germany | Off-trade | 1,173.6 | 1,396.3 | 3.5 | 1,494.4 | 1,672.6 | 3.7 |
| On-trade | 1,064.2 | 1,256.5 | 3.4 | 1,356.6 | 1,503.0 | 3.6 | |
| Total | 2,237.8 | 2,652.8 | 3.5 | 2,850.9 | 3,175.6 | 3.7 | |
| 3. United States | Off-trade | 298.7 | 882.9 | 24.2 | 1,091.0 | 1,774.5 | 15.0 |
| On-trade | 401.2 | 427.6 | 1.3 | 503.2 | 770.5 | 12.5 | |
| Total | 699.9 | 1,310.5 | 13.4 | 1,594.3 | 2,545.0 | 14.2 | |
| 4. Australia | Off-trade | 558.2 | 914.2 | 10.4 | 1,026.3 | 1,361.2 | 8.3 |
| On-trade | 287.6 | 310.3 | 1.5 | 376.5 | 590.3 | 13.7 | |
| Total | 845.7 | 1,224.4 | 7.7 | 1,402.8 | 1,951.5 | 9.8 | |
| 5. Brazil | Off-trade | 142.3 | 817.8 | 41.9 | 1,190.7 | 3,614.0 | 34.6 |
| On-trade | 87.3 | 273.2 | 25.6 | 343.0 | 595.4 | 16.9 | |
| Total | 229.6 | 1,091.0 | 36.6 | 1,533.7 | 4,209.4 | 31.0 | |
| 6. Japan | Off-trade | 550.1 | 711.9 | 5.3 | 749.1 | 887.4 | 4.5 |
| On-trade | 481.4 | 359.6 | −5.7 | 376.4 | 414.1 | 2.9 | |
| Total | 1,031.6 | 1,071.5 | 0.8 | 1,125.5 | 1,301.4 | 4.0 | |
| 7. Nigeria | Off-trade | 223.9 | 416.9 | 13.2 | 528.6 | 1,150.0 | 22.5 |
| On-trade | 369.7 | 629.7 | 11.2 | 804.1 | 1,876.1 | 24.4 | |
| Total | 593.6 | 1,046.6 | 12.0 | 1,332.8 | 3,026.1 | 23.7 | |
| 8. Iran | Off-trade | 40.4 | 523.6 | 66.9 | 666.2 | 1,364.3 | 21.1 |
| On-trade | 33.1 | 376.9 | 62.7 | 465.5 | 897.2 | 18.9 | |
| Total | 73.5 | 900.5 | 65.1 | 1,131.7 | 2,261.4 | 20.2 | |
| 9. Colombia | Off-trade | 636.7 | 409.7 | −8.4 | 429.9 | 514.9 | 4.7 |
| On-trade | 659.9 | 442.9 | −7.7 | 528.7 | 909.1 | 15.5 | |
| Total | 1,296.6 | 852.6 | −8.0 | 958.6 | 1,423.9 | 10.8 | |
| 10. Netherlands | Off-trade | 82.4 | 168.8 | 15.4 | 186.8 | 217.3 | 5.2 |
| On-trade | 170.1 | 449.5 | 21.5 | 516.7 | 632.1 | 7.1 | |
| Total | 252.5 | 618.3 | 19.6 | 703.5 | 849.3 | 6.6 | |
| Sub-total (top 10 markets) | Off-trade | 3,924.5 | 6,509.6 | 10.7 | 7,653.3 | 12,926.7 | 14.7 |
| On-trade | 13,331.4 | 16,771.1 | 4.7 | 19,309.2 | 28,948.3 | 11.5 | |
| Total | 9,517.9 | 13,512.3 | 7.3 | 15,676.5 | 24,922.0 | 13.0 | |
| Canada (20th) | Off-trade | 48.5 | 165.9 | 27.9 | 196.7 | 348.3 | 16.0 |
| On-trade | 26.2 | 48.2 | 13.0 | 58.2 | 93.3 | 14.1 | |
| Total | 74.8 | 214.1 | 23.4 | 254.9 | 441.5 | 15.6 | |
|
Source: Euromonitor International, 2024 *CAGR: Compound Annual Growth Rate |
|||||||
| Region | 2017 | 2022 | CAGR* % 2017-2022 | 2023 | 2027 | CAGR* % 2022-2027 | |
|---|---|---|---|---|---|---|---|
| World - non/low alcohol beer | Off-trade | 3,754.3 | 4,633.8 | 4.3 | 4,890.1 | 6,280.6 | 6.3 |
| On-trade | 1,845.2 | 1,869.9 | 0.3 | 1,998.4 | 2,491.2 | 5.9 | |
| Total | 5,599.5 | 6,503.6 | 3.0 | 6,888.4 | 8,771.8 | 6.2 | |
| 1. Germany | Off-trade | 731.9 | 812.2 | 2.1 | 813.4 | 835.0 | 0.6 |
| On-trade | 196.4 | 210.2 | 1.4 | 212.6 | 214.6 | 0.4 | |
| Total | 928.3 | 1,022.4 | 1.9 | 1,026.0 | 1,049.6 | 0.5 | |
| 2. Spain | Off-trade | 174.1 | 200.7 | 2.9 | 205.7 | 230.4 | 2.8 |
| On-trade | 399.6 | 456.7 | 2.7 | 493.7 | 614.7 | 6.1 | |
| Total | 573.7 | 657.4 | 2.8 | 699.4 | 845.1 | 5.2 | |
| 3. Nigeria | Off-trade | 172.3 | 184.9 | 1.4 | 196.4 | 259.5 | 7.0 |
| On-trade | 243.2 | 258.5 | 1.2 | 276.6 | 383.3 | 8.2 | |
| Total | 415.5 | 443.3 | 1.3 | 472.9 | 642.8 | 7.7 | |
| 4. Colombia | Off-trade | 496.7 | 292.6 | −10.0 | 282.3 | 287.0 | −0.4 |
| On-trade | 190.9 | 132.5 | −7.0 | 146.0 | 215.1 | 10.2 | |
| Total | 687.5 | 425.1 | −9.2 | 428.3 | 502.1 | 3.4 | |
| 5. Iran | Off-trade | 320.4 | 267.4 | −3.6 | 264.3 | 267.0 | 0.0 |
| On-trade | 207.2 | 154.2 | −5.7 | 147.7 | 145.4 | −1.2 | |
| Total | 527.6 | 421.6 | −4.4 | 412.1 | 412.4 | −0.4 | |
| 6. Brazil | Off-trade | 89.8 | 322.6 | 29.1 | 432.4 | 1,048.8 | 26.6 |
| On-trade | 36.4 | 71.0 | 14.3 | 83.0 | 109.1 | 9.0 | |
| Total | 126.2 | 393.6 | 25.5 | 515.4 | 1,158.0 | 24.1 | |
| 7. Japan | Off-trade | 206.2 | 249.9 | 3.9 | 254.7 | 282.4 | 2.5 |
| On-trade | 44.7 | 27.8 | −9.1 | 28.6 | 30.4 | 1.8 | |
| Total | 250.9 | 277.7 | 2.1 | 283.3 | 312.8 | 2.4 | |
| 8. United States | Off-trade | 123.0 | 221.3 | 12.5 | 245.2 | 347.6 | 9.5 |
| On-trade | 59.8 | 49.5 | −3.7 | 57.5 | 78.5 | 9.7 | |
| Total | 182.8 | 270.8 | 8.2 | 302.7 | 426.0 | 9.5 | |
| 9. Australia | Off-trade | 134.8 | 194.6 | 7.6 | 204.0 | 244.1 | 4.6 |
| On-trade | 48.8 | 45.8 | −1.3 | 50.7 | 70.6 | 9.0 | |
| Total | 183.7 | 240.4 | 5.5 | 254.7 | 314.8 | 5.5 | |
| 10. Netherlands | Off-trade | 37.2 | 65.3 | 11.9 | 66.2 | 70.0 | 1.4 |
| On-trade | 18.8 | 40.2 | 16.4 | 41.7 | 45.4 | 2.5 | |
| Total | 56.0 | 105.5 | 13.5 | 107.9 | 115.4 | 1.8 | |
| Sub-total (top 10 markets) | Off-trade | 2,486.4 | 2,811.5 | 2.5 | 2,964.6 | 3,871.8 | 6.6 |
| On-trade | 3,291.0 | 3,316.3 | 0.2 | 3,536.5 | 4,398.3 | 5.8 | |
| Total | 3,932.2 | 4,257.8 | 1.6 | 4,502.7 | 5,779.0 | 6.3 | |
| Canada (20th) | Off-trade | 14.5 | 41.4 | 23.3 | 47.3 | 78.2 | 13.6 |
| On-trade | 2.9 | 4.6 | 9.7 | 5.3 | 8.1 | 12.0 | |
| Total | 17.4 | 46.0 | 21.5 | 52.7 | 86.3 | 13.4 | |
|
Source: Euromonitor International, 2024 *CAGR: Compound Annual Growth Rate |
|||||||
Competitive landscape - non/low alcohol beer
In 2022, the leading global companies in the non/low alcohol beer category were Heineken NV (top brands: Heineken, Buckler, Fayrouz, Amstel) at a global market value share of 17.1% (US$3.6 billion), Anheuser-Busch InBev NV (top brands: Aguila, Brahma, Pilsener, O'Doul's) at 15.3% (US$3.2 billion), and Asahi Group Holdings Ltd. (top brands: Asahi, Carlton, Great Northern, Lech) at a market share of 6.5% (US$1.4 billion). Private labels throughout the world registered a market value share of 0.8% (US$173.2 million) in 2022. The Adult Non-Alcoholic Beverage Association (ANBA), established in 2021 to advocate for the growing non alcoholic drinks industry, continues to increase its membership across its global chapters.Footnote 1
| Market | Company | Top brand(s) | Retail sales (US$M) | Market share % in 2022 |
|---|---|---|---|---|
| Spain | Grupo Mahou-San Miguel SA | San Miguel, Mahou, Alhambra | 865.6 | 31.5 |
| Heineken NV | Buckler, Amsel, Heineken, Cruzcampo | 701.4 | 25.6 | |
| Damm SA | Free Damm | 128.2 | 4.7 | |
| Private label | Private label | 101.6 | 3.7 | |
| Total - non/low alcohol beer in Spain | 2,744.1 | 100.0 | ||
| Germany | Oetker-Gruppe | Clausthaler, Jever | 384.6 | 14.5 |
| Glaabsbräu KG | Vitamalz | 124.8 | 4.7 | |
| Anheuser-Busch InBev NV | Franziskaner, Beck's | 120.5 | 4.5 | |
| Total - non/low alcohol beer in Germany | 2,652.8 | 100.0 | ||
| United States | Anheuser-Busch InBev NV | O'Doul's, Budweiser, Busch, Haake Beck, St Pauli Girl, Beck's | 354.1 | 27.0 |
| Heineken NV | Heineken, Amstel, Lagunitas, Buckler | 228.0 | 17.4 | |
| Molson Coors Brewing Co | Miller, Coors, Sharp's | 177.1 | 13.5 | |
| Total - non/low alcohol beer in the USA | 1,310.5 | 100.0 | ||
| Australia | Asahi Group Holdings Ltd. | Carlton, Great Northern, Peroni, Asahi, Pure Blonde, Foster's | 516.6 | 42.2 |
| Kirin Holdings Co Ltd. | XXXX, Iron Jack, Hahn, Jame's Boag's | 499.3 | 40.8 | |
| Anheuser-Busch InBev NV | Cascade | 54.1 | 4.4 | |
| Total - non/low alcohol beer in Australia | 1,224.4 | 100.0 | ||
| Brazil | Anheuser-Busch InBev NV | Brahma, Kronenbier | 648.0 | 59.4 |
| Heineken NV | Heineken | 179.4 | 16.4 | |
| Cervejaria Petrópolis SA | Itaipava | 27.4 | 2.5 | |
| Total - non/low alcohol beer in Brazil | 1,091.0 | 100.0 | ||
| Japan | Suntory Holdings Ltd. | All Free | 415.9 | 38.8 |
| Asahi Group Holdings Ltd. | Asahi, Beery | 414.5 | 38.7 | |
| Kirin Holdings Co Ltd. | Zero Ichi, Green's/Karada/Kirin Free | 173.4 | 16.2 | |
| Private label | Private label | 8.5 | 0.8 | |
| Total - non/low alcohol beer in Japan | 1,071.5 | 100.0 | ||
| Nigeria | Heineken NV | Maltina, Fayrouz, Hi Malt, Malta Gold | 724.6 | 69.2 |
| Diageo Plc | Malta Guinness, Dubic, Alvaro | 292.1 | 27.9 | |
| Total - non/low alcohol beer in Nigeria | 1,046.6 | 100.0 | ||
| Iran | Total - non/low alcohol beer in Iran | 900.5 | 100.0 | |
| Colombia | Anheuser-Busch InBev NV | Aguila, Michelob | 820.2 | 96.2 |
| Central Cervecera de Colombia SAS | Andina | 31.7 | 3.7 | |
| Total - non/low alcohol beer in Colombia | 852.6 | 100.0 | ||
| Netherlands | Heineken NV | Heineken, Amstel, Brand, Wieckse Witte, Affligem, Moretti, Desperados | 227.3 | 36.8 |
| Swinkels Family Brewers NV | Bavaria, Palm | 79.6 | 12.9 | |
| Asahi Group Holdings Ltd. | Grolsch | 73.4 | 11.9 | |
| Total - non/low alcohol beer in the Netherlands | 618.3 | 100.0 | ||
| Canada | Anheuser-Busch InBev NV | Budweiser, Labatt, Beck's, O'Doul's | 117.6 | 54.9 |
| Molson Coors Brewing Co | Coors, Molson | 46.0 | 21.5 | |
| Heineken NV | Heineken | 29.3 | 13.7 | |
| Total - non/low alcohol beer in Canada | 214.1 | 100.0 | ||
| Source: Euromonitor International, 2024 | ||||
New product launches across the world
Malt ingredients (excluding malt extract)
Mintel indicated that there were 24,751 new food (8,574), drink (16,031), health (36), and petfood (110) products containing malt ingredients (excluding malt extract) launched globally across grocery retailer outlets (including new variety/range extension, packaging, formulation or relaunched) between the period of January 2019 and March 27, 2024. Leading markets launching the most malt ingredient products were France (9.3%), Brazil (6.5%), China (5.4%), UK (4.7%), USA (4.2%), Italy (3.9%), Germany (3.5%), Japan (2.9%), Vietnam (2.8%), and South Korea (2.8%). Canada was the 16th largest market (2.0%), launching 484 products containing malt (excluding extract) over this period.
Brazil manufactured and introduced the largest amount of related new products (1,353) between January 2019 and March 27, 2024. China released 1,077 new malt products (excluding extract) during this period, followed by the UK (793), France (729), Germany (722), Italy (513), USA (491), Belgium (448), Mexico (347), and Argentina (334). Including the other top 10 leading markets that registered the highest total retail sales (on/off-trade) of beer in 2022: Japan was the 24th largest country manufacturing 108 malt products (not including malt extract), Spain (14th largest at 195 products) , and Russia (42nd largest at 34 products).
Canada was the 19th largest manufacturer of these malt products (161) - which was the 10th largest market in terms of total on/off-trade retail sales of beer - recently released six new variety or range extension/packaging malt products in 2024: including a seasonal chocolate popcorn (manufacturer: Saxon Chocolates), a Danish Lite light beer (Carlsberg), a Bella Sangria Rosada alcoholic malt beverage (St-Loup & Cie, not imported), a Lager beer (Stella Artois, not imported), a Crowd Surf Motel Passion Fruit IPA (Flying Monkeys, not imported), and a Hazy Days Juicy IPA (Cowbell Brewing Co., not imported) - all beverages made with malted barley. A brand new product manufactured in Canada and launched in Edmonton (not imported) in January 2024, was an assorted granola bars product made by PepsiCo (brand: Quaker Chewy Fruity Fun snacks) that contains barley malt.
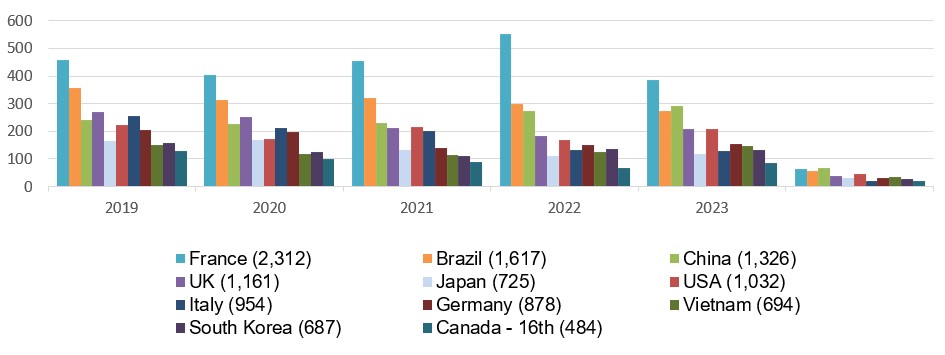
Description of above image
| Country | 2019 | 2020 | 2021 | 2022 | 2023 | 2024 | Total |
|---|---|---|---|---|---|---|---|
| France | 457 | 402 | 453 | 552 | 385 | 63 | 2,312 |
| Brazil | 356 | 312 | 319 | 299 | 274 | 57 | 1,617 |
| China | 241 | 225 | 229 | 273 | 291 | 67 | 1,326 |
| United Kingdom | 270 | 250 | 213 | 182 | 209 | 37 | 1,161 |
| United States | 224 | 174 | 216 | 167 | 207 | 44 | 1,032 |
| Italy | 256 | 212 | 202 | 133 | 130 | 21 | 954 |
| Germany | 206 | 197 | 140 | 149 | 154 | 32 | 878 |
| Japan | 165 | 170 | 132 | 109 | 119 | 30 | 725 |
| Vietnam | 152 | 119 | 114 | 126 | 148 | 35 | 694 |
| South Korea | 157 | 126 | 110 | 136 | 131 | 27 | 687 |
| Canada - 16th | 128 | 99 | 88 | 66 | 84 | 19 | 484 |
Source: Mintel, 2024
Innovative brand new product launches (8) in the 2023-2024 (Jan-Mar 27th) review period that contained Pilsner (7) and/or Munich - barley or Carared (2) malt: include six beverages that were mostly domestic products from Poland such as a Blueberry Milk Stout Beer from Browar Sady (brand: Browar Moczybroda, Munich malt, not imported), APA Beer from Browar Spoldzielczy Spoldzielnia Socjalna DALBA (Auchan Pewni Dobrego, Pilsner malt, not imported), Non-Alcoholic Craft Beer from Fifny Fyrtel (Browar Szreniawa, Pilsner/Munich barley malt), Amarillo Seed Rye IPA Beer from Piwowarska Grupa Rzemieslnicza (Przetwornia Chmielu, Pilsner malt and malted rye), Unfiltered Lager Beer from Browar Bojanowo (Bojan Karkonosz, Pilsner barley and wheat malt, not imported), and Honey Beer from Browar Bojanowo (Bojan Karkonosz, Pilsner/wheat malt, not imported). In February 2024, Belgium launched a Nordic Hopster Juicy Session IPA from Brasserie Anderes - Beerstorming (brand: Beer Storming, Pilsner malt and Munich Carared) and Denmark released in October 2023 a Beer #Year of the Lager alcoholic beverage from De Proef Brouwerij (Mikkeller Budvar, Pilsner malt).
Examples of brand new products that were launched in the 2023-2024 period that contain malted rye (19) and/or corn malt (13) include: a Beer Assortment 6-pack (including Christmas, Amber, Blonde, Ale, Fruit, Triple Beer) made by Brasserie 3 Mâts released in France in March 2024 (brand: 3 Mâts, containing malts and rye malt); Classic Croissants made by/brand name Golosi di Salute released in Italy in January 2024 (contains barley and corn malt); Mini Macaron made by Akkond (importer Tian Cheng Trade) released in January 2024 (Akkoha, contains malt juice, barley and malted rye); and a Four Grain Stout Beer made by/brand name Microbrasserie Horla released in France in January 2024 (contains organic barley, rye, wheat malts and oat flakes).
Leading global companies launching malt ingredient (excluding malt extract) products (5,182) between Q1-2023 and Q1-2024 were Anheuser-Busch InBev (207), Heineken (178), Carlsberg (153), Kellogg (89), Nestlé (81), and Suntory (69). Top brands over the 5-year period were Heineken (233), BrewDog (191), Carlsberg (141), Suntory The Premium Malt's (119), Tsingtao (108), Stella Artois (97), Budweiser (94), Leffe (82), Horlicks (76), and Nestlé Fitness (75). New brands launched for the first time within the last six months include Birell Active (citris mix and Guarana flavoured non-alcoholic Radler beer with caffeine), Lehn's Bier (Weizen pure malt beer), Legend Twist (ginger flavoured stout), and Gateaux Petits (almond cake with raspberries and toasted almonds).
Top growing categories for malt products (excluding malt extract) were chocolate confectionery (+286.7%), meals and meal centers (+262.5%), carbonated soft drinks (+100%), bakery (+15.9%), and hot beverages (+12.5%); while declining categories were sauces and seasonings (−50%), breakfast cereals (−42.3%), dairy (−40%), snacks (−30.2%), and alcoholic beverages (−7.4%) between Q1-2023 and Q1-2024. New ingredients appearing within the last 12 months in these malt products included shrimp roe, Gardenia red, pepper seed, Frigate Mackerel, bone broth, and green grape juice concentrate. The fastest growing flavours in these products were red fruit (+400%), cranberry, lemonade, herbs/herbal (+300%), and crisped/puffed rice, turmeric/curcuma/haldi (+200%) between Q1-2022 and Q1-2024.
Top related claims and claim combinations used most often in the last three months for malt product launches included environmentally friendly package (30.3%), ethical - recycling (25.4%), social media (16%), ethical - sustainable habitat/resources (13.4%), premium (12.1%), environmental friendly products (11.6%), seasonal (10.3%), no additives/preservatives (9.1%), not pasteurized (5.7%), vitamins/minerals plus (5%), organic (3.6%), and diet/light (2.5%). Top growing claims were functional - immune system (+300%), functional - bone health (+225%), functional - other (+200%), functional - digestive (+166.7%), and low/no/reduced glycemic (+100%) between Q4-2022 and Q4-2023. Meanwhile during the same period, declining claims by −100% were functional pet - eyesight, diabetic, probiotic, novel, antioxidant. Also, between this period top packaging types or material combinations were can, metal aluminium (+9%), flexible - plastic (−10.9%), bottle (−25.5%), glass coloured bottle (−24.5%), and can (+11.5%).
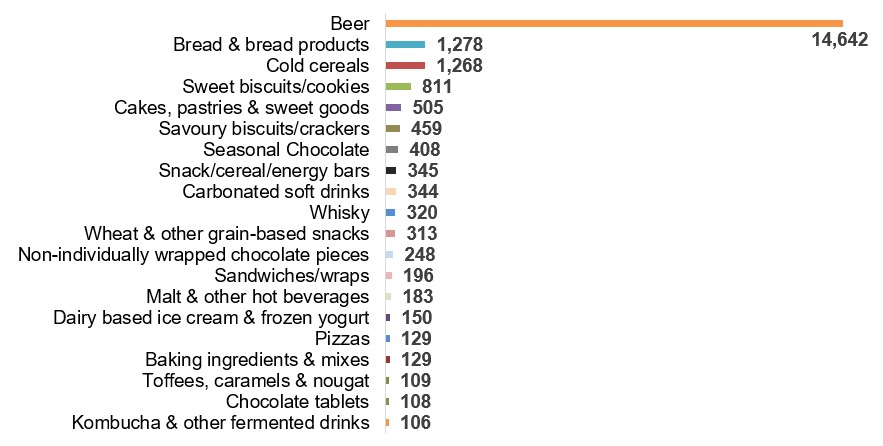
Description of above image
- Beer: 14,642
- Bread and bread products: 1,278
- Cold cereals: 1,268
- Sweet biscuits/cookies: 811
- Cakes, pastries and sweet goods: 505
- Savoury biscuits/crackers: 459
- Seasonal Chocolate: 408
- Snack/cereal/energy bars: 345
- Carbonated soft drinks: 344
- Whisky: 320
- Wheat and other grain-based snacks: 313
- Non-individually wrapped chocolate pieces: 248
- Sandwiches/wraps: 196
- Malt and other hot beverages: 183
- Dairy based ice cream and frozen yogurt: 150
- Baking ingredients and mixes: 129
- Pizzas: 129
- Toffees, caramels and nougat: 109
- Chocolate tablets: 108
- Kombucha and other fermented drinks: 106
Source: Mintel, 2024
Total item count: 24,751
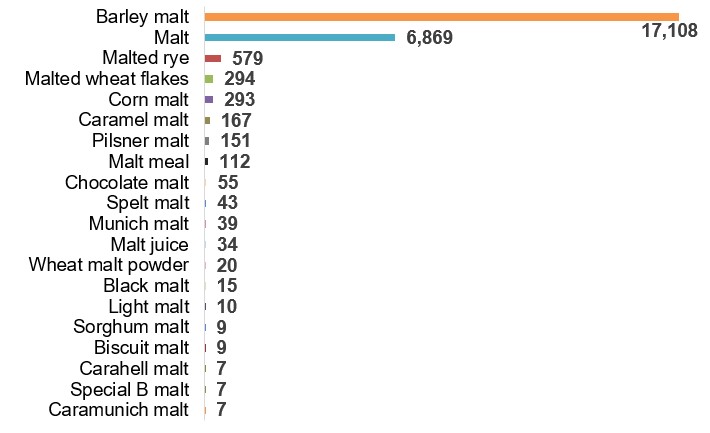
Description of above image
- Barley malt: 17,108
- Malt: 6,869
- Malted rye: 579
- Malted wheat flakes: 294
- Corn malt: 293
- Caramel malt: 167
- Pilsner malt: 151
- Malt meal: 112
- Chocolate malt: 55
- Spelt malt: 43
- Munich malt: 39
- Malt juice: 34
- Wheat malt powder: 20
- Black malt: 15
- Light malt: 10
- Sorghum malt: 9
- Biscuit malt: 9
- Carahell malt: 7
- Special B malt: 7
- Caramunich malt: 7
Source: Mintel, 2024
Total item count: 25,384
Malt extract
Mintel indicated that there were 29,719 new food (27,617), drink (1,861), health (89), and petfood (152) products containing malt extract as an ingredient (including barley, oat, rice, wheat malt extract) launched globally across grocery retailer outlets (including new variety/range extension, packaging, formulation or relaunched) between the period of January 2019 and April 3, 2024. 99.8% of all these products contained barley malt extract as the added ingredient, followed by 151 products containing wheat malt extract (0.51%), 14 products with rice malt extract (0.047%) and 10 products with oat malt extract (0.034%). Leading markets launching the most products with malt extract were the UK (6.3%), Germany (6.1%), Brazil (5.3%), Japan (5.3%), USA (4.4%), France (4.1%), Australia (3.4%), Italy (3.3%), Indonesia (2.8%), and Spain (2.4%). Canada was the 14th largest market (2.0%), launching 586 products containing malt extract over this period.
New brands launched for the first time within the last six months that contain malt extract as an ingredient include Oishi Hexi Crisps (original flavour savoury crackers), OK Fingers (peanut flavour snack), and Golden Seed (best healthy bread with Royal Rye). New ingredients appearing within the last 12 months in these malt extract products included Agave fibre, Quillaja extract, Fir Tree Smoke, blue cheese powder, and Dextrose syrup. The fastest growing flavours in these products were custard/pastry cream/crème Anglaise (+500%), cheesecake (+400%), shortbread, ginger, lime (+300%), and passion fruit/Maracuja between Q2-2022 and
Q2-2024. Top growing claims were prebiotic (+200%), and growing claims by +100% include breath-freshening, diabetic, functional pet - immune system, functional pet - slimming between Q1-2023 and Q1-2024. Meanwhile during the same period, declining claims by −100% were functional pet - brain and nervous system/eyesight, portionability, anti-ageing, and male.
Wheat/rice malt germ extract and corn germ flour
Mintel indicated that there were 46 new food (5), drink (3), health (32), and petfood (6) products containing germ extract (wheat/rice) or corn germ flour as an ingredient that were launched globally across grocery retailer outlets (including new variety/range extension, packaging, formulation or relaunched) between the period of January 2019 and April 3, 2024. Amongst these few products (zero launched in 2024), 45.7% or 21 products contained rice germ extract as the added ingredient, followed by 17 products that contained wheat germ extract (37.0%), and 8 products that contained corn germ flour (17.4%). Leading markets launching the most products with germ extract or corn germ flour were the Japan (23.9%), South Korea (15.2%), Germany (13.0%), Taiwan/China (8.7%), France (6.5%), Italy (4.3%), Morocco (4.3%), Brazil (4.3%), Norway (2.2%), and the Netherlands (2.2%). Both Canada and the United States did not have any products within their grocery stores that contained germ extract or germ flour as an ingredient listed on any package labels - despite the US as reporting manufacturing one product in its USA facilities: "Twist'd Marrow with Real Bacon Dog Treats" made by the Nestlé Purina PetCare Company (brand: Purina Busy with Beggin') launched in the Mexico market as a new variety/range extension on August 2023.
These germ extract and germ flour products were found within the following main categories over the 5-year period: Healthcare at 32 products (69.6%), 6 petfood (13.0%), 3 nutritional drinks and other beverages (6.5%), 3 bakery (6.5%), one snacks category (2.2%), and one processed fish, meat and egg products (2.2%). Declining categories between Q2-2023 and Q4-2023, were the healthcare and pet food categories. Top companies that launched one product each during the same period, were Queisser Pharma, Marine Bioprocess, Salus Haus, Grupo Bongiovanni, Fragranze, and Nestlé. New brands launched for the first time within the last six months that contain germ extract and germ flour as an ingredient include Doppelherz Aktiv (mango-passion fruit flavour Collagen + Biotin + Ceramides drink ampoules) and Grupo Bongiovanni Nutribon Plus (seafood flavoured complete balanced food for adult cats). New ingredients appearing within the last 12 months in these products included chicken by-product meal, Selenium, Copper Gluconate, anti-fungal, mango juice concentrate, fish meal, and soybean meal. The fastest declining flavours of these products by −100% were unflavoured/plain, grape (Muscat), Lingonberry/cowberry/partridge berry, and Lychee/Litchi between Q2-2022 and Q2-2023.
| Product attributes | Yearly launch - item count | ||||||
|---|---|---|---|---|---|---|---|
| 2019 | 2020 | 2021 | 2022 | 2023 | 2024 | Total | |
| Yearly product launches | 5,203 | 4,988 | 4,749 | 4,641 | 4,292 | 890 | 24,763 |
| Top launch types | |||||||
| New variety/range extension | 1,710 | 1,634 | 1,559 | 1,654 | 1,564 | 316 | 8,437 |
| New packaging | 1,581 | 1,507 | 1,497 | 1,402 | 1,343 | 306 | 7,636 |
| New product | 1,596 | 1,503 | 1,390 | 1,317 | 1,122 | 213 | 7,141 |
| Relaunch | 287 | 315 | 282 | 245 | 256 | 46 | 1,431 |
| New formulation | 29 | 29 | 21 | 23 | 7 | 9 | 118 |
| Top sub-categories | |||||||
| Beer | 3,004 | 2,995 | 2,803 | 2,817 | 2,517 | 514 | 14,650 |
| Bread and bread products | 257 | 275 | 250 | 245 | 213 | 38 | 1,278 |
| Cold cereals | 300 | 258 | 262 | 217 | 187 | 45 | 1,269 |
| Sweet biscuits/cookies | 169 | 143 | 141 | 149 | 168 | 41 | 811 |
| Cakes, pastries and sweet goods | 78 | 106 | 92 | 104 | 101 | 24 | 505 |
| Top five companies / parent | |||||||
| Anheuser-Busch InBev | 268 | 241 | 211 | 206 | 172 | 41 | 1,139 |
| Heineken | 216 | 187 | 180 | 162 | 151 | 27 | 923 |
| Carlsberg | 141 | 136 | 106 | 134 | 132 | 30 | 679 |
| Kellogg | 95 | 87 | 120 | 113 | 74 | 16 | 505 |
| Nestlé | 62 | 83 | 74 | 59 | 68 | 14 | 360 |
| Top five brands | |||||||
| Heineken | 60 | 56 | 46 | 28 | 36 | 7 | 233 |
| BrewDog | 25 | 48 | 43 | 40 | 33 | 2 | 191 |
| Carlsberg | 27 | 31 | 30 | 22 | 22 | 9 | 141 |
| Suntory The Premium Malt's | 18 | 23 | 25 | 22 | 23 | 8 | 119 |
| Tsingtao | 18 | 16 | 25 | 19 | 25 | 5 | 108 |
| Import status (if reported) | |||||||
| Not imported | 1,391 | 1,274 | 1,340 | 1,356 | 1,275 | 277 | 6,913 |
| Imported | 900 | 833 | 764 | 700 | 648 | 140 | 3,985 |
| Location of manufacture | |||||||
| Brazil | 315 | 254 | 258 | 247 | 235 | 44 | 1,353 |
| China | 181 | 186 | 208 | 219 | 227 | 57 | 1,078 |
| United Kingdom | 183 | 196 | 157 | 118 | 116 | 23 | 793 |
| France | 164 | 118 | 125 | 166 | 118 | 38 | 729 |
| Germany | 181 | 177 | 134 | 91 | 107 | 32 | 722 |
| Canada (19th) | 37 | 12 | 24 | 40 | 41 | 7 | 161 |
| Market reported | |||||||
| France | 457 | 402 | 453 | 552 | 385 | 63 | 2,312 |
| Brazil | 356 | 312 | 319 | 299 | 274 | 57 | 1,617 |
| China | 241 | 225 | 229 | 273 | 291 | 68 | 1,327 |
| United Kingdom | 270 | 250 | 213 | 182 | 209 | 38 | 1,162 |
| United States | 224 | 174 | 216 | 167 | 207 | 44 | 1,032 |
| Canada (16th) | 128 | 99 | 88 | 66 | 84 | 19 | 484 |
| Top five flavours (including blend) | |||||||
| Unflavoured/plain | 3,011 | 2,978 | 2,795 | 2,709 | 2,442 | 512 | 14,447 |
| Chocolate | 103 | 80 | 114 | 86 | 92 | 15 | 490 |
| Malt/malted | 71 | 76 | 69 | 68 | 65 | 9 | 358 |
| Lemon | 52 | 42 | 42 | 45 | 56 | 4 | 241 |
| Fruit | 30 | 31 | 35 | 23 | 31 | 6 | 156 |
| Source: Mintel; Global New Product Database, 2024 | |||||||
| Product attributes | Yearly launch - item count | ||||||
|---|---|---|---|---|---|---|---|
| 2019 | 2020 | 2021 | 2022 | 2023 | 2024 | Total | |
| Yearly product launches | 6,144 | 5,782 | 5,438 | 5,538 | 5,495 | 1,322 | 29,719 |
| Top launch types | |||||||
| New variety/range extension | 2,185 | 1,999 | 1,858 | 1,905 | 1,872 | 472 | 10,291 |
| New packaging | 1,783 | 1,753 | 1,871 | 1,940 | 1,954 | 497 | 9,798 |
| New product | 1,550 | 1,446 | 1,210 | 1,109 | 1,077 | 231 | 6,623 |
| Relaunch | 532 | 504 | 454 | 534 | 537 | 105 | 2,666 |
| New formulation | 94 | 80 | 45 | 50 | 55 | 17 | 341 |
| Top sub-categories | |||||||
| Cold cereals | 1,048 | 1,030 | 891 | 938 | 803 | 176 | 4,886 |
| Sweet biscuits/cookies | 770 | 718 | 685 | 819 | 773 | 192 | 3,957 |
| Seasonal chocolate | 426 | 391 | 398 | 383 | 394 | 181 | 2,173 |
| Snack/cereal/energy bars | 473 | 375 | 332 | 299 | 271 | 53 | 1,803 |
| Savoury biscuits/crackers |
373 |
366 | 283 | 306 | 285 | 52 | 1,665 |
| Top five companies / parent | |||||||
| Lindt & Sprüngli | 418 | 416 | 420 | 368 | 413 | 142 | 2,177 |
| Nestlé | 372 | 371 | 416 | 372 | 353 | 74 | 1,958 |
| Kellogg | 335 | 269 | 216 | 206 | 200 | 39 | 1,265 |
| Mars | 183 | 159 | 137 | 132 | 153 | 36 | 800 |
| Lidl | 149 | 122 | 147 | 121 | 109 | 17 | 665 |
| Top five brands (n=50) | |||||||
| Lindt (Lindor, Creation) | 305 | 317 | 328 | 290 | 304 | 118 | 1,662 |
| Nestlé (Milo/Fitness/Smarties/Chocapic/Koko Krunch) | 138 | 136 | 173 | 176 | 169 | 34 | 826 |
| Kellogg's (Special K/Coco Pops/Extra/Corn Flakes/Frosties) | 145 | 109 | 105 | 101 | 88 | 20 | 568 |
| Loacker (Quadratini) | 81 | 41 | 67 | 127 | 84 | 20 | 420 |
| Maltesers | 60 | 54 | 57 | 47 | 65 | 10 | 293 |
| Import status (if reported) | |||||||
| Imported | 1,825 | 1,563 | 1,322 | 1,252 | 1,184 | 281 | 7,427 |
| Not imported | 1,463 | 1,178 | 1,129 | 1,155 | 1,153 | 281 | 6,359 |
| Location of manufacture | |||||||
| Brazil | 287 | 234 | 302 | 256 | 283 | 61 | 1,423 |
| Germany | 407 | 258 | 198 | 137 | 140 | 40 | 1,180 |
| Italy | 317 | 243 | 165 | 172 | 152 | 39 | 1,088 |
| France | 174 | 166 | 147 | 110 | 138 | 26 | 761 |
| Australia | 123 | 129 | 138 | 156 | 137 | 46 | 729 |
| Canada (18th) | 56 | 59 | 49 | 47 | 41 | 8 | 260 |
| Market reported from | |||||||
| United Kingdom | 379 | 336 | 326 | 349 | 385 | 101 | 1,876 |
| Germany | 398 | 384 | 329 | 307 | 313 | 73 | 1,804 |
| Brazil | 305 | 286 | 335 | 286 | 309 | 65 | 1,586 |
| Japan | 303 | 344 | 315 | 270 | 271 | 62 | 1,565 |
| United States | 275 | 257 | 252 | 221 | 244 | 51 | 1,300 |
| Canada (14th) | 134 | 155 | 81 | 94 | 103 | 19 | 586 |
| Top five flavours (including blend) | |||||||
| Unflavoured/plain | 1,460 | 1,510 | 1,310 | 1,245 | 1,249 | 347 | 7,121 |
| Chocolate | 538 | 433 | 453 | 464 | 468 | 129 | 2,485 |
| Hazelnut | 137 | 148 | 166 | 166 | 171 | 44 | 832 |
| Caramel/caramelised | 87 | 99 | 99 | 111 | 114 | 28 | 538 |
| Salt/salted | 86 | 102 | 81 | 96 | 97 | 18 | 480 |
|
Source: Mintel; Global New Product Database, 2024 1: Includes barley, oat, rice, wheat malt extract |
|||||||
| Product attributes | Yearly launch - item count | |||||
|---|---|---|---|---|---|---|
| 2019 | 2020 | 2021 | 2022 | 2023 | Total | |
| Yearly product launches | 14 | 4 | 8 | 9 | 11 | 46 |
| Top launch types | ||||||
| New product | 6 | 2 | 2 | 6 | 6 | 22 |
| New variety/range extension | 2 | 2 | 3 | 0 | 2 | 9 |
| New packaging | 3 | 0 | 0 | 3 | 1 | 7 |
| Relaunch | 1 | 0 | 3 | 0 | 2 | 6 |
| New formulation | 2 | 0 | 0 | 0 | 0 | 2 |
| Top sub-categories | ||||||
| Vitamins and dietary supplements | 9 | 3 | 4 | 5 | 7 | 28 |
| Dog food - dry | 2 | 0 | 1 | 1 | 0 | 4 |
| Digestive and detoxifying treatments | 2 | 0 | 0 | 0 | 0 | 2 |
| Sweet biscuits/cookies | 0 | 1 | 1 | 0 | 0 | 2 |
| Stimulants | 0 | 0 | 1 | 0 | 0 | 1 |
| Top five companies / parent | ||||||
| Salus Haus | 1 | 0 | 0 | 2 | 1 | 4 |
| Wellfine | 0 | 0 | 1 | 0 | 2 | 3 |
| Orbis | 1 | 0 | 2 | 0 | 0 | 3 |
| Pola | 1 | 0 | 2 | 0 | 0 | 3 |
| DHC | 1 | 0 | 1 | 0 | 0 | 2 |
| Top five brands | ||||||
| Salus Floradix | 1 | 0 | 0 | 1 | 1 | 3 |
| Orbis Defencera | 1 | 0 | 2 | 0 | 0 | 3 |
| Alfe | 0 | 0 | 1 | 0 | 1 | 2 |
| Defu | 0 | 0 | 1 | 1 | 0 | 2 |
| Affinity Faro | 2 | 0 | 0 | 0 | 0 | 2 |
| Import status (if reported) | ||||||
| Not imported | 3 | 1 | 2 | 2 | 2 | 10 |
| Imported | 6 | 0 | 1 | 1 | 1 | 9 |
| Location of manufacture (n=19 reporting countries) | ||||||
| Germany | 4 | 0 | 1 | 2 | 0 | 7 |
| Japan | 0 | 1 | 1 | 1 | 0 | 3 |
| Brazil | 2 | 0 | 0 | 0 | 0 | 2 |
| Argentina | 0 | 0 | 0 | 0 | 1 | 1 |
| Georgia | 1 | 0 | 0 | 0 | 0 | 1 |
| Market reported within | ||||||
| Japan | 3 | 2 | 4 | 1 | 1 | 11 |
| South Korea | 2 | 0 | 1 | 1 | 3 | 7 |
| Germany | 1 | 1 | 1 | 2 | 1 | 6 |
| Taiwan, China | 1 | 1 | 0 | 0 | 2 | 4 |
| France | 1 | 0 | 1 | 0 | 1 | 3 |
| Top five flavours (including blend) | ||||||
| Unflavoured/plain | 7 | 3 | 4 | 6 | 4 | 24 |
| Poultry | 0 | 0 | 1 | 1 | 0 | 2 |
| Chicken and meat and liver | 1 | 0 | 0 | 0 | 0 |
1 |
| Hazelnut | 0 | 1 | 0 | 0 | 0 | 1 |
| Mango and passion fruit/Maracuja | 0 | 0 | 0 | 0 | 1 | 1 |
| Source: Mintel; Global New Product Database, 2024 | ||||||
Examples of new products
Assorted Granola Bars
Source: Mintel, 2024
| Company / manufacturer | PepsiCo |
|---|---|
| Brand | Quaker Chewy Fruity Fun |
| Sub-category | Snacks, snack / cereal / energy bars |
| Market | Manufactured in Canada, not imported |
| Related ingredients | Barley malt |
| Store name / location | Save-On-Foods, Edmonton T6X 0P2 |
| Store type | Supermarket |
| Date published | January 2024 |
| Launch type | New product |
| Price in US dollars | 15.49 |
Retails in a 960 gram value pack containing 20 (24 gram units) of Apple Fruit Crumble Granola Bar, 10 Strawberry Fruit Crumble Granola Bar, and of Peach Fruit Crumble Granola Bar. Made with 100% Canadian oats. Made in a peanut-free facility. Made with wholegrain oats and other grains. Made in Canada from domestic and imported ingredients. This carton is made from 100% recycled materials. Logos and certifications: Whole Grain Stamp
Blueberry Milk Stout Beer
Source: Mintel, 2024
| Company / manufacturer | Browar Sady |
|---|---|
| Brand | Browar Moczybroda |
| Category | Alcoholic beverage, beer |
| Market | Manufactured in Poland, not imported |
| Ingredients | Barley malt (pale ale, Munich malt, chocolate malt), wheat malt, oats, roasted barley, hops (fuggles, Marynka), S-04 yeast, lactose, blueberry juice |
| Store name | Delio |
| Store type | Internet / mail order |
| Date published | December 2023 |
| Launch type | New product |
| Price in US dollars | 2.18 |
This product retails in a 500 millilitre pack. With blueberries - 15% extract. Top-fermented, unfiltered, pasteurised beer. No cows were harmed in the production of this beer. Bitterness: two out of five; Strength: four out of five. Brewed with joy in Poland. Logos and certifications: Facebook, Instagram
#Year of the Lager
Source: Mintel, 2024
| Company / manufacturer | De Proef Brouwerij |
|---|---|
| Brand | Mikkeller Budvar |
| Category | Alcoholic beverages, beer |
| Market | Denmark |
| Ingredients | Waters, Pilsner malt, Saaz Hops, yeast |
| Store name / location | Mikkeller & Friends Bottle Shop, Copenhagen 1360 |
| Store type | Specialist retailer |
| Date published | October 2023 |
| Launch type | New product |
| Price in US dollars | 5.63 |
This product retails in a 440 millilitre pack. Brewed in partnership with the national brewery of Czech republic - Mikkeller and Budvar have joined forces to create a unique Czech style lager by blending Budvar's rich brewing expertise with Mikkeller's innovative approach. This golden beer pays homage to the proud Czech brewing heritage while adding an exciting twist. Logos and certifications: Partnership Brewing
Four Grain Stout
Source: Mintel, 2024
| Company / manufacturer | Microbrasserie Horla |
|---|---|
| Brand | Horla Microbrasserie |
| Category | Alcoholic beverages, beer |
| Market | France |
| Related ingredients | Water, organic barley and wheat malt, malted rye, rolled oats (flakes), white sugar, hops, yeast |
| Store name / location | Alre Bio, Auray 56000 |
| Store type | Natural / health food store |
| Date published | January 2024 |
| Launch type | New product |
| Price in US dollars | 3.86 |
This product retails in a 33 centilitre bottle. Contains the following cereals: Malts Pale, Munich Dark, Cara Gold, Special B, Back, wheat and rye malts, oat flakes. Hop: Cascade- yeast: Lallemand BRY-97- Dark, round and generous beer. Complex malted base. Roasted chocolate-coffee notes and a length which ends with delicate hopping. Lively, unfiltered beer, non-pasteurised. Logos and certifications: AB - Agriculture Biologique (Organic Agriculture) label, EU Organic.
Classic Croissants
Source: Mintel, 2024
| Company / manufacturer | Golosi di Salute |
|---|---|
| Brand | Golosi di Salute |
| Category | Bakery, bread and bread products |
| Market | Italy |
| Related ingredients | Wheat flour, brewer's yeast, barley malt, corn malt |
| Claims | Low / no / reduced transfat, no added sugar, palm oil free |
| Store name / location | Eataly.net |
| Store type | Internet / mail order |
| Date published | January 2024 |
| Launch type | New product |
| Price in US dollars | 6.46 |
This product retails in a 240 gram pack, containing six units. Free from palm oil, hydrogenated fats, added sugars. With sweeteners, naturally contains sugars. Naturally leavened.
Original Flavour Savoury Crackers

Source: Mintel, 2024
| Company / manufacturer | Liwayway Marketing Corporation |
|---|---|
| Brand | Oishi Hexi Crisps |
| Category | Snacks, wheat and other grain-based |
| Market | Philippines |
| Related ingredients | Wheat, whey powder, barley malt extract |
| Claims | No additives / preservatives, vitamin / mineral fortified |
| Store name / location | Puregold, Antipolo City 1870 |
| Store type | Mass merchandise / hypermarket |
| Date published | April 2024 |
| Launch type | New product |
| Price in US dollars | 0.24 |
This product retails in a 28 gram pack. No added MSG, vitamin A fortified. Logos and certifications: QR code, Vitamin A Fortified Accepted by Department of Health, Facebook URL. Also available in cheese flavour.
Twist'd Marrow with Real Bacon Dog Treats

Source: Mintel, 2024
| Company / manufacturer | Nestlé Purina PetCare |
|---|---|
| Importer | Nestlé |
| Brand | Purina Busy with Beggin’ |
| Category | Pet food, dog snacks & treats |
| Market | Mexico, manufactured in the United States |
| Related ingredients | Rice, wheat flour, brewer yeast, wheat gluten, corn germ flour |
| Claims | No additives / preservatives, economy, pet – adult, free from added / artificial colourings |
| Store name / location | Mexico City 14330 |
| Store type | Specialist retailer |
| Date published | August 2023 |
| Launch type | New variety / range extension |
| Price in US dollars | 16.90 |
This product retails in a 1.02 kilogram pack containing 10 units. Great value. For adult dogs, small and medium size. Produced in United States facilities. Easily digestible. Long-lasting chew. No rawhide or artificial FD&C colors.
For more information
The Canadian Trade Commissioner Service:
International Trade Commissioners can provide Canadian industry with on-the-ground expertise regarding market potential, current conditions and local business contacts, and are an excellent point of contact for export advice.
More agri-food market intelligence:
International agri-food market intelligence
Discover global agriculture and food opportunities, the complete library of Global Analysis reports, market trends and forecasts, and information on Canada's free trade agreements.
Agri-food market intelligence service
Canadian agri-food and seafood businesses can take advantage of a customized service of reports and analysis, and join our email subscription service to have the latest reports delivered directly to their inbox.
More on Canada's agriculture and agri-food sectors:
Canada's agriculture sectors
Information on the agriculture industry by sector. Data on international markets. Initiatives to support awareness of the industry in Canada. How the department engages with the industry.
Resources
- Euromonitor International, 2024
- Euromonitor International | July 2023. Country report: Beer in China
- Euromonitor International | June 2023. Country report: Beer in Brazil
- Euromonitor International | June 2023. Country report: Beer in Canada
- Euromonitor International | June 2023. Country report: Beer in the US
- Global Trade Tracker (GTT), 2024
- Kaczorowski, Mikolaj. Mintel | February 16, 2024. A year of innovation in beer and cider, 2024
- Mintel Global New Products Database, 2024
Customized Report Service – Global food and drink product trends containing malt-based and germ of cereal ingredients
Global Analysis Report
Prepared by: Erin-Ann Chauvin, Senior Market Analyst
© His Majesty the King in Right of Canada, represented by the Minister of Agriculture and Agri-Food (2024).
Photo credits
All photographs reproduced in this publication are used by permission of the rights holders.
All images, unless otherwise noted, are copyright His Majesty the King in Right of Canada.
To join our distribution list or to suggest additional report topics or markets, please contact:
Agriculture and Agri-Food Canada, Global Analysis1341 Baseline Rd, Tower 5, 3rd floor
Ottawa ON K1A 0C5
Canada
Email: aafc.mas-sam.aac@agr.gc.ca
The Government of Canada has prepared this report based on primary and secondary sources of information. Although every effort has been made to ensure that the information is accurate, Agriculture and Agri-Food Canada (AAFC) assumes no liability for any actions taken based on the information contained herein.
Reproduction or redistribution of this document, in whole or in part, must include acknowledgement of agriculture and agri-food Canada as the owner of the copyright in the document, through a reference citing AAFC, the title of the document and the year. Where the reproduction or redistribution includes data from this document, it must also include an acknowledgement of the specific data source(s), as noted in this document.
Agriculture and Agri-Food Canada provides this document and other report services to agriculture and food industry clients free of charge.