

Note: This report includes forecasting data that is based on baseline historical data.
Pea protein isolate ingredient market snapshot
According to Mintel's Global New Products Database (GNPD), there were 348 new launches of products containing pea protein isolates, in the North American market (Canada and the United States), between January 2019 to December 2023 (31 new products launched year-to-date, January-June 2024).
Of the 348 new pea protein isolate products released, 295 of the products (84.8% market share) were categorized as food products versus 53 new products (15.2% market share) in the drink category. In terms of new product category launches per market, the United States released 181 food and 20 drink products, while Canada released 114 food and 33 drink products.
The predominant categories of new pea protein isolate food products released in the Canadian market were snacks (49 products), followed by processed fish, meat & egg products (40 products), meals & meal centers (10 products), dairy (9 products) and sauces and seasonings (3 products), representing a combined market share of 97.4% during the 2019 to 2023 period.
In the Canadian retail and e-commerce packaged food and drink market, new launched products containing pea protein isolate were distributed primarily through natural/health food stores with (54 products), followed by supermarkets (52 products) and internet/mail order (11 products), representing a combined market share of 79.6% during the 2019 to 2023 period.
Volume sales of pea protein ingredients in the Canadian packaged food market were valued at 2,442.9 tonnes in 2023, increasing 7.7% annually from 1,817.3 tonnes in 2019, and are expected to remain positive in the forecast period, increasing 2.7% annually to reach volume sales of 2,714.0 tonnes by 2027.
The predominant categories of new pea protein isolate food products released in the U.S market were snacks (63 products), followed by processed fish, meat & egg products (30 products), meals & meal centers (27 products), bakery (14 products) and dairy (12 products), representing a combined market share of 80.7% during the 2019 to 2023 period.
In the United States retail and e-commerce packaged food and drink market, new launched products containing pea protein isolate were distributed primarily through supermarkets (78 products), followed by mass merchandise/hypermarkets with (41 products) and natural/health food stores with (30 products), representing a combined market share of 74.1% during the 2019 to 2023 period.
Volume sales of pea protein ingredients in the United States packaged food market were valued at 25,171.1 tonnes in 2023, increasing 6.2% in compound annual growth rate (CAGR) from 19,808.6 tonnes in 2019, and are expected to remain positive in the forecast period, increasing 3.3% in CAGR to reach volume sales of 28,651.5 tonnes by 2027.
New products containing pea protein isolate in Canada and the United States
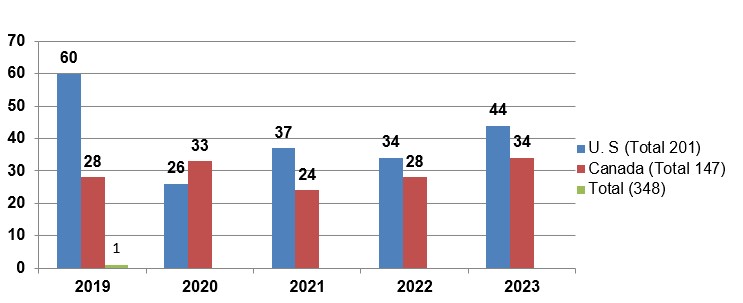
According to Mintel's Global New Products Database (GNPD), there were 348 new launches of products containing pea protein isolates, in the North American market (Canada and the United States (U.S)), between January 2019 to December 2023 (31 new products launched year-to-date, January-June 2024).
The United States launched the majority of the new products (201) representing a 57.8% market share, while Canada in comparison, launched a total of 147 products (42.2% market share) between 2019 to 2023.
Description of above image
| Market | 2019 | 2020 | 2021 | 2022 | 2023 | Total |
|---|---|---|---|---|---|---|
| United States | 60 | 26 | 37 | 34 | 44 | 201 |
| Canada | 28 | 33 | 24 | 28 | 34 | 147 |
Total: 348
Source: Mintel Global New Product Database (GNPD), 2024
Of the 348 new pea protein isolate products released between January 2019 and December 2023, 295 of the products (84.8% market share) were categorized as food products versus 53 new products (15.2% market share) in the drink category.
In terms of new product category launches per market, the United States released 181 food and 20 drink products, while Canada released 114 food and 33 drink products.
| Market | Product category | Number of products |
|---|---|---|
| Total | 348 | |
| United States | Food | 181 |
| Drink | 20 | |
| Canada | Food | 114 |
| Drink | 33 | |
| Source: Mintel Global New Product Database (GNPD), 2024 | ||
The pea protein isolate market in Canada
According to Mintel's Global New Products Database (GNPD), there were a total of 147 new food and drink products containing pea protein isolate (as an ingredient-and all children) launched in Canada between January 2019 to December 2023. The number of new food and beverage product launches has increased 5.0% in compound annual growth rate (CAGR) from 28 products released in 2019 to 34 products released in 2023. There have been 20 new pea protein isolate containing food and drink products launched year-to-date, January-June 2024. Of the 147 new food and drink products released between 2019 to 2023, 114 products (77.6% market share) were food products, while 33 products (22.4% market share) were drink products.
New food products (containing pea protein isolates) launched has decreased slightly in CAGR by 2.2% from 23 products released in 2019 to 21 products released in 2023. In contrast, new drink products launched has increased in CAGR by 27.0% from 5 to 13 products released during the same period.
The predominant categories of new pea protein isolate food products released in the Canadian market were snacks (49 products), followed by processed fish, meat and egg products (40 products), meals and meal centers (10 products), dairy (9 products) and sauces and seasonings (3 products), representing a combined market share of 97.4% during the 2019 to 2023 period. Of interest, the processed fish, meat and egg products category experienced the greatest increase in CAGR (38.4%) from 3 products in 2019 to 11 products in 2023. In the drink category, nutritional drinks and other beverages released a total of 33 products during the review period.
| Product category | Yearly launch counts | Total | ||||
|---|---|---|---|---|---|---|
| 2019 | 2020 | 2021 | 2022 | 2023 | ||
| Total food and beverage | 28 | 33 | 24 | 28 | 34 | 147 |
| Food category | 23 | 24 | 21 | 25 | 21 | 114 |
| Snacks | 11 | 11 | 8 | 10 | 9 | 49 |
| Processed fish, meat and egg products | 3 | 10 | 9 | 7 | 11 | 40 |
| Meals and meal centers | 3 | 2 | 2 | 3 | 0 | 10 |
| Dairy | 5 | 0 | 2 | 2 | 0 | 9 |
| Sauces and seasonings | 0 | 1 | 0 | 2 | 0 | 3 |
| Drink category | 5 | 9 | 3 | 3 | 13 | 33 |
| Nutritional drinks and other beverages | 5 | 9 | 3 | 3 | 13 | 33 |
| Source: Mintel Global New Product Database (GNPD), 2024 | ||||||
Top flavours of pea protein isolate-containing food products noted were unflavoured/plain (23 products), chocolate (6 products), and cocoa/cocoa & coconut (3 products), representing a combined market share of 28.1% between January 2019 to December 2023. In 2023, top flavours were unflavoured/plain (3 products), chicken (2 products), chocolate & peanut butter, banana & chocolate and chocolate & confetti with (1 product), respectively.
Of the drink category product releases, chocolate (11 products), vanilla/vanilla bourbon/vanilla (Madagascar) (8 products) and syrup (maple) with (2 products) were identified as main flavours, representing a combined market share of 63.6% during the same period. In 2023, top drink flavours were vanilla/vanilla bourbon/vanilla (Madagascar) (5 products), chocolate (4 products) and berry, coffee & wafer and cookies & cream (1 product) respectively. Of interest, chocolate as a top flavour in the drink category, experienced the largest increase in CAGR (41.4%) as new products launched increased from 1 product in 2019 to 4 products in 2023.
| Flavours | Yearly launch counts | Total | ||||
|---|---|---|---|---|---|---|
| 2019 | 2020 | 2021 | 2022 | 2023 | ||
| Total food and beverage | 28 | 33 | 24 | 28 | 34 | 147 |
| Food category | 23 | 24 | 21 | 25 | 21 | 114 |
| Unflavoured/plain | 6 | 4 | 4 | 6 | 3 | 23 |
| Chocolate | 1 | 1 | 2 | 2 | 0 | 6 |
| Cocoa / cocoa and coconut | 0 | 0 | 2 | 1 | 0 | 3 |
| Chocolate and peanut butter | 1 | 0 | 1 | 0 | 1 | 3 |
| Barbeque / BBQ / Barbacoa | 0 | 0 | 1 | 1 | 1 | 3 |
| Drink category | 5 | 9 | 3 | 3 | 13 | 33 |
| Chocolate | 1 | 3 | 1 | 2 | 4 | 11 |
| Vanilla / vanilla bourbon / vanilla Madagascar | 0 | 2 | 0 | 1 | 5 | 8 |
| Syrup (maple) and vanilla / vanilla bourbon / vanilla (Madagascar) | 1 | 1 | 0 | 0 | 0 | 2 |
| Coffee and wafer | 1 | 0 | 0 | 0 | 1 | 2 |
| Butterscotch | 1 | 0 | 0 | 0 | 1 | 2 |
| Source: Mintel Global New Product Database (GNPD), 2024 | ||||||
During the review period, the most popular food product claims in recent pea protein isolate containing launches were low / no / reduced allergen (78 products), followed by gluten free with (72 products) and vegan/no animal ingredients with (61 products). In 2023, top food claims were plant based (14 products), vegan/no animal ingredients (12 products), social media (10 products), high/added protein and gmo free (9 products), respectively. All top food claims reported in recent new launches have declined during the review period with the exception of plant based, which has increased 20.4% in CAGR from 5 products released with this claim in 2019 to 14 products in 2023. Top drink claims reported during the review period were also low / no / reduced allergen with (30 products) and vegan/no animal ingredients and gluten free with (29 products) respectively.
Low / no / reduced allergen food claims included products within the following categories: snacks (37 products), processed fish, meat and egg products (24 products), meal and meal centers (6 products), dairy (7 products), sauces and seasonings (3 products), and savoury spreads (1 product). Gluten free claims were identified in the snacks (36 products), processed fish, meat and egg products (19 products), meal and meal centers (6 products), dairy (7 products), sauces and seasonings (3 products), and savoury spreads (1 product). Vegan / no animal ingredients contained products in the snacks (24 products), processed fish, meat and egg products (20 products), meal and meal centers (7 products), dairy (7 products), and sauces and seasonings (3 products).
In the drink (nutritional drink and other beverages) category, low / no / reduced allergenwas an identified claim in 30 products, while gluten free and vegan / no animal ingredients were identified claims in 29 products, respectively. In contrast to the food category, drink claims reported in recent launches have increased during the review period with high/added protein experiencing the greatest performance, increasing 68.2% from 1 to 8 reported products with this claim between 2019 to 2023. Dairy free drink claims increased from 1 to 10 claims between 2022 to 2023.
| Claims | Yearly launch counts | Total | ||||
|---|---|---|---|---|---|---|
| 2019 | 2020 | 2021 | 2022 | 2023 | ||
| Total food and beverage | 28 | 33 | 24 | 28 | 34 | 147 |
| Food category | 23 | 24 | 21 | 25 | 21 | 114 |
| Low / no / reduced allergen | 20 | 21 | 13 | 17 | 7 | 78 |
| Gluten free | 20 | 20 | 13 | 14 | 5 | 72 |
| Vegan/no animal ingredients | 15 | 12 | 7 | 15 | 12 | 61 |
| GMO free | 10 | 16 | 6 | 15 | 9 | 56 |
| Plant based | 5 | 11 | 9 | 11 | 14 | 50 |
| Drink category | 5 | 9 | 3 | 3 | 13 | 33 |
| Low / no / reduced allergen | 5 | 7 | 3 | 3 | 12 | 30 |
| Vegan / no animal ingredients | 5 | 9 | 1 | 3 | 11 | 29 |
| Gluten free | 5 | 7 | 3 | 2 | 12 | 29 |
| Dairy free | 5 | 4 | 0 | 1 | 10 | 20 |
| High / added protein | 1 | 6 | 1 | 2 | 8 | 18 |
|
Source: Mintel Global New Product Database (GNPD), 2024 1: products may report more than one claim |
||||||
The companies with the highest number of new pea protein isolate-containing (food) product launches in the review period were Genuine Health (Top Brands; Genuine Heath and Genuine Heath Clean Collagen) with 13 products, followed by Loblaws (Top Brand; PC President's Choice) with 9 products, and Daiya Foods (Top Brand; Daiya) with 9 products, representing a combined market share of 27.2% during the review period.
During the review period, Genuine Health released 13 new pea protein isolate products within the snacks category, while Loblaws released (2 products) in the snacks category and (7 products) in the processed fish, meat and egg product category. Daiya Foods in comparison, released (3 products) in the meal and meal centers category, (5 products) in the dairy category, and (1 product) in the sauces and seasonings category. Of note, the top three food companies experienced declines in product launch growth between 2019 to 2023. In 2023, top companies releasing new pea protein isolate-containing (food) products were Naak (6 products), TMRW Foods, Sol Cuisine and Conagra Brands with (2 products), respectively and Bob's Red Mill Natural Foods with (1 product). Of interest, Genuine Health and Daiya Foods last released new products in 2019 and 2020, respectively.
Top drink companies launching pea protein isolate-containing products during the review period were Raw Nutritional (Top Brand; Raw Nutritional Vegan Pro) with 11 products, Body Plus (Top Brands; Iron Vegan Athlete's Blend and Iron Vegan Athlete's Gainer) with 5 products and Magnum Nutraceuticals (Top Brand; Magnum Nutraceuticals Quattro Vegan) with 2 product launches, representing a combined market share of 54.5% during the review period. All top drink companies released new products containing pea protein isolate within the nutritional drinks and other beverages category during the review period. Of note, Magnum Nutraceuticals released 2 new pea protein isolate drink products during the review period (in 2023) only, while Naturiste and Nestlé released 2 new products in 2020 and 2021, respectively.
In 2023, top drink companies launching pea protein isolate-containing products were Raw Nutritional (5 products), Magnum Nutraceuticals, Wellness Natural and Body Plus with (2 products) respectively, and Cira with (1 product).
| Companies | Yearly launch counts | Total | ||||
|---|---|---|---|---|---|---|
| 2019 | 2020 | 2021 | 2022 | 2023 | ||
| Total food and beverage | 28 | 33 | 24 | 28 | 34 | 147 |
| Food category | 23 | 24 | 21 | 25 | 21 | 114 |
| Genuine Health | 8 | 5 | 0 | 0 | 0 | 13 |
| Loblaws | 2 | 1 | 3 | 2 | 1 | 9 |
| Daiya Foods | 8 | 1 | 0 | 0 | 0 | 9 |
| Temple Lifestyle | 0 | 1 | 3 | 4 | 0 | 8 |
| Vegeat Foods | 0 | 4 | 2 | 1 | 0 | 7 |
| Drink category | 5 | 9 | 3 | 3 | 13 | 33 |
| Raw Nutritional | 4 | 2 | 0 | 0 | 5 | 11 |
| Body Plus | 0 | 1 | 0 | 2 | 2 | 5 |
| Magnum Nutraceuticals | 0 | 0 | 0 | 0 | 2 | 2 |
| Naturiste | 0 | 2 | 0 | 0 | 0 | 2 |
| Nestlé | 0 | 0 | 2 | 0 | 0 | 2 |
| Source: Mintel Global New Product Database (GNPD), 2024 | ||||||
In recent food launches, 38 products (33.3% market share) were launched as new variety/range extensions, followed by 32 which were released as new products (28.1% market share), and 29 products were released as new packaging (25.4% market share) between January 2019 to December 2023. Of note, new product launch types experienced the greatest increase in CAGR (77.8%) from 1 product in 2019 to 10 products in 2023. In the drink category, 15 products released (45.5% market share) were categorized as new products and the remaining launches were new packaging and new variety/range extension (11 and 7 products respectively) during the prescribed period.
Relatedly, top food packaging types launched during the review period were flexible (71 products), tray (12 products), flexible stand-up pouches (12 products), skinpacks (7 products) and cartons (5 products), while main drink package types launched were flexible stand-up pouch (19 products) and jars (9 products), representing a combined market share of 84.8% of packaged product types released during the same period.
| Launch type | Yearly launch counts | Total | ||||
|---|---|---|---|---|---|---|
| 2019 | 2020 | 2021 | 2022 | 2023 | ||
| Total food and beverage | 28 | 33 | 24 | 28 | 34 | 147 |
| Food category | 23 | 24 | 21 | 25 | 21 | 114 |
| New variety / range extension | 5 | 7 | 9 | 12 | 5 | 38 |
| New product | 1 | 8 | 7 | 6 | 10 | 32 |
| New packaging | 11 | 8 | 1 | 3 | 6 | 29 |
| Relaunch | 5 | 1 | 3 | 4 | 0 | 13 |
| New formulation | 1 | 0 | 1 | 0 | 0 | 2 |
| Drink category | 5 | 9 | 3 | 3 | 13 | 33 |
| New product | 5 | 2 | 3 | 1 | 4 | 15 |
| New packaging | 0 | 4 | 0 | 2 | 5 | 11 |
| New variety / range extension | 0 | 3 | 0 | 0 | 4 | 7 |
| Source: Mintel Global New Product Database (GNPD), 2024 | ||||||
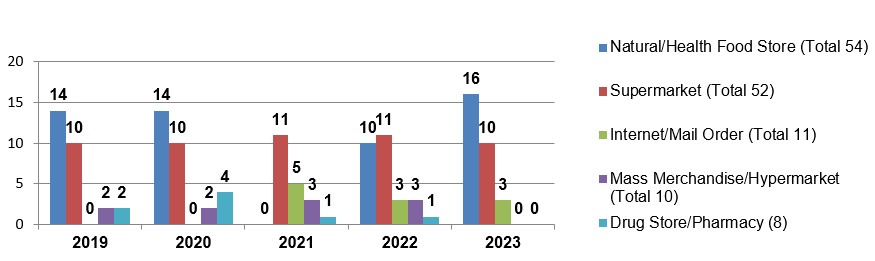
In the Canadian retail and e-commerce packaged food and drink market, new launched products containing pea protein isolate were distributed primarily through natural/health food stores with (54 products), followed by supermarkets (52 products) and internet/mail order (11 products), representing a combined market share of 79.6% during the 2019 to 2023 period.
Of the top distribution channels, products distributed through natural/health food stores increased in CAGR by 3.4% from 14 products in 2019 to 16 products in 2023. Mass merchandise/hypermarkets and drug store/pharmacy channels in contrast, declined 100.0% respectively, as each of the channel's product distribution declined from 2 to zero products, during the same period.
Description of above image
| Distribution channel | 2019 | 2020 | 2021 | 2022 | 2023 | Total |
|---|---|---|---|---|---|---|
| Natural / health food store | 14 | 14 | 0 | 10 | 16 | 54 |
| Supermarket | 10 | 10 | 11 | 11 | 10 | 52 |
| Internet / mail order | 0 | 0 | 5 | 3 | 3 | 11 |
| Mass merchandise / hypermarket | 2 | 2 | 3 | 3 | 0 | 10 |
| Drug store / pharmacy | 2 | 4 | 1 | 1 | 0 | 8 |
Source: Mintel Global New Product Database (GNPD), 2024
Ingredient volume sales
Volume sales of pea protein ingredients in the Canadian packaged food market were valued at 2,442.9 tonnes in 2023, increasing 7.7% annually from 1,817.3 tonnes in 2019. Pea protein ingredient volume sales in packaged food is expected to remain positive in the forecast period, increasing 2.7% annually to reach volume sales of 2,714.0 tonnes by 2027.
Of the volume sales of pea protein ingredients in the packaged food market in Canada, the dairy products and alternatives category yielded the largest volume sales with 1,278.3 tonnes (52.3% market share), followed by the staple foods category, with volume sales of 755.4 tonnes (30.9% market share), and the snacks category, with volume sales of 403.0 tonnes (16.5% market share) in 2023.
In the dairy products and alternatives category, the other plant-based milk segment represented the largest volume sales of pea protein ingredients with 939.7 tonnes (38.5% market share) in 2023, and experienced the greatest performance, increasing 10.3% in CAGR from volume sales of 634.4 tonnes in 2019. In the staple foods category, the meat and seafood substitutes segment experienced the largest increase in CAGR (28.6%), as volume sales grew from 78.4 tonnes in 2019 to 214.3 tonnes in 2023.
In the forecast period, the majority of categories and segments of packaged food ingredient volumes are expected to increase in growth, albeit at lower rates, with the exception of packaged leavened bread, which is anticipated to decrease 1.4% in CAGR in pea protein volume sales, from 478.8 tonnes in 2023 to 452.4 tonnes by 2027.
| Category | 2019 | 2023 | CAGR* % 2019-2023 | 2024 | 2027 | CAGR* % 2023-2027 |
|---|---|---|---|---|---|---|
| Packaged Food | 1,817.3 | 2,442.9 | 7.7 | 2,515.5 | 2,714.0 | 2.7 |
| Snacks | 391.3 | 403.0 | 0.7 | 415.1 | 445.5 | 2.5 |
| Ice Cream | 93.4 | 111.4 | 4.5 | 117.2 | 132.8 | 4.5 |
| Snack Bars | 297.9 | 291.6 | −0.5 | 297.9 | 312.7 | 1.8 |
| Dairy Products and Alternatives | 918.7 | 1,278.3 | 8.6 | 1,322.6 | 1,446.7 | 3.1 |
| Cheese | 153.4 | 168.5 | 2.4 | 172.3 | 182.2 | 2.0 |
| Yoghurt | 129.8 | 168.2 | 6.7 | 171.2 | 178.8 | 1.5 |
| Other Plant-based Milk | 634.4 | 939.7 | 10.3 | 976.9 | 1,083.2 | 3.6 |
| Staple Foods | 501.1 | 755.4 | 10.8 | 771.6 | 815.3 | 1.9 |
| Packaged Leavened Bread | 370.9 | 478.8 | 6.6 | 470.3 | 452.4 | −1.4 |
| Meat and Seafood Substitutes | 78.4 | 214.3 | 28.6 | 236.8 | 292.6 | 8.1 |
|
Source: Euromonitor International, 2024 *CAGR: Compound Annual Growth Rate 1: protein derived from pea sources, including but not limited to isolates and concentrates. 2: Ingredient volume sales represents end-product sales through retail and foodservice channels to consumers and is the total aggregation of all the individual ingredients used in the manufacture of products that are tracked in Packaged Food. Ingredient data as of July 2023 |
||||||
Examples of new products
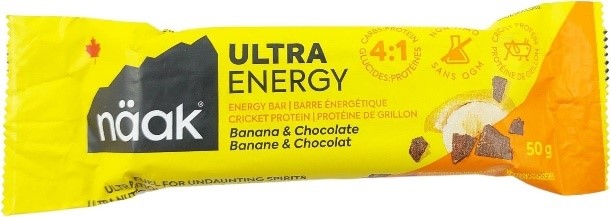
Banana & Chocolate Cricket Protein Energy Bar
Source: Mintel Global New Product Database (GNPD), 2024
| Company | Naak |
|---|---|
| Brand | Näak Ultra Energy |
| Category | Snacks |
| Sub-category | Snack / Cereal / Energy Bars |
| Market | Canada |
| Location of manufacture | Canada |
| Import status | Not imported |
| Store type | Natural / health food store |
| Date published | March 2023 |
| Launch type | New product |
| Price in local currency | Can$2.99 |
Ingredients (on pack): sugars (dates, brown rice syrup), sunflower seed butter (sunflower seeds, sunflower seed oil), protein blend (pea protein isolate, cricket protein, soy protein isolate, brown rice protein concentrate), chicory root fibre, chocolate chips (organic cane sugar, unsweetened chocolate, cocoa butter), unsweetened chocolate, organic crisp rice (organic rice flour, organic evaporated cane juice, salt, calcium carbonate), banana flakes, cocoa powder, gum acacia, cocoa butter, natural flavours, rolled oats, organic chia seeds, sea salt, mixed tocopherols
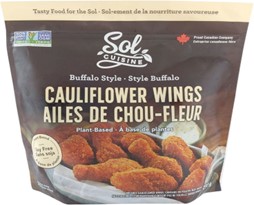
Plant-Based Buffalo Style Cauliflower Wings
Source: Mintel Global New Product Database (GNPD), 2024
| Company | Sol Cuisine |
|---|---|
| Brand | Sol Cuisine |
| Category | Processed fish, meat and egg products |
| Sub-category | Meat substitutes |
| Market | Canada |
| Store type | Natural / health food store |
| Date published | October 2022 |
| Launch type | New variety / range extension |
| Price in local currency | Can$6.79 |
Ingredients (on pack): cauliflower, filtered water, cooked brown rice (water, long grain brown rice), pea protein isolate, corn starch, modified cellulose, yeast extract, onion powder, sea salt, organic cane sugar, garlic powder, salt, citric acid, breading (enriched wheat flour, expeller pressed sunflower oil and/or canola oil, filtered water, tapioca starch, cane sugar, salt, spices, rice flour, extractives of paprika, yeast extract, citric acid, natural flavour, yeast, sea salt, sodium bicarbonate, xanthan gum)
Creamy Vanilla Plant Protein+ Shake

Source: Mintel Global New Product Database (GNPD), 2024
| Company | Wellness Natural |
|---|---|
| Brand | SimplyProtein |
| Category | Nutritional drinks and other beverages |
| Sub-category | Nutritional and meal replacement drinks |
| Market | Canada |
| Location of manufacture | Canada |
| Import status | Not imported |
| Store type | Natural / health food store |
| Date published | August 2023 |
| Launch type | New variety / range extension |
| Price in local currency | Can$13.99 |
Ingredients (on pack): Water, pea protein isolate, chicory root fibre, natural flavours, sunflower oil, canola oil, cane sugar, maltodextrin, gum acacia, sea salt, gellant gum, stevia leaf extract, vegetable and fruit extracts (broccoli extract, spinach extract, sweet potato extract, orange extract, pumpkin extract, maitake mushroom extract, papaya extract), silicon dioxide
The pea protein isolate market in the United States
According to Mintel's Global New Products Database (GNPD), there were a total of 201 new food and drink products containing pea protein isolate (as an ingredient-and all children) launched in the United States between January 2019 to December 2023. The number of new food and beverage product launches has decreased 7.5% in CAGR from 60 products released in 2019 to 44 products released in 2023. There have been 11 new pea protein isolate containing food and drink products launched year-to-date, January-June 2024. Of the 201 new food and drink products released between 2019 to 2023, 181 products (90.0% market share) were food products, while 20 products (10.0% market share) were drink products.
New food products (containing pea protein isolates) launched has decreased slightly in CAGR by 5.6% from 53 products released in 2019 to 42 products released in 2023, while new drink products launched have also decreased in CAGR by 27.0% from 7 to 2 products released during the same period.
The predominant categories of new pea protein isolate food products released in the U.S market were snacks (63 products), followed by processed fish, meat and egg products (30 products), meals and meal centers (27 products), bakery (14 products) and dairy (12 products), representing a combined market share of 80.7% during the 2019 to 2023 period. Of interest, the meal and meal centers food category experienced the greatest increase in CAGR (18.9%) from 4 products released in 2019 to 8 products released in 2023, while the remaining top categories experienced declining growth in the number of products released during the same period. In 2023, top food categories were snacks (14 products), processed fish, meat and egg products and meals and meal centers (8 products) respectively, breakfast cereals (4 products) and bakery (3 products).
In the drink category, nutritional drinks and other beverages released a total of 20 products during the review period, with the highest number of products released in 2019 (7 products) and 2021 (6 products).
| Product category | Yearly launch counts | Total | ||||
|---|---|---|---|---|---|---|
| 2019 | 2020 | 2021 | 2022 | 2023 | ||
| Total food and beverage | 60 | 26 | 37 | 34 | 44 | 201 |
| Food category | 53 | 25 | 31 | 30 | 42 | 181 |
| Snacks | 21 | 8 | 9 | 11 | 14 | 63 |
| Processed fish, meat and egg products | 9 | 2 | 3 | 8 | 8 | 30 |
| meals and meal centers | 4 | 4 | 5 | 6 | 8 | 27 |
| Bakery | 5 | 4 | 0 | 2 | 3 | 14 |
| Dairy | 6 | 2 | 2 | 0 | 2 | 12 |
| Drink category | 7 | 1 | 6 | 4 | 2 | 20 |
| Nutritional drinks and other beverages | 7 | 1 | 6 | 4 | 2 | 20 |
| Source: Mintel Global New Product Database (GNPD), 2024 | ||||||
Top flavours of pea protein isolate-containing food products noted were unflavoured/plain (28 products), chocolate (8 products), and blueberry and lemon (3 products), representing a combined market share of 21.5% between January 2019 to December 2023. Of interest, unflavoured/plain as a top flavour in the food category, experienced the largest increase in CAGR (10.7%) as products launched increased from 8 products in 2019 to 12 products in 2023. In 2023, top food flavours were unflavoured/plain (12 products), chocolate & biscuit/cookie, cinnamon, chocolate & s'mores and chocolate (white) & cookies & cream with (1 product) respectively.
Of the drink category product releases, chocolate (5 products), and vanilla/vanilla bourbon/vanilla (Madagascar) and vanilla bean with (4 products respectively) were identified as main flavours, representing a combined market share of 65.0% held between 2019 to 2023.
| Flavours | Yearly launch counts | Total | ||||
|---|---|---|---|---|---|---|
| 2019 | 2020 | 2021 | 2022 | 2023 | ||
| Total food and beverage | 60 | 26 | 37 | 34 | 44 | 201 |
| Food category | 53 | 25 | 31 | 30 | 42 | 181 |
| Unflavoured / plain | 8 | 4 | 1 | 3 | 12 | 28 |
| Chocolate | 1 | 1 | 2 | 4 | 0 | 8 |
| Blueberry and lemon | 0 | 1 | 1 | 1 | 0 | 3 |
| Vanilla / vanilla bourbon / vanilla Madagascar | 0 | 1 | 1 | 0 | 1 | 3 |
| Barbeque / BBQ / Barbacoa | 2 | 0 | 0 | 0 | 1 | 3 |
| Drink category | 7 | 1 | 6 | 4 | 2 | 20 |
| Chocolate | 0 | 0 | 3 | 1 | 1 | 5 |
| Vanilla / vanilla bourbon / vanilla Madagascar | 1 | 0 | 3 | 0 | 0 | 4 |
| Vanilla bean | 2 | 0 | 0 | 2 | 0 | 4 |
| Unflavoured / plain | 0 | 1 | 0 | 0 | 1 | 2 |
| Chocolate and peanut butter | 1 | 0 | 0 | 0 | 0 | 1 |
| Source: Mintel Global New Product Database (GNPD), 2024 | ||||||
During the review period, the most popular food product claims in recent pea protein isolate containing launches in the United States market were low / no / reduced allergen (113 products), followed by plant based (101 products) and gluten free with (100 products). Top drink claims reported on products released during the review period were high/added protein with (18 products), GMO free (17 products) and plant based with (16 products).
Of the top three food claims, low / no / reduced allergen included products within the following categories; snacks (54 products), processed fish, meat and egg products (13 products), meal and meal centers (12 products), bakery (3 products), dairy (10 products), breakfast cereals and sweet spreads (5 products respectively), desserts & ice cream (6 products), sauces & seasonings and baby food (2 products respectively) and soup (1 product). Plant Based claims were identified in snacks (32 products), processed fish, meat and egg products (22 products), meals and meal centers (15 products), bakery and dairy (4 and 5 products respectively), breakfast cereals (7 products), sweet spreads (4 products), desserts & ice cream (2 products), fruits & vegetables/sauces & seasonings/baby food with (3 products respectively) and soup (1 product). Gluten free claims were identified in the snacks (53 products), processed fish, meat and egg products (10 products), meal and meal centers (9 products), bakery and dairy (3 and 9 products respectively), breakfast cereals and sweet spreads (5 products respectively), desserts & ice cream (3 products), sauces and seasonings (2 products), and soup (1 product). Of the top food claims, only plant-based experienced positive growth, as the number of products released with this claim grew 1.0% in CAGR from 24 products in 2019 to 25 products in 2023. Recent plant-based and gluten free food product claims grew measurably from 17 to 25 products, and 12 to 18 products respectively, between 2022 to 2023
In the drink (nutritional drink and other beverages) category, high / added protein was an identified claim in 18 products, while gmo free was an identified claim in 17 products, and plant based claims were identified in 16 products. All top reported drink claims experienced declines in growth as high/added protein in particular, experienced the largest decline in CAGR (38.5%), as the amount of new products released with this claim decreased from 7 products in 2019 to 1 product released in 2023.
| Claims | Yearly launch counts | Total | ||||
|---|---|---|---|---|---|---|
| 2019 | 2020 | 2021 | 2022 | 2023 | ||
| Total food and beverage | 60 | 26 | 37 | 34 | 44 | 201 |
| Food category | 53 | 25 | 31 | 30 | 42 | 181 |
| low / no / reduced allergen | 41 | 17 | 20 | 15 | 20 | 113 |
| Plant based | 24 | 18 | 17 | 17 | 25 | 101 |
| Gluten free | 38 | 14 | 18 | 12 | 18 | 100 |
| Vegan/no animal ingredients | 26 | 11 | 19 | 15 | 17 | 88 |
| GMO free | 30 | 9 | 15 | 17 | 14 | 85 |
| Drink category | 7 | 1 | 6 | 4 | 2 | 20 |
| High/added protein | 7 | 1 | 5 | 4 | 1 | 18 |
| GMO free | 7 | 0 | 4 | 4 | 2 | 17 |
| Plant based | 5 | 1 | 5 | 4 | 1 | 16 |
| No additives/preservatives | 4 | 1 | 3 | 4 | 2 | 14 |
| Vegan/no animal ingredients | 3 | 1 | 5 | 4 | 1 | 14 |
|
Source: Mintel Global New Product Database (GNPD), 2024 1: products may report more than one claim |
||||||
The companies with the highest number of new pea protein isolate-containing (food) product launches in the review period were Daiya Foods (Top Brands; Daiya, Daiya Duets and Daiya Cheezy Mac) with 11 products, followed by Whole Foods Market (Top Brands; 365 Whole Foods Market and Whole Foods Market) with 9 products, and Temple Lifestyle (Top Brand; Hungry Buddha) with 9 products, representing a combined share of 16.0%. Daiya Foods released new pea protein isolate products primarily within the dairy category and meals and meal centers, while Whole Foods Market released new products within processed fish, meat and egg products and the snacks category. Temple Lifestyle in comparison released all new products within the snack category. In 2023, top companies releasing new pea protein isolate-containing (food) products were Whole Foods Market and Misfits with (4 products) respectively, and Rivalz Snacks, Avatar Natural Foods and Tattooed Chef with (3 products) respectively.
Top drink companies launching products within the nutritional drinks and other beverages category were Cytosport (Top Brand; Evolve) with 6 products, Tone It Up (Top Brand; Tone it Up) with 3 products and Worldwide Sport Nutritional Supplements (Top Brand Name; Pure Protein Super Food) with 2 product launches. Cytosport and (Nestlé HealthCare Nutrition) were the only companies to release new products (1 product) respectively, in 2023.
| Companies | Yearly launch counts | Total | ||||
|---|---|---|---|---|---|---|
| 2019 | 2020 | 2021 | 2022 | 2023 | ||
| Total food and beverage | 60 | 26 | 37 | 34 | 44 | 201 |
| Food category | 53 | 25 | 31 | 30 | 42 | 181 |
| Daiya Foods | 7 | 4 | 0 | 0 | 0 | 11 |
| Whole Foods Market | 0 | 2 | 2 | 1 | 4 | 9 |
| Temple Lifestyle | 0 | 2 | 2 | 5 | 0 | 9 |
| Tone It Up | 6 | 0 | 0 | 2 | 0 | 8 |
| Gathered Foods Corporation | 0 | 0 | 1 | 3 | 2 | 6 |
| Drink category | 7 | 1 | 6 | 4 | 2 | 20 |
| Cytosport | 0 | 0 | 2 | 3 | 1 | 6 |
| Tone It Up | 2 | 0 | 1 | 0 | 0 | 3 |
| Worldwode Sport Nutritional Supplements | 2 | 0 | 0 | 0 | 0 | 2 |
| Walmart | 0 | 0 | 2 | 0 | 0 | 2 |
| Herbalife International | 2 | 0 | 0 | 0 | 0 | 2 |
| Source: Mintel Global New Product Database (GNPD), 2024 | ||||||
In recent food launches, 86 products (47.5% market share) were launched as new variety/range extensions, followed by 59 products which were launched as new products (32.6% market share), and 19 products were released as new packaging (10.5% market share) between January 2019 to December 2023.
Of the products released in the drink category, 7 products released (35.0% market share) were new variety/range extensions products and the remaining launches were new products and new packaging (6 products respectively) and a relaunch (1 product).
Relatedly, top food packaging types launched during the review period were flexible (86 products), flexible stand-up pouches (29 products), tub (19 products), tray (14 products) and jars (8 products) representing a combined market share of 86.2%, while main drink package types launched were jars (11 products), cartons (6 products) and flexible sachets (1 product) representing a combined market share of 90.0% of packaged product types released in the market.
| Launch type | Yearly launch counts | Total | ||||
|---|---|---|---|---|---|---|
| 2019 | 2020 | 2021 | 2022 | 2023 | ||
| Total food and beverage | 60 | 26 | 37 | 34 | 44 | 201 |
| Food category | 53 | 25 | 31 | 30 | 42 | 181 |
| New variety/range extension | 20 | 12 | 20 | 14 | 20 | 86 |
| New product | 22 | 9 | 6 | 4 | 18 | 59 |
| New packaging | 4 | 0 | 2 | 10 | 3 | 19 |
| Relaunch | 7 | 4 | 1 | 2 | 1 | 15 |
| New formulation | 0 | 0 | 2 | 0 | 0 | 2 |
| Drink category | 7 | 1 | 6 | 4 | 2 | 20 |
| New variety/range extension | 2 | 1 | 2 | 2 | 0 | 7 |
| New product | 5 | 0 | 0 | 1 | 0 | 6 |
| New packaging | 0 | 0 | 3 | 1 | 2 | 6 |
| Relaunch | 0 | 0 | 1 | 0 | 0 | 1 |
| Source: Mintel Global New Product Database (GNPD), 2024 | ||||||
In the United States retail and e-commerce packaged food and drink market, new launched products containing pea protein isolate were distributed primarily through supermarkets (78 products), followed by mass merchandise/hypermarkets with (41 products) and natural/health food stores with (30 products), representing a combined market share of 74.1% during the 2019 to 2023 period.
Of the top distribution channels, products distributed through natural/health food stores increased in CAGR by 8.3% from 8 products in 2019 to 11 products in 2023, while supermarkets, mass merchandise/hypermarkets and internet/mail order channels in contrast, declined in new product distribution, during the same period.
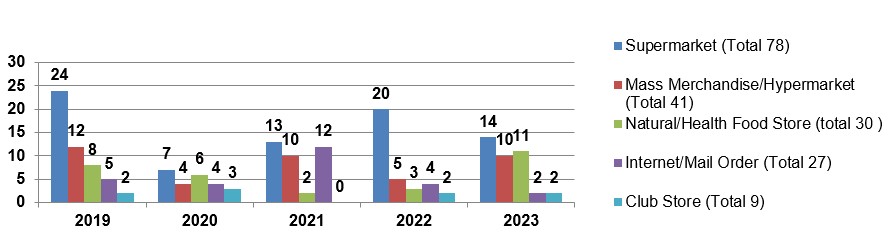
Description of above image
| Distribution channel | 2019 | 2020 | 2021 | 2022 | 2023 | Total |
|---|---|---|---|---|---|---|
| Supermarket | 24 | 7 | 13 | 20 | 14 | 78 |
| Mass merchandise / hypermarket | 12 | 4 | 10 | 5 | 10 | 41 |
| Natural / health food store | 8 | 6 | 2 | 3 | 11 | 30 |
| Internet / mail order | 5 | 4 | 12 | 4 | 2 | 27 |
| Club store | 2 | 3 | 0 | 2 | 2 | 9 |
Source: Mintel Global New Product Database (GNPD), 2024
Ingredient volume sales
Volume sales of pea protein ingredients in the United States packaged food market were valued at 25,171.1 tonnes in 2023, increasing 6.2% in CAGR from 19,808.6 tonnes in 2019. Pea protein ingredient volume sales in packaged food is expected to remain positive in the forecast period, increasing 3.3% in CAGR to reach volume sales of 28,651.5 tonnes by 2027.
Of the volume sales of pea protein ingredients in the packaged food market in the United States market, the dairy products and alternatives category yielded the largest volume sales with 14,490.4 tonnes (57.6% market share), followed by the snacks category, with volume sales of 6,020.8 tonnes (23.9% market share), and the staple foods category, with volume sales of 4,596.9 tonnes (18.3% market share) in 2023.
In the dairy products and alternatives category, the other plant-based milk segment represented the largest volume sales of pea protein ingredients with 11,587.8 tonnes (46.0% market share) in 2023, and experienced the greatest performance, increasing 10.1% in CAGR from volume sales of 7,891.8 tonnes in 2019. In the snacks category, the ice cream segment experienced the largest increase in CAGR (5.3%), as volume sales grew from 1,282.8 tonnes in 2019 to 1,578.4 tonnes in 2023. In the staple foods category, the meat and seafood substitutes segment experienced the largest increase in CAGR (18.1%) as volume sales increased from 530.6 tonnes in 2019 to 1,033.2 tonnes in 2023.
In the forecast period, all categories of packaged food ingredient volume sales are expected to increase in growth, albeit at lower rates, with the snack bars, other plant-based milk and meat and seafood substitutes segments experiencing the greatest increases in CAGR (4.9%, 3.7% and 5.3% respectively) by 2027.
| Categorization type | 2019 | 2023 | CAGR* % 2019-2023 | 2024 | 2027 | CAGR* % 2023-2027 |
|---|---|---|---|---|---|---|
| Packaged Food | 19,808.6 | 25,171.1 | 6.2 | 26,087.4 | 28,651.5 | 3.3 |
| Snacks | 5,929.8 | 6,020.8 | 0.4 | 6,349.9 | 7,168.1 | 4.5 |
| Ice Cream | 1,282.8 | 1,578.4 | 5.3 | 1,653.9 | 1,793.6 | 3.2 |
| Snack Bars | 4,647.0 | 4,442.4 | −1.1 | 4,696.0 | 5,374.5 | 4.9 |
| Dairy Products and Alternatives | 10,388.9 | 14,490.4 | 8.7 | 15,017.1 | 16,492.4 | 3.3 |
| Cheese | 1,272.8 | 1,364.1 | 1.7 | 1,402.4 | 1,487.0 | 2.2 |
| Yoghurt | 1,216.7 | 1,527.8 | 5.9 | 1,541.3 | 1,593.5 | 1.1 |
| Other Plant-based Milk | 7,891.8 | 11,587.8 | 10.1 | 12,062.2 | 13,399.1 | 3.7 |
| Staple Foods | 3,424.6 | 4,596.9 | 7.6 | 4,656.4 | 4,924.0 | 1.7 |
| Packaged Flat Bread | 643.2 | 720.2 | 2.9 | 741.3 | 789.2 | 2.3 |
| Packaged Leavened Bread | 2,206.5 | 2,801.2 | 6.1 | 2,757.9 | 2,822.2 | 0.2 |
| Meat and Seafood Substitutes | 530.6 | 1,033.2 | 18.1 | 1,114.2 | 1,268.1 | 5.3 |
|
Source: Euromonitor International, 2024 1: protein derived from pea sources, including but not limited to isolates and concentrates. 2: represents end-product sales through retail and foodservice channels to consumers and is the total aggregation of all the individual ingredients used in the manufacture of products that are tracked in Packaged Food. *CAGR: Compound Annual Growth Rate Ingredient data as of July 2023 |
||||||
Examples of new products
White Choc Cookies 'n' Cream Flavoured Plant-Powered Choc Protein Bar
Source: Mintel Global New Product Database (GNPD), 2024
| Company | Misfits |
|---|---|
| Brand | Misfits |
| Category | Snacks |
| Sub-category | Snack / Cereal / Energy Bars |
| Market | United States |
| Location of manufacture | United Kingdom |
| Import status | Imported product |
| Store name | Whole Foods Market |
| Store type | Natural / health food store |
| Date published | November 2023 |
| Launch type | New product |
| Price in local currency | US$2.79 |
Ingredients (on pack): plant protein blend (pea protein isolate, soy protein nuggets (soy protein isolate, cocoa, tapioca starch), soy protein isolate), confectionary coating (cacao fat, rice powder (rice syrup, rice starch, rice flour), sugar, natural flavour), chicory root fiber, beet fiber, peanut paste, rapeseed lecithin, glycerin, coconut oil, cacao fat, water, natural flavour, acacia [gum arabic], green tea extract, steviol glycosides, citric acid, salt
Plant Based Nuggets

Source: Mintel Global New Product Database (GNPD), 2024
| Company | Raised & Rooted |
|---|---|
| Brand | Raised & Rooted |
| Category | Processed fish, meat and egg products |
| Sub-category | Meat substitutes |
| Market | United States |
| Store type | Supermarket |
| Date published | June 2022 |
| Launch type | New packaging |
| Price in local currency | US$4.99 |
Ingredients (on pack): seasoned plant protein portion: vegan fibers (water, pea protein isolate, canola oil, sodium alginate, citrus fiber, calcium chloride), water, oat fiber, vital wheat gluten, pea protein concentrate, seasoning (maltodextrin (from corn), salt, natural flavour, yeast extract, palm oil, carrot fiber, citric acid, medium chain triglycerides, onion powder, torula yeast, onion juice concentrate, spice, canola oil), flaxseed, methylcellulose, salt, natural flavouring (sunflower oil, rosemary extract), breaded with: water, wheat flour, yellow cornflour, food starch, salt, leavening (sodium acid pyrophosphate, sodium bicarbonate), spices, natural flavour, breading set in vegetable oil (including soybean oil)
Butter Croissant with Hazelnut Nougat Creme

Source: Mintel Global New Product Database (GNPD), 2024
| Company | Lidl |
|---|---|
| Brand | Lidl |
| Category | Bakery |
| Sub-category | Cakes, pastries and sweet goods |
| Market | United States |
| Store type | Supermarket |
| Date published | September 2020 |
| Launch type | New variety / range extension |
| Price in local currency | US$3.99 |
Ingredients (on pack): Wheat flour (wheat flour, ascorbic acid (dough conditioner)), hazelnut crème filling (sugar, hazelnuts, palm oil, sunflower oil, skim milk, alkalized cocoa, sunflower lecithin, natural vanilla flavour), cultured butter (cream, cultures), water, sugar, chopped hazelnuts, salt, flour treatment agent blend (wheat gluten, wheat flour, ascorbic acid (dough conditioner), enzymes), yeast, glaze (water, pea protein isolate, sugar)
For more information
The Canadian Trade Commissioner Service:
International Trade Commissioners can provide Canadian industry with on-the-ground expertise regarding market potential, current conditions and local business contacts, and are an excellent point of contact for export advice.
More agri-food market intelligence:
International agri-food market intelligence
Discover global agriculture and food opportunities, the complete library of Global Analysis reports, market trends and forecasts, and information on Canada's free trade agreements.
Agri-food market intelligence service
Canadian agri-food and seafood businesses can take advantage of a customized service of reports and analysis, and join our email subscription service to have the latest reports delivered directly to their inbox.
More on Canada's agriculture and agri-food sectors:
Canada's agriculture sectors
Information on the agriculture industry by sector. Data on international markets. Initiatives to support awareness of the industry in Canada. How the department engages with the industry.
Resources
- Euromonitor International, 2024
- Mintel Global New Products Database, 2024
Customized Report Service – Product Launch Analysis – Pea protein isolate as an Ingredient in packaged food and beverage products – Canada and the United States markets
Global Analysis Report
Prepared by: Laurie Bernardi, International Market Research Analyst
© His Majesty the King in Right of Canada, represented by the Minister of Agriculture and Agri-Food (2024).
Photo credits
All photographs reproduced in this publication are used by permission of the rights holders.
All images, unless otherwise noted, are copyright His Majesty the King in Right of Canada.
To join our distribution list or to suggest additional report topics or markets, please contact:
Agriculture and Agri-Food Canada, Global Analysis1341 Baseline Rd, Tower 5, 3rd floor
Ottawa ON K1A 0C5
Canada
Email: aafc.mas-sam.aac@agr.gc.ca
The Government of Canada has prepared this report based on primary and secondary sources of information. Although every effort has been made to ensure that the information is accurate, Agriculture and Agri-Food Canada (AAFC) assumes no liability for any actions taken based on the information contained herein.
Reproduction or redistribution of this document, in whole or in part, must include acknowledgement of agriculture and agri-food Canada as the owner of the copyright in the document, through a reference citing AAFC, the title of the document and the year. Where the reproduction or redistribution includes data from this document, it must also include an acknowledgement of the specific data source(s), as noted in this document.
Agriculture and Agri-Food Canada provides this document and other report services to agriculture and food industry clients free of charge.