

Note: This report includes forecasting data that is based on baseline historical data.
Market snapshot
Driven by the growth of home entertaining and cocktail making, there are distinct trends happening across the world [Survey of 547 users: indicates +43% of spirit consumers aged 18-34 are making cocktails more frequently in Italy - more now than they did prior to COVID-19]. Within the Europe, the Middle East and Africa (EMEA) region, Europe in particular has seen a surge in gin product launches (+3-10% compared to launch share of spirits at 1-5% in Italy and Poland). Consumers throughout the region also, pay close attention towards environmental and sustainable packaging claims (20% of 872 consumers in Spain and Italy look for sustainability produced spirits products). Within the Asia-Pacific (APAC) region, particularly within China, there is a boom in ready-to-drink (RTD) innovation (47% out of 3,000 users), mainly for its convenience and fashionable attributes. Spirit brands with recognisable and sweeter fruit flavours are increasingly becoming popular in this region, as well (55% are willing to try a new novel flavoured alcoholic drink).
Meanwhile, in the Americas region consumers are attracted to spirit and wine brands with distinctive packaging since they like to display them in their homes (34% - 959 users). The popularity of RTDs are also driving large beverage brands to enter the category, whereby 44% out of 2,000 consumers in the United States have drunk an RTD in the last 12 months. In the North American region, the RTD category is dominated by alcohol flavours such as Margarita, Pina Colada and gin & tonic; while the fruit, citrus and berry fruit flavour subcategories are led by mango, lime and watermelon flavours. In the Latin America region, wine producers are switching to cans to offer consumers a more convenient and portable format. Argentinian wineries lead the charge in canned wine.
According to Mintel's Innovation report, to engage alcohol moderators, who generally cite that health and saving money are the primary or key reasons for cutting back, brands should try to position spirits and wines as permissible treats. Even though there is a cost-of-living crisis, mid-range brands should look towards becoming premium products and premium brands should remind drinkers why they offer affordable luxury products. Another key point is to maintain a consistent voice on sustainability, since sustainably produced spirits and wine brands are appealing and will have credibility when ecological messages become more prolific.
Trade overview
In 2022, global imports of cider, perry, mead, sake and other fermented non-grape wine beverages (HS:2206) reached a total of US$1.7 billion (340.7 million litres). This import value has been increasing at a CAGR of 3.9%, especially for rice wine, including medicated (24.8%), sake, including non-sparkling wine, n.e.s. (15.6%), beer mixtures, including non-alcoholic (11%), and fruit/vegetable, grape wine-based beverages, fortified or fermented (10.7%) between 2018 and 2022. During this time period, the largest import declines were for cider fermented, whether still or sparkling registered a decline of 12.3%, along with Cheongju (−1.1%), and apple or pear wine or fermented, fortified beverages (−69.7%).
The top global importers of cider, perry, mead, sake and other fermented non-grape wine beverages were the United States (24%), United Kingdom (14.9%), and China (6.1%), with Canada (6th largest) importing US$64 million (3.7%) in 2022. The largest categories in terms of value imports were mead, sparkling fermented mead beverages & mixtures derived from fruit or water honey (including cider, perry & water honey) at US$404.3 million, followed by beer mixtures, including non-alcoholic (US$164.2 million), sake, including non-sparkling wine, n.e.s. (US$53.5 million), cider, fermented, whether still or sparkling (US$51.2 million), fruit/vegetable, grape wine-based beverages, fortified or fermented (US$47 million), rice wine, including medicated (US$43 million), and Cheongju (US$21.5 million). Other smaller valued imports included apple or pear wine or fermented, fortified beverages, Takju, Perry, and Yakju in 2022.
| Country | 2018 | 2019 | 2020 | 2021 | 2022 | CAGR* % 2018-2022 |
|---|---|---|---|---|---|---|
| Total - global imports | 1,501.5 | 1,505.0 | 1,697.2 | 1,896.6 | 1,748.4 | 3.9 |
| 1. United States | 237.2 | 288.8 | 511.7 | 522.7 | 419.2 | 15.3 |
| 2. United Kingdom | 180.9 | 168.6 | 156.3 | 196.5 | 259.9 | 9.5 |
| 3. China | 44.4 | 60.3 | 73.4 | 117.7 | 107.2 | 24.6 |
| 4. Japan | 131.8 | 100.7 | 92.6 | 84.4 | 79.4 | −11.9 |
| 5. Hong Kong | 49.0 | 53.7 | 88.0 | 101.6 | 70.2 | 9.4 |
| 6. Canada | 81.1 | 72.2 | 57.3 | 63.7 | 64.0 | −5.7 |
| 7. Australia | 25.6 | 22.3 | 27.8 | 24.9 | 51.9 | 19.3 |
| 8. Korea | 34.0 | 29.2 | 33.2 | 49.1 | 51.3 | 10.8 |
| 9. Germany | 62.1 | 51.3 | 41.3 | 54.3 | 47.0 | −6.7 |
| 10. Netherlands | 35.7 | 33.9 | 34.1 | 35.2 | 35.2 | −0.4 |
| Subtotal - top 10 importers | 881.8 | 881.0 | 1,115.7 | 1,249.9 | 1,185.2 | 7.7 |
|
Source: Global trade tracker, 2023 *CAGR: Compound Annual Growth Rate |
||||||
| Country | 2018 | 2019 | 2020 | 2021 | 2022 | CAGR* % 2018-2022 |
|---|---|---|---|---|---|---|
| Total - global suppliers | 322.5 | 304.8 | 418.6 | 444.7 | 340.7 | 2.8 |
| 1. United States | 93.1 | 121.7 | 240.4 | 276.2 | 172.2 | 9.1 |
| 2. Japan | 140.5 | 96.2 | 89.6 | 76.4 | 69.8 | −7.7 |
| 3. Australia | 12.8 | 12.1 | 17.4 | 11.0 | 25.0 | 20.0 |
| 4. China | 10.8 | 14.8 | 16.5 | 22.8 | 17.4 | 4.0 |
| 5. Canada | 23.6 | 21.5 | 12.6 | 12.4 | 12.8 | −12.2 |
| 6. Hong Kong | 8.5 | 9.1 | 17. | 16.5 | 12.5 | 8.3 |
| 7. Thailand | 7.8 | 8.8 | 6.5 | 7.1 | 9.0 | 0.6 |
| 8. Mexico | 12.0 | 7.0 | 4.5 | 6.0 | 7.6 | 2.0 |
| 9. South Africa | 3.4 | 1.3 | 0.9 | 1.7 | 3.7 | 28.4 |
| 10. Singapore | 2.4 | 2.4 | 2.6 | 3.2 | 3.4 | 9.3 |
| Subtotal - top 10 suppliers | 314.8 | 295.0 | 407.9 | 433.3 | 333.4 | 3.1 |
|
Source: Global trade tracker, 2023 *CAGR: Compound Annual Growth Rate |
||||||
| Description | 2018 | 2019 | 2020 | 2021 | 2022 | CAGR* % 2018-2022 |
|---|---|---|---|---|---|---|
| Total - Cider, perry, mead, sakeand other fermented and non-alcoholic beverages[1], nowhere else specified (excluding wine of fresh grapes, grape must or vermouth) (HS: 220600) | 1,501.5 | 1,505.0 | 1,697.2 | 1,896.6 | 1,748.4 | 3.9 |
| Mead, sparkling fermented mead beverages and mixtures derived from fruit or water honey (including cider, perry and water honey) | 370.1 | 342.3 | 329.9 | 417.0 | 404.3 | 2.2 |
| Beer mixtures (including non-alcoholic) | 108.0 | 117.4 | 102.6 | 101.5 | 164.2 | 11.0 |
| Sake (including wine, nowhere else specified, not sparkling) | 30.0 | 34.9 | 44.7 | 67.7 | 53.5 | 15.6 |
| Cider fermented, whether still or sparkling | 86.5 | 74.6 | 46.5 | 54.8 | 51.2 | −12.3 |
| Fruit/vegetable, prune, grape wine-based beverages, fortified or fermented | 31.3 | 33.3 | 38.1 | 46.6 | 47.0 | 10.7 |
| Rice wine (including medicated) | 17.7 | 21.2 | 20.2 | 39.2 | 43.0 | 24.8 |
| Cheongju | 22.5 | 15.8 | 11.7 | 15.6 | 21.5 | −1.1 |
| Apple or pear wine or fermented, fortified beverages | 14.0 | 21.2 | 7.6 | 0.212 | 0.119 | −69.7 |
| Takju | 0.005 | 0.0 | 0.024 | 0.010 | 0.047 | 78.7 |
| Perry | 0.067 | 0.035 | 0.010 | 0.008 | 0.025 | −21.6 |
| Yakju | 0.0 | 0.00001 | 0.0 | 0.00011 | 0.00007 | 88.5 |
| Other mixtures of fermented and non-alcoholic beverages (including combined totals for cider, perry, mead, sake etc.) | 825.2 | 848.7 | 1,098.9 | 1,158.2 | 968.6 | 4.1 |
|
Source both tables: Global trade tracker, 2023 *CAGR: Compound Annual Growth Rate 1: Selected sub-categories of interest are categorized using the highest reported levels only to estimate market size. Since there are over 261 sub-categories under HS: 220600, all combined sub-categories that contained more than one product were included in the 'Other fermented and non-alcoholic beverage category - that is, HS: 2206005100 with description "cider and perry". Thus, each individual category may not reflect all reported values if the products weren't fully differentiated. |
||||||
| Description | 2018 | 2019 | 2020 | 2021 | 2022 | CAGR* % 2018-2022 |
|---|---|---|---|---|---|---|
| Total - Cider, perry, mead, sakeand other fermented and non-alcoholic beverages[1], nowhere else specified (excluding wine of fresh grapes, grape must or vermouth) (HS: 220600) | 322.5 | 304.8 | 418.6 | 444.7 | 340.7 | 2.8 |
| Mead, sparkling fermented mead beverages and mixtures derived from fruit or water honey (including cider, perry and water honey) | 1.5 | 0.613 | 37.1 | 10.0 | 40.1 | 127.6 |
| Beer mixtures (including non-alcoholic) | 8.4 | 3.9 | 0.386 | 0.395 | 0.325 | −55.7 |
| Sake (including wine, nowhere else specified, not sparkling) | 4.8 | 5.3 | 8.3 | 8.8 | 7.2 | 10.7 |
| Cider fermented, whether still or sparkling | 68.6 | 58. | 34.1 | 36.7 | 32.3 | −17.2 |
| Fruit, vegetable, prune, grape wine-based beverages, fortified or fermented | 7.8 | 7.7 | 9.3 | 7.4 | 18.6 | 24.4 |
| Rice wine (including medicated) | 0.782 | 0.795 | 0.782 | 1.1 | 1.3 | 14.6 |
| Other mixtures of fermented and non-alcoholic beverages (including combined totals for cider, perry, mead, sake etc.) | 232.1 | 229.2 | 365.8 | 390.3 | 280.9 | 4.9 |
|
Source both tables: Global trade tracker, 2023 *CAGR: Compound Annual Growth Rate 1: Selected sub-categories of interest are categorized using the highest reported levels only to estimate market size. Since there are over 261 sub-categories under HS: 220600, all combined sub-categories that contained more than one product were included in the 'Other fermented and non-alcoholic beverage category - that is, HS: 2206005100 with description "cider and perry". Thus, each individual category may not reflect all reported values if the products weren't fully differentiated. |
||||||
Retail sales and market sizes
Global view - wine
In 2022, wine (including fortified wine and vermouth, non-grape wine, sparkling wine - champagne, still light grape & non-alcoholic wine) totaled US$173.8 billion (20,190.6 million litres) in off-trade retail sales and US$164.3 billion (5,908.5 million litres) in on-trade sales based on retailer selling price (RSP). Total off-trade value sales have been growing by a CAGR of 3.8% (2017-2022), while on-trade sales have historically declined by a CAGR of 0.2%, expected to grow by a CAGR of 6.3% and 8.3%, respectively (2022-2027).
The United States was the largest importer of cider, perry, mead, sake and other fermented (non-grape) wine beverages, importing a total of US$419.2 million (172.2 million litres) in 2022. Non-grape wine was the best performing category in 2022, with total volume sales increasing by 6% to reach 24 million litres. E&J Gallo Winery Inc. was the leading American player with a total volume share of 26% in 2022. Over the past couple of years, total volume growth in wine in the US turned to decline with near-stagnation seen in 2020, which registered a total volume sales growth of 0.3% in 2022 to reach 3.2 billion litres; set to remain stable at a CAGR of 0.3% over the forecast period. The highly educated, average wine consumer in the US is predominantly above the age of 50 and as these baby boomers reach retirement age, their spending becomes more restricted than in the past. Also, with continuous price increases due to inflation, consumption of wine is becoming more as a luxury and consumers are looking for cheaper alternatives, especially amongst younger consumers who are experimenting more with RTDs, spirits, and beer, which provide more for less.Footnote 1
The United Kingdom was the 2nd largest importer of cider, perry, mead, sake and other fermented (non-grape) wine beverages, importing a total of US$259.9 million (volume not available) in 2022. Non-alcoholic wine was the best performing category in 2022, with total volume sales growing by 3% to reach 3.5 million litres. Accolade Wine Ltd. was the leading player in the UK with a total volume sales share of 11% in 2022. Total volume sales of wine recorded just 1% growth in 2022 to reach 1.3 billion litres and is set to grow at a CAGR of 0.3% over the forecast period by 2027. Off-trade retail sales in the UK experienced a marginal decline, compared to on-trade's significant rise of 19% in 2022 (2nd consecutive year of double-digit volume increase), as consumers were able to shift back to drinking within on-trade venues like social pubs and restaurants that were able to fully operate without pandemic-related restrictions. Wine registered total current value sales growth of 13% in 2022, driven by an 8% rise in off-trade growth and a 28% rise through on-trade. Value growth was mainly a result of a significant increase in the sectors average unit price in 2022, with on-trade prices being raised the most having to face increased energy costs and labour shortages.Footnote 2
China was the 3rd largest importer of cider, perry, mead, sake and other fermented (non-grape) wine beverages, importing a total of US$107.2 million (17.4 million litres) in 2022. Non-alcoholic wine was the best performing category in 2022, with total volume sales still falling by 7% to land at 1.6 million litres. Zhejiang Guyue Longshan Shaoxing Wine Company Ltd. was the leading Chinese player in 2022, with a total volume share of 9%. Total volume sales fell by 12% to land at 2.9 billion litres, which is set to continue to decrease at a CAGR of 4% over the forecast period to decline to 2.4 billion litres. In light of the COVID-induced lockdowns in 2022, there was a notable reduction in the level of imports of wine within China (−US$10.5 million / −8.9%) that in turn decreased the aggregate wine supply impacting the consumption both in on/off-trade. In China, wine consumption primarily revolves around social gatherings, particularly during wedding ceremonies and business banquets, resulting in a significant reduction in demand for wine due to the imposition of lockdown policies. Albeit, Chinese traditional rice wine assumes a prominent role within the realm of the non-grape wine category. Chinese consumers are progressively enjoying emerging offerings such as osmanthus rice wine, in addition to a diverse array of non-grape libations encompassing fruit wines and mead. Sparkling wine is also, expected to grow in popularity in restaurants in China.Footnote 3
In terms of Canada's performance, it was the 6th largest importer of cider, perry, mead, sake and other fermented (non-grape) wine beverages, importing a total of US$64.0 million (12.8 million litres) in 2022. The most dynamic growth and the best performing category in 2022 has been in non-alcoholic wine, with total volume Canadian sales still increasing by 21% to reach 8.8 million litres. Arterra Wines Canada Inc. and Andrew Peller Ltd. were the leading players in 2022, with a total volume share of 16.8% and 12.1%, respectively. Wine growth continued to shrink in 2022 overall by a total volume sales of 0.2% to reach 657 million litres, which is set to increase at a CAGR of 3% over the forecast period to reach 747 million litres in 2027. The on-trade sector is the main driver for growth benefitting from a surge in the number of foodservice outlets, as well as, a strong comeback of dining out after a two-year lockdown. Wines along with beer, are losing market share to the exponentially strong growth in RTDs and spirits. Albeit, some wine categories, such as sparkling wine, show growth due to increased post-pandemic socialization events, while other wine types are being replaced by other types of alcoholic beverages that offer more variety.Footnote 4
| Category | 2017 | 2022 | CAGR* % 2017-2022 | 2023 | 2027 | CAGR* % 2022-2027 | |
|---|---|---|---|---|---|---|---|
| Wine (Total) | Off-trade | 144,077.2 | 173,837.1 | 3.8 | 186,718.8 | 235,456.8 | 6.3 |
| On-trade | 165,999.4 | 164,264.9 | −0.2 | 184,019.9 | 244,636.5 | 8.3 | |
| Total | 310,076.5 | 338,101.9 | 1.7 | 370,738.7 | 480,093.4 | 7.3 | |
| Fortified wine and vermouth | Off-trade | 4,799.9 | 5,864.1 | 4.1 | 6,449.7 | 8,817.0 | 8.5 |
| On-trade | 6,405.7 | 6,883.3 | 1.4 | 8,149.6 | 13,519.8 | 14.5 | |
| Total | 11,205.5 | 12,747.5 | 2.6 | 14,599.3 | 22,336.8 | 11.9 | |
| Non-grape wine | Off-trade | 13,652.8 | 12,661.7 | −1.5 | 12,901.8 | 13,056.0 | 0.6 |
| On-trade | 16,969.7 | 14,114.8 | −3.6 | 15,271.0 | 17,142.8 | 4.0 | |
| Total | 30,622.5 | 26,776.5 | −2.6 | 28,172.8 | 30,198.8 | 2.4 | |
| Sparkling wine | Off-trade | 17,997.6 | 25,796.4 | 7.5 | 28,612.6 | 38,656.2 | 8.4 |
| On-trade | 22,551.8 | 24,694.1 | 1.8 | 28,908.8 | 42,042.1 | 11.2 | |
| Total | 40,549.5 | 50,490.5 | 4.5 | 57,521.4 | 80,698.3 | 9.8 | |
| Champagne | Off-trade | 5,618.8 | 7,526.5 | 6.0 | 8,184.8 | 9,848.0 | 5.5 |
| On-trade | 12,029.1 | 12,383.4 | 0.6 | 14,293.3 | 20,185.1 | 10.3 | |
| Total | 17,647.8 | 19,909.9 | 2.4 | 22,478.1 | 30,033.2 | 8.6 | |
| Still light grape wine | Off-trade | 107,549.4 | 128,762.0 | 3.7 | 137,860.0 | 173,333.7 | 6.1 |
| On-trade | 120,027.4 | 118,084.6 | −0.3 | 131,140.0 | 171,052.2 | 7.7 | |
| Total | 227,576.8 | 246,846.6 | 1.6 | 268,999.9 | 344,385.9 | 6.9 | |
| Non-alcoholic wine | Off-trade | 77.5 | 752.8 | 57.6 | 894.7 | 1,593.9 | 16.2 |
| On-trade | 44.8 | 488.1 | 61.2 | 550.6 | 879.6 | 12.5 | |
| Total | 122.2 | 1,241.0 | 59.0 | 1,445.3 | 2,473.6 | 14.8 | |
|
Source: Euromonitor International, 2023 *CAGR: Compound Annual Growth Rate |
|||||||
| Category | 2017 | 2022 | CAGR* % 2017-2022 | 2023 | 2027 | CAGR* % 2022-2027 | |
|---|---|---|---|---|---|---|---|
| Wine (Total) | Off-trade | 20,882.0 | 20,190.6 | −0.7 | 20,188.0 | 20,649.9 | 0.5 |
| On-trade | 7,172.3 | 5,908.5 | −3.8 | 6,171.0 | 6,829.6 | 2.9 | |
| Total | 28,054.3 | 26,099.1 | −1.4 | 26,359.0 | 27,479.5 | 1.0 | |
| Fortified wine and vermouth | Off-trade | 520.2 | 513.7 | −0.3 | 515.2 | 534.2 | 0.8 |
| On-trade | 175.4 | 154.7 | −2.5 | 164.3 | 190.7 | 4.3 | |
| Total | 695.6 | 668.4 | −0.8 | 679.6 | 725.0 | 1.6 | |
| Non-grape wine | Off-trade | 2,927.8 | 2,328.9 | −4.5 | 2,275.3 | 2,110.4 | −2.0 |
| On-trade | 827.3 | 580.4 | −6.8 | 606.2 | 625.1 | 1.5 | |
| Total | 3,755.1 | 2,909.3 | −5.0 | 2,881.5 | 2,735.5 | −1.2 | |
| Sparkling wine | Off-trade | 1,625.3 | 1,879.5 | 2.9 | 1,938.3 | 2,117.3 | 2.4 |
| On-trade | 463.5 | 434.9 | −1.3 | 484.0 | 597.5 | 6.6 | |
| Total | 2,088.8 | 2,314.4 | 2.1 | 2,422.2 | 2,714.8 | 3.2 | |
| Champagne | Off-trade | 131.0 | 155.7 | 3.5 | 157.7 | 155.0 | −0.1 |
| On-trade | 88.9 | 75.4 | −3.2 | 82.6 | 99.6 | 5.7 | |
| Total | 219.9 | 231.1 | 1.0 | 240.3 | 254.6 | 2.0 | |
| Still light grape wine | Off-trade | 15,794.1 | 15,383.6 | −0.5 | 15,366.0 | 15,756.4 | 0.5 |
| On-trade | 5,701.0 | 4,723.4 | −3.7 | 4,900.3 | 5,394.2 | 2.7 | |
| Total | 21,495.1 | 20,107.0 | −1.3 | 20,266.2 | 21,150.6 | 1.0 | |
| Non-alcoholic wine | Off-trade | 14.6 | 84.8 | 42.2 | 93.2 | 131.6 | 9.2 |
| On-trade | 5.0 | 15.2 | 24.9 | 16.2 | 22.0 | 7.7 | |
| Total | 19.6 | 100.1 | 38.6 | 109.4 | 153.6 | 8.9 | |
|
Source: Euromonitor International, 2023 *CAGR: Compound Annual Growth Rate |
|||||||
Sparkling wine - champagne
In 2022, total sales of champagne were US$19.9 billion (231.1 million litres), which consisted of US$7.5 billion (155.7 million litres) in off-trade retail sales and US$12.4 billion (75.4 million litres) in on-trade sales. Off-trade sales grew the most at a CAGR of 6.0% compared to on-trade sales at a CAGR of 0.6% between 2017 and 2022. However, on-trade sales are forecast to turn around with a CAGR of 10.3% versus off-trade (5.5%) between 2022 and 2027.
The largest regions with the most total off/on-trade value sales of champagne were Western Europe (US$10.4 billion), Asia Pacific (US$3.5 billion), and North America (US$2.1 billion) in 2022. Top regions with the highest total historical growth (2017 to 2022) were Australasia (CAGR:10.8%), followed by North America (7.1%), and Eastern Europe (6.7%); while Western Europe has declined during this period at a CAGR of −0.1%.
Off-trade sales brought in the most value over on-trade sales within the following regions: Australasia (off-trade share: 57.2%), Eastern Europe (65.8%), Latin America (65%), and North America (60.9%) in 2022. Alternatively, the Asia Pacific (85.6%), MENA (74.4%), and Western Europe (63.3%) regions registered the highest sales within on-trade sales in 2022.
| Region | 2017 | 2022 | CAGR* % 2017-2022 | 2023 | 2027 | CAGR* % 2022-2027 | |
|---|---|---|---|---|---|---|---|
| World (Total) | Off-trade | 5,618.8 | 7,526.5 | 6.0 | 8,184.8 | 9,848.0 | 5.5 |
| On-trade | 12,029.1 | 12,383.4 | 0.6 | 14,293.3 | 20,185.1 | 10.3 | |
| Total | 17,647.8 | 19,909.9 | 2.4 | 22,478.1 | 30,033.2 | 8.6 | |
| Asia Pacific | Off-trade | 288.8 | 498.2 | 11.5 | 543.1 | 708.0 | 7.3 |
| On-trade | 2,427.7 | 2,972.6 | 4.1 | 3,198.0 | 3,839.5 | 5.3 | |
| Total | 2,716.5 | 3,470.8 | 5.0 | 3,741.2 | 4,547.5 | 5.6 | |
| Australasia | Off-trade | 586.8 | 869.6 | 8.2 | 947.9 | 1,093.9 | 4.7 |
| On-trade | 325.9 | 651.5 | 14.9 | 946.4 | 2,941.9 | 35.2 | |
| Total | 912.6 | 1,521.0 | 10.8 | 1,894.3 | 4,035.7 | 21.6 | |
| Eastern Europe | Off-trade | 167.9 | 266.8 | 9.7 | 307.7 | 465.4 | 11.8 |
| On-trade | 125.5 | 138.4 | 2.0 | 156.1 | 259.1 | 13.4 | |
| Total | 293.4 | 405.2 | 6.7 | 463.8 | 724.5 | 12.3 | |
| Latin America | Off-trade | 381.8 | 479.1 | 4.6 | 576.7 | 1,104.6 | 18.2 |
| On-trade | 194.9 | 258.1 | 5.8 | 306.9 | 524.9 | 15.3 | |
| Total | 576.7 | 737.2 | 5.0 | 883.6 | 1,629.4 | 17.2 | |
| Middle Eastern and Africa (MENA) | Off-trade | 233.5 | 323.4 | 6.7 | 358.3 | 541.5 | 10.9 |
| On-trade | 938.1 | 938.9 | 0.0 | 1,020.8 | 1,369.6 | 7.8 | |
| Total | 1,171.6 | 1,262.4 | 1.5 | 1,379.1 | 1,911.1 | 8.6 | |
| North America | Off-trade | 796.2 | 1,259.2 | 9.6 | 1,323.9 | 1,495.4 | 3.5 |
| On-trade | 669.4 | 808.7 | 3.9 | 887.0 | 1,111.9 | 6.6 | |
| Total | 1,465.6 | 2,067.9 | 7.1 | 2,210.9 | 2,607.3 | 4.7 | |
| Western Europe | Off-trade | 3,163.9 | 3,830.2 | 3.9 | 4,127.3 | 4,439.2 | 3.0 |
| On-trade | 7,347.5 | 6,615.2 | −2.1 | 7,778.0 | 10,138.3 | 8.9 | |
| Total | 10,511.3 | 10,445.4 | −0.1 | 11,905.3 | 14,577.5 | 6.9 | |
|
Source: Euromonitor International, 2023 *CAGR: Compound Annual Growth Rate |
|||||||
| Region | 2017 | 2022 | CAGR* % 2017-2022 | 2023 | 2027 | CAGR* % 2022-2027 | |
|---|---|---|---|---|---|---|---|
| World (Total) | Off-trade | 131.0 | 155.7 | 3.5 | 157.7 | 155.0 | −0.1 |
| On-trade | 88.9 | 75.4 | −3.2 | 82.6 | 99.6 | 5.7 | |
| Total | 219.9 | 231.1 | 1.0 | 240.3 | 254.6 | 2.0 | |
| Asia Pacific | Off-trade | 3.7 | 5.1 | 6.6 | 5.1 | 5.3 | 0.8 |
| On-trade | 10.9 | 11.8 | 1.6 | 12.3 | 14.3 | 3.9 | |
| Total | 14.6 | 16.8 | 2.8 | 17.4 | 19.6 | 3.1 | |
| Australasia | Off-trade | 9.1 | 13.5 | 8.2 | 14.3 | 15.4 | 2.7 |
| On-trade | 2.6 | 4.5 | 11.6 | 5.8 | 12.2 | 22.1 | |
| Total | 11.8 | 18.1 | 8.9 | 20.1 | 27.6 | 8.8 | |
| Eastern Europe | Off-trade | 2.7 | 3.4 | 4.7 | 3.4 | 4.2 | 4.3 |
| On-trade | 1.1 | 0.9 | −3.9 | 0.9 | 1.3 | 7.6 | |
| Total | 3.8 | 4.2 | 2.0 | 4.3 | 5.5 | 5.5 | |
| Latin America | Off-trade | 4.4 | 4.0 | −1.9 | 4.3 | 5.0 | 4.6 |
| On-trade | 1.1 | 1.1 | 0.0 | 1.1 | 1.3 | 3.4 | |
| Total | 5.5 | 5.1 | −1.5 | 5.4 | 6.3 | 4.3 | |
| Middle Eastern & Africa | Off-trade | 3.4 | 3.5 | 0.6 | 3.5 | 4.1 | 3.2 |
| On-trade | 3.7 | 3.3 | −2.3 | 3.4 | 4.1 | 4.4 | |
| Total | 7.1 | 6.8 | −0.9 | 6.9 | 8.2 | 3.8 | |
| North America | Off-trade | 15.2 | 26.6 | 11.8 | 26.9 | 27.6 | 0.7 |
| On-trade | 3.6 | 3.7 | 0.5 | 3.8 | 4.3 | 3.1 | |
| Total | 18.8 | 30.3 | 10.0 | 30.7 | 31.9 | 1.0 | |
| Western Europe | Off-trade | 92.5 | 99.6 | 1.5 | 100.3 | 93.4 | −1.3 |
| On-trade | 65.7 | 50.2 | −5.2 | 55.3 | 62.1 | 4.3 | |
| Total | 158.3 | 149.8 | −1.1 | 155.5 | 155.5 | 0.7 | |
|
Source: Euromonitor International, 2023 *CAGR: Compound Annual Growth Rate |
|||||||
In 2022, leading champagne markets registering the highest total on/off-trade sales were France at US$5.9 billion (92.3 million litres), Japan at US$2.5 billion (11.2 million litres), the United States at US$1.9 billion (28.9 million litres), Australia at US$1.4 billion (16.7 million litres), and the United Kingdom at US$1.3 billion (17 million litres). Canada was the 15th largest market in terms of value sales at US$173.4 million (1.4 million litres) in 2022.
Within the top 10 markets (including Canada), those countries with larger off-trade champagne sales were the US (off-trade share: 59.1%), Australia (53.6%), the UK (58.4%), Germany (57.5%), and Canada (80.7%). Alternatively, France (on-trade share: 68.4%), Japan (93%), the UAE (90.5%), Switzerland (78.2%), Italy (79.3%), and Belgium (53%) were regions that registered the highest sales within on-trade sales.
| Region | 2017 | 2022 | CAGR* % 2017-2022 | 2023 | 2027 | CAGR* % 2022-2027 | |
|---|---|---|---|---|---|---|---|
| World - champagne | Off-trade | 5,618.8 | 7,526.5 | 6.0 | 8,184.8 | 9,848.0 | 5.5 |
| On-trade | 12,029.1 | 12,383.4 | 0.6 | 14,293.3 | 20,185.1 | 10.3 | |
| Total | 17,647.8 | 19,909.9 | 2.4 | 22,478.1 | 30,033.2 | 8.6 | |
| 1. France | Off-trade | 1,616.4 | 1,862.7 | 2.9 | 2,008.9 | 1,914.4 | 0.5 |
| On-trade | 5,065.7 | 4,023.9 | −4.5 | 4,777.7 | 5,895.7 | 7.9 | |
| Total | 6,682.1 | 5,886.7 | −2.5 | 6,786.7 | 7,810.1 | 5.8 | |
| 2. Japan | Off-trade | 79.9 | 173.6 | 16.8 | 172.5 | 169.0 | −0.5 |
| On-trade | 1,774.0 | 2,321.4 | 5.5 | 2,456.7 | 2,694.0 | 3.0 | |
| Total | 1,853.9 | 2,495.0 | 6.1 | 2,629.2 | 2,862.9 | 2.8 | |
| 3. United States | Off-trade | 690.1 | 1,119.3 | 10.2 | 1,175.9 | 1,319.6 | 3.3 |
| On-trade | 632.2 | 775.2 | 4.2 | 847.8 | 1,051.1 | 6.3 | |
| Total | 1,322.4 | 1,894.5 | 7.5 | 2,023.7 | 2,370.7 | 4.6 | |
| 4. Australia | Off-trade | 502.7 | 739.7 | 8.0 | 801.4 | 898.2 | 4.0 |
| On-trade | 317.9 | 641.2 | 15.1 | 934.9 | 2,927.8 | 35.5 | |
| Total | 820.6 | 1,380.9 | 11.0 | 1,736.3 | 3,826.0 | 22.6 | |
| 5. United Kingdom | Off-trade | 631.3 | 730.8 | 3.0 | 776.5 | 895.1 | 4.1 |
| On-trade | 584.3 | 521.3 | −2.3 | 584.0 | 689.7 | 5.8 | |
| Total | 1,215.6 | 1,252.1 | 0.6 | 1,360.5 | 1,584.8 | 4.8 | |
| 6. United Arab Emirates | Off-trade | 55.9 | 59.7 | 1.3 | 64.3 | 78.6 | 5.7 |
| On-trade | 675.2 | 572.5 | −3.2 | 611.1 | 730.5 | 5.0 | |
| Total | 731.1 | 632.3 | −2.9 | 675.3 | 809.1 | 5.1 | |
| 7. Switzerland | Off-trade | 87.9 | 125.2 | 7.3 | 129.5 | 149.7 | 3.6 |
| On-trade | 376.4 | 448.0 | 3.5 | 482.9 | 562.0 | 4.6 | |
| Total | 464.3 | 573.2 | 4.3 | 612.4 | 711.7 | 4.4 | |
| 8. Italy | Off-trade | 87.7 | 114.4 | 5.5 | 125.4 | 155.6 | 6.3 |
| On-trade | 366.4 | 438.8 | 3.7 | 489.3 | 662.1 | 8.6 | |
| Total | 454.0 | 553.1 | 4.0 | 614.7 | 817.7 | 8.1 | |
| 9. Belgium | Off-trade | 187.4 | 203.8 | 1.7 | 220.2 | 256.1 | 4.7 |
| On-trade | 200.7 | 229.7 | 2.7 | 248.9 | 283.5 | 4.3 | |
| Total | 388.2 | 433.4 | 2.2 | 469.1 | 539.6 | 4.5 | |
| 10. Germany | Off-trade | 187.4 | 244.5 | 5.5 | 258.4 | 276.7 | 2.5 |
| On-trade | 227.9 | 180.9 | −4.5 | 244.6 | 233.4 | 5.2 | |
| Total | 415.3 | 425.4 | 0.5 | 502.9 | 510.1 | 3.7 | |
| Sub-total (top 10 markets) | Off-trade | 4,126.7 | 5,373.7 | 5.4 | 5,733.0 | 6,113.0 | 2.6 |
| On-trade | 10,220.7 | 10,152.9 | −0.1 | 11,677.9 | 15,729.8 | 9.2 | |
| Total | 14,347.5 | 15,526.6 | 1.6 | 17,410.8 | 21,842.7 | 7.1 | |
| Canada (15th) | Off-trade | 106.1 | 139.9 | 5.7 | 148.0 | 175.8 | 4.7 |
| On-trade | 37.2 | 33.5 | −2.1 | 39.2 | 60.8 | 12.7 | |
| Total | 143.3 | 173.4 | 3.9 | 187.2 | 236.6 | 6.4 | |
|
Source: Euromonitor International, 2023 *CAGR: Compound Annual Growth Rate |
|||||||
| Market | 2017 | 2022 | CAGR* % 2017-2022 | 2023 | 2027 | CAGR* % 2022-2027 | |
|---|---|---|---|---|---|---|---|
| World - champagne | Off-trade | 131.0 | 155.7 | 3.5 | 157.7 | 155.0 | −0.1 |
| On-trade | 88.9 | 75.4 | −3.2 | 82.6 | 99.6 | 5.7 | |
| Total | 219.9 | 231.1 | 1.0 | 240.3 | 254.6 | 2.0 | |
| 1. France | Off-trade | 56.7 | 60.6 | 1.3 | 61.5 | 52.6 | −2.8 |
| On-trade | 45.9 | 31.7 | −7.1 | 35.5 | 40.1 | 4.8 | |
| Total | 102.6 | 92.3 | −2.1 | 97.0 | 92.7 | 0.1 | |
| 2. Japan | Off-trade | 1.3 | 2.3 | 12.1 | 2.1 | 2.0 | −2.8 |
| On-trade | 7.9 | 8.9 | 2.4 | 9.2 | 9.8 | 1.9 | |
| Total | 9.2 | 11.2 | 4.0 | 11.3 | 11.8 | 1.0 | |
| 3. United States | Off-trade | 14.1 | 25.3 | 12.4 | 25.5 | 26.1 | 0.6 |
| On-trade | 3.4 | 3.5 | 0.6 | 3.7 | 4.1 | 3.2 | |
| Total | 17.6 | 28.9 | 10.4 | 29.2 | 30.2 | 0.9 | |
| 4. Australia | Off-trade | 8.1 | 12.2 | 8.5 | 12.9 | 13.6 | 2.2 |
| On-trade | 2.6 | 4.5 | 11.6 | 5.8 | 12.2 | 22.1 | |
| Total | 10.7 | 16.7 | 9.3 | 18.6 | 25.8 | 9.1 | |
| 5. United Kingdom | Off-trade | 13.7 | 13.2 | −0.7 | 12.8 | 13.3 | 0.2 |
| On-trade | 4.7 | 3.8 | −4.2 | 3.9 | 4.1 | 1.5 | |
| Total | 18.4 | 17.0 | −1.6 | 16.8 | 17.4 | 0.5 | |
| 6. United Arab Emirates | Off-trade | 0.5 | 0.5 | 0.0 | 0.5 | 0.6 | 3.7 |
| On-trade | 1.5 | 1.2 | −4.4 | 1.2 | 1.3 | 1.6 | |
| Total | 2.0 | 1.7 | −3.2 | 1.7 | 1.9 | 2.2 | |
| 7. Switzerland | Off-trade | 1.8 | 2.3 | 5.0 | 2.3 | 2.5 | 1.7 |
| On-trade | 2.7 | 3.0 | 2.1 | 3.1 | 3.4 | 2.5 | |
| Total | 4.4 | 5.3 | 3.8 | 5.5 | 6.0 | 2.5 | |
| 8. Italy | Off-trade | 2.1 | 2.4 | 2.7 | 2.4 | 2.7 | 2.4 |
| On-trade | 2.7 | 2.7 | 0.0 | 2.8 | 3.4 | 4.7 | |
| Total | 4.8 | 5.0 | 0.8 | 5.2 | 6.2 | 4.4 | |
| 9. Belgium | Off-trade | 6.4 | 6.6 | 0.6 | 6.6 | 6.9 | 0.9 |
| On-trade | 1.9 | 1.9 | 0.0 | 1.9 | 2.0 | 1.0 | |
| Total | 8.3 | 8.5 | 0.5 | 8.5 | 8.9 | 0.9 | |
| 10. Germany | Off-trade | 4.8 | 5.3 | 2.0 | 5.3 | 5.2 | −0.4 |
| On-trade | 2.5 | 1.8 | −6.4 | 2.4 | 2.6 | 7.6 | |
| Total | 7.3 | 7.1 | −0.6 | 7.7 | 7.8 | 1.9 | |
| Sub-total (top 10 markets) | Off-trade | 109.5 | 130.7 | 3.6 | 131.9 | 125.5 | −0.8 |
| On-trade | 75.8 | 63.0 | −3.6 | 69.5 | 83.0 | 5.7 | |
| Total | 185.3 | 193.7 | 0.9 | 201.5 | 208.7 | 1.5 | |
| Canada (15th in value) | Off-trade | 1.1 | 1.3 | 3.4 | 1.3 | 1.5 | 2.9 |
| On-trade | 0.2 | 0.1 | −12.9 | 0.2 | 0.2 | 14.9 | |
| Total | 1.2 | 1.4 | 3.1 | 1.5 | 1.7 | 4.0 | |
|
Source: Euromonitor International, 2023 *CAGR: Compound Annual Growth Rate |
|||||||
Competitive landscape - champagne in top markets
In 2022, globally the leading companies in the champagne category were LVMH Moët Hennessy Louis Vuitton SA (brands: Moët & Chandon, Veuve Clicquot - Brut, Dom Pérignon, Krug, Mercier, Ruinart) at a global market share of 32.3% (US$6.4 billion), Pernod Ricard Groupe (brands: Mumm, Perrier-Jouët) at 6.0% (US$1.2 billion), and Vranken-Pommery Monopole SA (brands: Vranken, Pommery) at a market share of 4.5% (US$903.7 million). Private labels throughout the world registered a market share of 4.1% (US$807.2 million) in 2022.
| Market | Company | Top brand(s) | Retail sales (US$M) | Market share in 2022 |
|---|---|---|---|---|
| France | Vranken-Pommery Monopole SA | Vranken, Pommery | 630.7 | 10.7 |
| Lanson-BCC SA | Lanson | 587.2 | 10.0 | |
| LVMH Moët Hennessy Louis Vuitton SA | Moët & Chandon, Veuve Clicquot… | 434.4 | 7.4 | |
| Total - Champagne in France | 5,886.7 | 100.0 | ||
| Japan | LVMH Moët Hennessy Louis Vuitton SA | Dom Pérignon, Krug, etc. | 1,198.1 | 48.0 |
| Pernod Ricard Groupe | Mumm, Perrier-Jouët | 111.0 | 4.5 | |
| Groupe Laurent-Perrier | Laurent-Perrier | 56.7 | 2.3 | |
| Total - Champagne in Japan | 2,495.0 | 100.0 | ||
| United States | LVMH Moët Hennessy Louis Vuitton SA | Veuve Clicquot, Moët & Chandon… | 728.7 | 38.5 |
| Pernod Ricard Groupe | Perrier-Jouët, Mumm | 76.2 | 4.0 | |
| Européenne de Participations Industrielles (EPI) SAS | Piper Heidsieck | 52.4 | 2.8 | |
| Total - Champagne in the United States | 1,894.5 | 100.0 | ||
| Australia | LVMH Moët Hennessy Louis Vuitton SA | Moët & Chandon, Veuve Clicquot… | 704.5 | 51.0 |
| Pernod Ricard Groupe | Mumm, Perrier-Jouët | 238.3 | 17.3 | |
| Européenne de Participations Industrielles (EPI) SAS | Charles Heidsieck, Piper Heidsieck | 197.4 | 14.3 | |
| Total - Champagne in Australia | 1,380.9 | 100.0 | ||
| United Kingdom | LVMH Moët Hennessy Louis Vuitton SA | Moët & Chandon, Veuve Clicquot | 278.2 | 22.2 |
| Lanson-BCC SA | Lanson | 129.5 | 10.3 | |
| Pernod Ricard Groupe | Mumm, Perrier-Jouët | 58.8 | 4.7 | |
| Private label | Private label | 254.0 | 20.3 | |
| Total - Champagne in the United Kingdom | 1,252.1 | 100.0 | ||
| United Arab Emirates | LVMH Moët Hennessy Louis Vuitton SA | 575.7 | 91.1 | |
| Total - Champagne in the United Arab Emirates | 632.3 | 100.0 | ||
| Switzerland | LVMH Moët Hennessy Louis Vuitton SA | Veuve Clicquot, Moët & Chandon, | 187.7 | 32.7 |
| Pernod Ricard Groupe | Perrier-Jouët, Mumm | 44.9 | 7.8 | |
| Vranken-Pommery Monopole SA | Pommery | 18.3 | 3.2 | |
| Private label | Private label | 64.8 | 11.3 | |
| Total - Champagne in Switzerland | 573.2 | 100.0 | ||
| Italy | LVMH Moët Hennessy Louis Vuitton SA | Moët & Chandon, Veuve Clicquot… | 255.8 | 46.3 |
| Pernod Ricard Groupe | Mumm, Perrier-Jouët | 74.7 | 13.5 | |
| Champagne Louis Roederer (CLR) SA | Louis Roederer, Deutz | 27.4 | 5.0 | |
| Total - Champagne in Italy | 553.1 | 100.0 | ||
| Belgium | Vranken-Pommery Monopole SA | Vranken, Pommery | 60.0 | 13.8 |
| Groupe Laurent-Perrier | Laurent-Perrier | 30.4 | 7.0 | |
| LVMH Moët Hennessy Louis Vuitton SA | Moët & Chandon, Veuve Clicquot… | 28.8 | 6.6 | |
| Private label | Private label | 37.9 | 8.7 | |
| Total - Champagne in Belgium | 433.4 | 100.0 | ||
| Germany | LVMH Moët Hennessy Louis Vuitton SA | Moët & Chandon, Ruinart etc. | 137.8 | 32.4 |
| Vranken-Pommery Monopole SA | Pommery, Heidsieck Monopole | 57.2 | 13.4 | |
| Européenne de Participations Industrielles (EPI) SAS | Piper Heidsieck | 47.1 | 11.1 | |
| Private label | Private label | 39.3 | 9.2 | |
| Total - Champagne in Germany | 425.4 | 100.0 | ||
| Source: Euromonitor International, 2023 | ||||
Non-grape wine
In 2022, total sales of non-grape wine was US$26.8 billion (2,909.3 million litres), which consisted of US$12.7 billion (2,328.9 million litres) in off-trade retail sales and US$14.1 billion (580.4 million litres) in on-trade sales. Both off-trade and on-trade sales declined by 1.5% and 3.6%, respectively between 2017 and 2022. However, on-trade of non-grape wine is forecast to turn around with a CAGR of 4.0% versus off-trade (0.6%) between 2022 and 2027.
The largest regions with the most total value of off/on-trade sales of non-grape wine were Asia Pacific (US$24.5 billion), Eastern Europe (US$940.7 million), Western Europe (US$641.1 million), and North America (US$533.1 million) in 2022. Top regions with the highest total historical growth (2017-2022) were Eastern Europe (CAGR:7.1%), followed by MENA (5.2%), and Latin America (3.9%); while Asia Pacific (−3.2%) and Australasia (−1.1%) have declined sales of non-grape wine during this period.
On-trade sales of non-grape wine, generally brought in the highest value over off-trade sales, within the following regions: Asia Pacific (on-trade share: 53.9%), Australasia (84.9%), Latin America (69.9%), MENA (86.4%), North America (76.1%), and Western Europe (51.8) in 2022. Alternatively, off-trade sales were overwhelmingly higher than on-trade sales within Eastern Europe at an off-trade market share of 94% in 2022.
| Region | 2017 | 2022 | CAGR* % 2017-2022 | 2023 | 2027 | CAGR* % 2022-2027 | |
|---|---|---|---|---|---|---|---|
| World (Total) | Off-trade | 13,652.8 | 12,661.7 | −1.5 | 12,901.8 | 13,056.0 | 0.6 |
| On-trade | 16,969.7 | 14,114.8 | −3.6 | 15,271.0 | 17,142.8 | 4.0 | |
| Total | 30,622.5 | 26,776.5 | −2.6 | 28,172.8 | 30,198.8 | 2.4 | |
| Asia Pacific | Off-trade | 12,655.0 | 11,290.1 | −2.3 | 11,377.0 | 10,977.6 | −0.6 |
| On-trade | 16,126.1 | 13,176.1 | −4.0 | 14,227.0 | 15,798.3 | 3.7 | |
| Total | 28,781.2 | 24,466.2 | −3.2 | 25,603.9 | 26,775.9 | 1.8 | |
| Australasia | Off-trade | 0.8 | 1.2 | 8.4 | 1.1 | 1.9 | 9.6 |
| On-trade | 6.9 | 6.2 | −2.1 | 7.5 | 11.2 | 12.6 | |
| Total | 7.7 | 7.3 | −1.1 | 8.6 | 13.2 | 12.6 | |
| Eastern Europe | Off-trade | 615.5 | 884.0 | 7.5 | 993.5 | 1,405.5 | 9.7 |
| On-trade | 53.0 | 56.6 | 1.3 | 64.6 | 90.2 | 9.8 | |
| Total | 668.5 | 940.7 | 7.1 | 1,058.1 | 1,495.7 | 9.7 | |
| Latin America | Off-trade | 41.0 | 43.8 | 1.3 | 46.8 | 59.1 | 6.2 |
| On-trade | 79.0 | 101.6 | 5.2 | 116.2 | 150.2 | 8.1 | |
| Total | 120.1 | 145.4 | 3.9 | 162.9 | 209.3 | 7.6 | |
| Middle Eastern and Africa | Off-trade | 3.7 | 5.8 | 9.4 | 6.6 | 9.9 | 11.3 |
| On-trade | 29.4 | 36.9 | 4.6 | 39.7 | 49.2 | 5.9 | |
| Total | 33.1 | 42.7 | 5.2 | 46.3 | 59.1 | 6.7 | |
| North America | Off-trade | 86.2 | 127.6 | 8.2 | 135.7 | 157.3 | 4.3 |
| On-trade | 374.9 | 405.5 | 1.6 | 455.8 | 622.0 | 8.9 | |
| Total | 461.0 | 533.1 | 2.9 | 591.5 | 779.3 | 7.9 | |
| Western Europe | Off-trade | 250.6 | 309.2 | 4.3 | 341.1 | 444.7 | 7.5 |
| On-trade | 300.4 | 331.9 | 2.0 | 360.3 | 421.6 | 4.9 | |
| Total | 550.9 | 641.1 | 3.1 | 701.4 | 866.3 | 6.2 | |
|
Source: Euromonitor International, 2023 *CAGR: Compound Annual Growth Rate 1: Non-grape wine may include apple wine, Bokbunjaju, Cheongju, Chinese and rice wine, (fortified) fruit wine : fruit and berry/herbal/honey based, dessert wine, sake, Takju, Yakju, yellow and other non-grape wine. |
|||||||
| Region | 2017 | 2022 | CAGR* % 2017-2022 | 2023 | 2027 | CAGR* % 2022-2027 | |
|---|---|---|---|---|---|---|---|
| World (Total) | Off-trade | 2,927.8 | 2,328.9 | −4.5 | 2,275.3 | 2,110.4 | −2.0 |
| On-trade | 827.3 | 580.4 | −6.8 | 606.2 | 625.1 | 1.5 | |
| Total | 3,755.1 | 2,909.3 | −5.0 | 2,881.5 | 2,735.5 | −1.2 | |
| Asia Pacific | Off-trade | 2,604.6 | 1,985.5 | −5.3 | 1,930.0 | 1,734.5 | −2.7 |
| On-trade | 763.8 | 523.8 | −7.3 | 547.4 | 561.8 | 1.4 | |
| Total | 3,368.4 | 2,509.3 | −5.7 | 2,477.5 | 2,296.3 | −1.8 | |
| Australasia | Off-trade | 0.0 | 0.0 | 0.0 | 0.0 | 0.0 | 0.0 |
| On-trade | 0.1 | 0.1 | 0.0 | 0.1 | 0.2 | 14.9 | |
| Total | 0.1 | 0.1 | 0.0 | 0.1 | 0.2 | 14.9 | |
| Eastern Europe | Off-trade | 244.9 | 260.0 | 1.2 | 261.4 | 288.2 | 2.1 |
| On-trade | 4.6 | 3.3 | −6.4 | 3.4 | 4.1 | 4.4 | |
| Total | 249.6 | 263.4 | 1.1 | 264.9 | 292.3 | 2.1 | |
| Latin America | Off-trade | 9.4 | 6.1 | −8.3 | 5.8 | 5.7 | −1.3 |
| On-trade | 3.5 | 3.2 | −1.8 | 3.4 | 3.6 | 2.4 | |
| Total | 12.9 | 9.3 | −6.3 | 9.2 | 9.3 | 0.0 | |
| Middle Eastern & Africa | Off-trade | 0.5 | 0.6 | 3.7 | 0.7 | 0.8 | 5.9 |
| On-trade | 0.7 | 0.7 | 0.0 | 0.7 | 0.8 | 2.7 | |
| Total | 1.1 | 1.3 | 3.4 | 1.4 | 1.6 | 4.2 | |
| North America | Off-trade | 6.6 | 8.0 | 3.9 | 8.2 | 8.5 | 1.2 |
| On-trade | 22.7 | 17.5 | −5.1 | 18.7 | 20.4 | 3.1 | |
| Total | 29.3 | 25.6 | −2.7 | 26.8 | 28.8 | 2.4 | |
| Western Europe | Off-trade | 61.8 | 68.6 | 2.1 | 69.2 | 72.7 | 1.2 |
| On-trade | 32.0 | 31.7 | −0.2 | 32.5 | 34.3 | 1.6 | |
| Total | 93.8 | 100.3 | 1.3 | 101.6 | 107.0 | 1.3 | |
|
Source: Euromonitor International, 2023 *CAGR: Compound Annual Growth Rate 1: Non-grape wine may include apple wine, Bokbunjaju, Cheongju, Chinese and rice wine, (fortified) fruit wine : fruit and berry/herbal/honey based, dessert wine, sake, Takju, Yakju, yellow and other non-grape wine. |
|||||||
In 2022, leading non-grape wine markets throughout the world that registered the highest total on/off-trade sales were China (rice wine, sake) at US$16.9 billion (1,673.6 million litres), Japan (Chinese wine, fruit wine, sake, other) at US$5.7 billion (405.3 million litres), South Korea (Bokbunjaju, Cheongju, sake, Takju) at US$1.3 billion (389.1 million litres), United States (rice wine) at US$498.4 million (24.3 million litres), and Russia (apple wine, other) at US$445.0 million (100.3 million litres). Canada (sake, other) was the 19th largest market in terms of value sales at US$34.7 million (1.3 million litres) in 2022.
Within the top 10 markets (including Canada), those countries with larger on-trade non-grape wine sales were China (on-trade share: 54.1%), Japan (51.9%), South Korea (61%), United States (78.8%), Germany (61.8%), and Taiwan (63.7%). Alternatively, Russia (off-trade share: 97.4%), Poland (97%), Indonesia (83.3%), Belarus - modelled (99.8%), and Canada (62.8%) were regions that registered the highest sales within off-trade sales.
| Market (category) | 2017 | 2022 | CAGR* % 2017-2022 | 2023 | 2027 | CAGR* % 2022-2027 | |
|---|---|---|---|---|---|---|---|
| World - non-grape wine | Off-trade | 13,652.8 | 12,661.7 | −1.5 | 12,901.8 | 13,056.0 | 0.6 |
| On-trade | 16,969.7 | 14,114.8 | −3.6 | 15,271.0 | 17,142.8 | 4.0 | |
| Total | 30,622.5 | 26,776.5 | −2.6 | 28,172.8 | 30,198.8 | 2.4 | |
| 1. China (rice wine, sake) | Off-trade | 9,178.0 | 7,741.1 | −3.3 | 7,736.1 | 7,173.1 | −1.5 |
| On-trade | 9,987.9 | 9,122.4 | −1.8 | 9,628.9 | 10,451.5 | 2.8 | |
| Total | 19,165.9 | 16,863.5 | −2.5 | 17,365.0 | 17,624.6 | 0.9 | |
| 2. Japan (Chinese, fruit, sake, other) | Off-trade | 2,918.4 | 2,759.4 | −1.1 | 2,758.0 | 2,591.8 | −1.2 |
| On-trade | 5,201.2 | 2,979.5 | −10.5 | 3,278.8 | 3,405.4 | 2.7 | |
| Total | 8,119.6 | 5,738.9 | −6.7 | 6,036.9 | 5,997.2 | 0.9 | |
| 3. South Korea (Bokbunjaju, Cheongju, sake, takju) | Off-trade | 408.8 | 525.3 | 5.1 | 567.1 | 664.7 | 4.8 |
| On-trade | 711.3 | 822.9 | 3.0 | 1,028.5 | 1,476.7 | 12.4 | |
| Total | 1,120.1 | 1,348.2 | 3.8 | 1,595.5 | 2,141.4 | 9.7 | |
| 4. United States (rice) | Off-trade | 71.9 | 105.8 | 8.0 | 112.2 | 128.2 | 3.9 |
| On-trade | 362.2 | 392.6 | 1.6 | 441.0 | 599.4 | 8.8 | |
| Total | 434.1 | 498.4 | 2.8 | 553.2 | 727.6 | 7.9 | |
| 5. Russia (apple, other) | Off-trade | 309.3 | 433.5 | 7.0 | 446.4 | 555.4 | 5.1 |
| On-trade | 13.9 | 11.4 | −3.9 | 10.7 | 12.8 | 2.3 | |
| Total | 323.2 | 445.0 | 6.6 | 457.1 | 568.1 | 5.0 | |
| 6. Germany (apple, other) | Off-trade | 106.0 | 135.5 | 5.0 | 142.4 | 162.1 | 3.6 |
| On-trade | 193.4 | 219.6 | 2.6 | 226.9 | 250.3 | 2.7 | |
| Total | 299.4 | 355.1 | 3.5 | 369.3 | 412.4 | 3.0 | |
| 7. Poland (dessert, other) | Off-trade | 133.4 | 182.9 | 6.5 | 211.1 | 273.3 | 8.4 |
| On-trade | 7.6 | 5.6 | −5.9 | 7.1 | 12.5 | 17.4 | |
| Total | 141.1 | 188.6 | 6.0 | 218.2 | 285.7 | 8.7 | |
| 8. Indonesia (fruit and herbal, sake) | Off-trade | 54.2 | 138.5 | 20.6 | 173.7 | 349.9 | 20.4 |
| On-trade | 16.2 | 27.7 | 11.3 | 36.1 | 98.2 | 28.8 | |
| Total | 70.4 | 166.2 | 18.7 | 209.9 | 448.1 | 21.9 | |
| 9. Belarus - modelled (non-grape) | Off-trade | 114.7 | 128.6 | 2.3 | 144.0 | 188.1 | 7.9 |
| On-trade | 0.2 | 0.2 | 0.0 | 0.2 | 0.3 | 8.4 | |
| Total | 114.9 | 128.8 | 2.3 | 144.2 | 188.4 | 7.9 | |
| 10. Taiwan (sake, other) | Off-trade | 47.0 | 43.8 | −1.4 | 44.6 | 46.4 | 1.2 |
| On-trade | 78.4 | 77.1 | −0.3 | 81.2 | 92.5 | 3.7 | |
| Total | 125.5 | 121.0 | −0.7 | 125.7 | 138.9 | 2.8 | |
| Sub-total (top 10 markets) | Off-trade | 13,341.7 | 12,194.4 | −1.8 | 12,335.6 | 12,133.0 | −0.1 |
| On-trade | 16,572.3 | 13,659.0 | −3.8 | 14,739.4 | 16,399.6 | 3.7 | |
| Total | 29,914.2 | 25,853.7 | −2.9 | 27,075.0 | 28,532.4 | 2.0 | |
| Canada (19th) - (sake, other) | Off-trade | 14.3 | 21.8 | 8.8 | 23.5 | 29.2 | 6.0 |
| On-trade | 12.6 | 12.9 | 0.5 | 14.8 | 22.6 | 11.9 | |
| Total | 26.9 | 34.7 | 5.2 | 38.3 | 51.8 | 8.3 | |
|
Source: Euromonitor International, 2023 *CAGR: Compound Annual Growth Rate |
|||||||
| Market (category) | 2017 | 2022 | CAGR* % 2017-2022 | 2023 | 2027 | CAGR* % 2022-2027 | |
|---|---|---|---|---|---|---|---|
| World - non-grape wine | Off-trade | 2,927.8 | 2,328.9 | −4.5 | 2,275.3 | 2,110.4 | −2.0 |
| On-trade | 827.3 | 580.4 | −6.8 | 606.2 | 625.1 | 1.5 | |
| Total | 3,755.1 | 2,909.3 | −5.0 | 2,881.5 | 2,735.5 | −1.2 | |
| 1. China (rice wine, sake) | Off-trade | 1,971.4 | 1,357.9 | −7.2 | 1,308.4 | 1,105.6 | −4.0 |
| On-trade | 440.1 | 315.7 | −6.4 | 314.6 | 291.0 | −1.6 | |
| Total | 2,411.5 | 1,673.6 | −7.0 | 1,623.0 | 1,396.6 | −3.6 | |
| 2. Japan (fruit, sake, other) | Off-trade | 339.7 | 304.3 | −2.2 | 289.8 | 260.2 | −3.1 |
| On-trade | 183.9 | 101.0 | −11.3 | 108.5 | 110.1 | 1.7 | |
| Total | 523.6 | 405.3 | −5.0 | 398.3 | 370.3 | −1.8 | |
| 3. South Korea (Bokbunjaju, Cheongju, sake, takju) | Off-trade | 270.4 | 291.3 | 1.5 | 295.1 | 308.7 | 1.2 |
| On-trade | 129.8 | 97.7 | −5.5 | 113.6 | 145.4 | 8.3 | |
| Total | 400.2 | 389.1 | −0.6 | 408.7 | 454.1 | 3.1 | |
| 4. United States (rice) | Off-trade | 5.9 | 7.1 | 3.8 | 7.2 | 7.3 | 0.6 |
| On-trade | 22.3 | 17.2 | −5.1 | 18.3 | 19.8 | 2.9 | |
| Total | 28.2 | 24.3 | −2.9 | 25.5 | 27.2 | 2.3 | |
| 5. Russia (apple, other) | Off-trade | 96.9 | 99.2 | 0.5 | 92.8 | 92.6 | −1.4 |
| On-trade | 1.7 | 1.0 | −10.1 | 0.9 | 0.8 | −4.4 | |
| Total | 98.6 | 100.3 | 0.3 | 93.6 | 93.5 | −1.4 | |
| 6. Germany (apple, other) | Off-trade | 42.3 | 47.6 | 2.4 | 48.1 | 49.9 | 0.9 |
| On-trade | 25.6 | 26.0 | 0.3 | 26.3 | 27.0 | 0.8 | |
| Total | 67.9 | 73.5 | 1.6 | 74.4 | 77.0 | 0.9 | |
| 7. Poland (dessert, other) | Off-trade | 74.4 | 90.8 | 4.1 | 94.3 | 104.3 | 2.8 |
| On-trade | 0.5 | 0.3 | −9.7 | 0.3 | 0.4 | 5.9 | |
| Total | 74.8 | 91.0 | 4.0 | 94.6 | 104.8 | 2.9 | |
| 8. Indonesia (fruit and herbal, sake) | Off-trade | 9.2 | 19.5 | 16.2 | 23.9 | 46.4 | 18.9 |
| On-trade | 1.6 | 2.2 | 6.6 | 2.8 | 6.2 | 23.0 | |
| Total | 10.7 | 21.7 | 15.2 | 26.8 | 52.6 | 19.4 | |
| 9. Belarus - modelled (non-grape) | Off-trade | 56.7 | 43.4 | −5.2 | 42.4 | 40.5 | −1.4 |
| On-trade | 0.1 | 0.1 | 0.0 | 0.1 | 0.0 | −100.0 | |
| Total | 56.8 | 43.4 | −5.2 | 42.5 | 40.6 | −1.3 | |
| 10. Taiwan (sake, other) | Off-trade | 4.5 | 4.0 | −2.3 | 4.2 | 4.6 | 2.8 |
| On-trade | 2.5 | 2.3 | −1.7 | 2.4 | 2.7 | 3.3 | |
| Total | 7.0 | 6.3 | −2.1 | 6.5 | 7.3 | 3.0 | |
| Sub-total (top 10 markets) | Off-trade | 2,871.4 | 2,265.1 | −4.6 | 2,206.2 | 2,020.1 | −2.3 |
| On-trade | 808.1 | 563.5 | −7.0 | 587.8 | 603.4 | 1.4 | |
| Total | 3,679.3 | 2,828.5 | −5.1 | 2,793.9 | 2,624.0 | −1.5 | |
| Canada (19th in value) - (sake, other) | Off-trade | 0.7 | 0.9 | 5.2 | 1.0 | 1.1 | 4.1 |
| On-trade | 0.3 | 0.3 | 0.0 | 0.4 | 0.5 | 10.8 | |
| Total | 1.0 | 1.3 | 5.4 | 1.3 | 1.7 | 5.5 | |
|
Source: Euromonitor International, 2023 *CAGR: Compound Annual Growth Rate |
|||||||
Competitive landscape - non-grape wine
In 2022, the leading global companies in the non-grape wine category were Zhejiang Guyue Longshan Shaoxing Wine Co Ltd. (brands: Guyue Longshan, Nv Er Hong, Shenyonghe) at a total market share of 9% (US$2.4 billion), Kuai Ji Shan Shaoxing Wine Co Ltd. (brands: Kuai Ji Shan, Wuzhanmao, Xitang, Tangsong) at 4.5% (US$1.2 billion), and Takara Holdings Inc. (brands: Sho Chiku Bai, Takara) at a market share of 3% (US$795.8 million). Private labels registered total non-grape wine sales of US$8.2 million in 2022.
| Market | Company | Top brand(s) | Retail sales (US$M) | Market share in 2022 |
|---|---|---|---|---|
| China | Zhejiang Guyue Longshan Shaoxing Wine Co Ltd. | Guyue Longshan, Nv Er Hong, Shenyonghe | 2,388.9 | 14.2 |
| Kuai Ji Shan Shaoxing Wine Co Ltd. | Kuai Ji Shan, Wuzhanmao, Xitang… | 1,191.1 | 7.1 | |
| Jiangsu Zhangjiagang Brewery Co Ltd. | Sha Zhou You Huang | 570.6 | 3.4 | |
| Total - Non-grape wine in China | 16,863.5 | 100.0 | ||
| Japan | Takara Holdings Inc. | Sho Chiku Bai, Takara | 651.4 | 11.4 |
| Hakutsuru Sake Brewing Co Ltd. | Hakutsuru | 598.4 | 10.4 | |
| Gekkeikan Sake Co Ltd. | Gekkeikan | 444.3 | 7.7 | |
| Total - Non-grape wine in Japan | 5,738.9 | 100.0 | ||
| South Korea | Seoul Takju Association | Jangsu Makkeoli | 273.1 | 20.3 |
| Lotte Group | Baekwhasoobok, Chungha | 215.2 | 16.0 | |
| Kooksoondang Brewery Co Ltd. | Saeng Makkeoli, Bekseju, Probiotics Makgeolli | 90.8 | 6.7 | |
| Total - Non-grape wine in South Korea | 1,348.2 | 100.0 | ||
| United States | Takara Holdings Inc. | Takara | 143.7 | 28.8 |
| Gekkeikan Sake Co Ltd. | Gekkeikan | 102.7 | 20.6 | |
| Ozeki Co Ltd. | Ozeki | 67.2 | 13.5 | |
| Total - Non-grape wine in the United States | 498.4 | 100.0 | ||
| Russia | Vino Župa ad | Vino Zupa | 25.5 | 5.7 |
| Ishimsky VVZ OOO | Teshin Pogrebok | 15.0 | 3.4 | |
| Katlenburger Kellerei Dr Demuth GmbH & Co KG | Dr Demuth | 9.0 | 2.0 | |
| Total - Non-grape wine in Russia | 445.0 | 100.0 | ||
| Germany | Rapp's Kelterei GmbH | Höhl | 56.4 | 15.9 |
| Kelterei Possmann GmbH & Co KG | Possmann | 41.8 | 11.8 | |
| Katlenburger Kellerei Dr Demuth GmbH & Co KG | Katlenburger | 33.5 | 9.4 | |
| Private label | Private label | 7.6 | 2.1 | |
| Total - Non-grape wine in Germany | 355.1 | 100.0 | ||
| Poland | JNT Group SA SpK | Aronica, Manhattan Cherry | 45.7 | 24.2 |
| Bartex-Bartol Sp zoo Sp k | Bacchus, Edelkirsch, Sama Natura… | 40.4 | 21.4 | |
| Warwin SA | WebWarka Perry Premium Cider | 21.4 | 11.3 | |
| Total -Non-grape winein Poland | 188.6 | 100.0 | ||
| Indonesia | Perindustrian Bapak Djenggot PT | Orang Tua | 142.7 | 85.9 |
| Total - Non-grape wine in Indonesia | 166.2 | 100.0 | ||
| Belarus | Total - Non-grape wine in Belarus (modelled) | 128.8 | 100.0 | |
| Taiwan | Taiwan Tobacco & Liquor Corporation | Yu Chuan | 50.6 | 41.8 |
| Gekkeikan Sake Co Ltd. | Gekkeikan | 9.0 | 7.4 | |
| Ozeki Co Ltd. | Ozeki | 7.0 | 5.7 | |
| Total - Non-grape wine in Taiwan | 121.0 | 100.0 | ||
| Source: Euromonitor International, 2023 | ||||
New product launches across the world
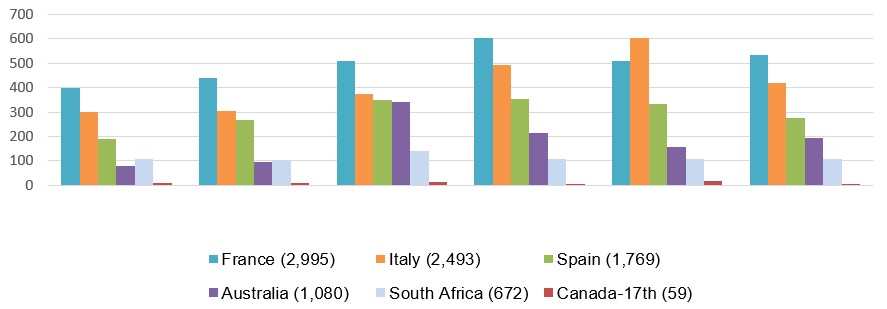
Mintel indicated that there were 17,448 new wine drink products launched globally across grocery retailer outlets (including new variety/range extension, packaging, formulation or relaunched) between the period of January 2018 and October 16, 2023. Leading markets launching the most wine products were France (17.2%), Italy (14.3%), Spain (10.1%), Australia (6.2%), South Africa (3.9%), with Canada being the 17th largest market (0.3%) over this period.
France manufactured and introduced as many as 354 brand new products between January-October 16, 2023. Italy released 258 brand new products during this period, followed by Spain (154), Australia (80), New Zealand (31) with South Africa falling behind as the 8th largest market to introduce 27 new products. Canada released two new products in 2023, including a hydromel honey wine by Miel Nature (manufacturer: Vetrerie Venete, brand: Chou-Chou, not imported), as well as an iced tea flavoured alcoholic malt beverage by St-Loup & Cie (brand: Pepito, market: Cameroon - imported product).
Description of above image
| Country | 2018 | 2019 | 2020 | 2021 | 2022 | 2023 | Total |
|---|---|---|---|---|---|---|---|
| France | 399 | 441 | 509 | 603 | 511 | 532 | 2,995 |
| Italy | 302 | 303 | 372 | 491 | 605 | 420 | 2,493 |
| Spain | 191 | 267 | 348 | 352 | 334 | 277 | 1,769 |
| Australia | 80 | 94 | 341 | 214 | 156 | 195 | 1,080 |
| South Africa | 106 | 103 | 140 | 108 | 109 | 106 | 672 |
| Canada - 17th | 8 | 9 | 15 | 7 | 16 | 4 | 59 |
Source: Mintel, 2023
Innovative launches in the 2023/2022 review period, include the world's first 'Nàdar Climate-Positive Gin' that uses peas for the base spirit, said to be more sustainable than wheat-based spirits (Germany). Japan's 'Satsuma Tsukasa Shochu' is made with the Anno Imo variety of sweet potato. South Africa has introduced an authentically handmade craft gin from Cape Town (Ugly Gin Grapefruit & Goji Gin) where the brand claims that 'you're paying for the liquid, not everything else.' Other innovative launches include the 'Fornum & Mason of Oolong WuYi Tea Vodka' said to be the first spirit of its kind in the world using highly prized tea (UK), a 'Greater Than No Sleep Gin Coffee Infused Gin' made in collaboration with Sleepy Owl Coffee using Arabica beans with notes of red cherries, salted caramel and hints of peppercorn (India). Lastly, is a 'Rio Lightly Desert Cactus Flavoured Sugar Free Hard Seltzer' that China launched as one of its first hard seltzer range.Footnote 5
Leading global companies launching wine drink products (3,579) between Q4-2022 and Q4-2023 were Aldi Group (33), Marks & Spencer (33), Bacardi & Company (31), Pernod Ricard (26), Suntory (24), and Coles Group (23). Top brands over the 5-year period were Somersby (90), Martini (69), Kirkland Signature (44), M&S (38), Freixenet (38), Aldi (32),Metaxa (32), Barefoot (31), Martini L'Aperitivo (31), and Chandon (30). New brands appearing for the first time and launched within the last 6 months, included Woolworths Cape (sweet rosé) in South Africa, Vuur (green apple and strawberry non-wine aperitif) in Colombia, Nozeco Zero (orange Mimosa) in Australia and Dubourdieu (2021 pure Sauvignon blanc Bordeaux white wine) in the United States.
Top categories for wine types were available as hot beverage products (+66.7%), while declining categories were sports & energy drinks (−100%), carbonated soft drinks (−62.5%), juice drinks (−50%), and alcoholic beverages (−0.5%) between Q4-2022 and Q4-2023. New wine ingredients appearing within the last 12 months included light beer, natural Elderberry flavour, acerola powder, watermelon flavour, banana extract, artificial raspberry flavour, alpha-amylase, shine Muscat (extract), and passion fruit syrup. The fastest growing flavours in these products were passion fruit/Maracuja (+400%), berry (+300%), white peach or citrus (each by +200%), and sangria or ginger (each by +100%) between Q3-2022 and Q3-2023.
Top claims and claim combinations used most often in the last three months for wine product launches included environmentally friendly package (16.3%), ethical - recycling (14.6%), vegan/no animal ingredients (14.1%), environmental friendly products (13.9%), ethical - sustainable habitat/resources (13.4%), social media (8.4%), organic (7.1%), and premium (6%). Top growing wine claims were convenient packaging (+300%), diet/light (+300%), on-the-go (+250%), antioxidant (+125%), and time/speed (+100%) between Q3-2022 and Q3-2023. Meanwhile during the same period, declining claims by −100% were dairy free, functional - weight & muscle gain, Halal, economy, and vitamin/mineral fortified. Also, between this period top packaging types or material combinations were flexible (+14.3%), glass coloured bottle (+9.3%), plain glass bottle (−5.4%), and metal aluminum can (−33.8%).
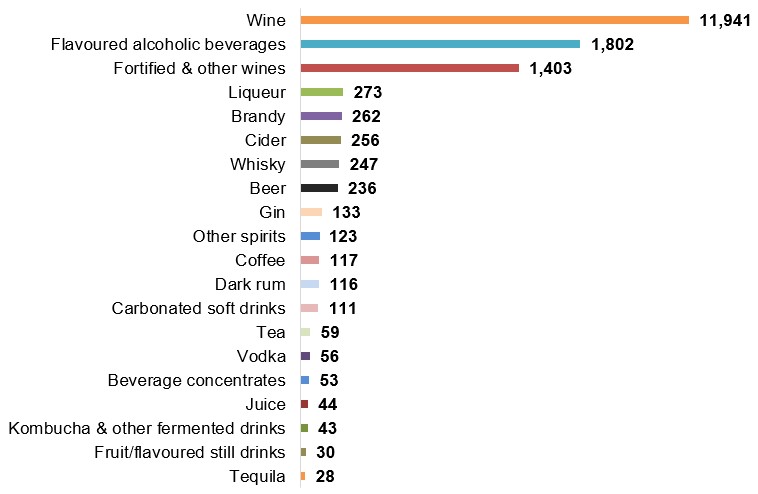
Top sub-categories out of 17,448 wine products were wine itself (68.4%), followed by flavoured alcoholic beverages (10.3%), fortified & other wines (8%), liqueur (1.6%), brandy (1.5%), cider (1.5%), whisky (1.4%), beer (1.4%), gin (0.8%), and other spirits (0.7%). Ran separately, there were 636 new champagne products launched between January 2018 and October 17, 2023.
Description of above image
- Wine: 11,941
- Flavoured alcoholic beverages: 1,802
- Fortified and other wines: 1,403
- Liqueur: 273
- Brandy: 262
- Cider: 256
- Whisky: 247
- Beer: 236
- Gin: 133
- Other spirits: 123
- Coffee: 117
- Dark rum: 116
- Carbonated soft drinks: 111
- Tea: 59
- Vodka: 56
- Beverage concentrates: 53
- Juice: 44
- Kombucha and other fermented drinks: 43
- Fruit/flavoured still drinks: 30
- Tequila: 28
Total item count: 17,448
Source: Mintel, 2023
| Product attributes | Yearly launch - item count | ||||||
|---|---|---|---|---|---|---|---|
| 2018 | 2019 | 2020 | 2021 | 2022 | 2023 | Total | |
| Yearly product launches | 2,380 | 2,392 | 3,256 | 3,463 | 3,260 | 2,683 | 17,434 |
| Top launch types | |||||||
| New product | 1,156 | 1,203 | 1,705 | 1,803 | 1,666 | 1,412 | 8,945 |
| New variety/range extension | 773 | 753 | 1,048 | 1,055 | 995 | 795 | 5,419 |
| New packaging | 391 | 367 | 449 | 537 | 531 | 424 | 2,699 |
| Relaunch | 54 | 65 | 53 | 66 | 66 | 50 | 354 |
| New formulation | 6 | 4 | 1 | 2 | 2 | 2 | 17 |
| Top sub-categories | |||||||
| Wine | 1,617 | 1,587 | 2,303 | 2,400 | 2,144 | 1,890 | 11,941 |
| Flavoured alcoholic beverages | 243 | 282 | 328 | 366 | 308 | 275 | 1,802 |
| Fortified & other wines | 235 | 174 | 250 | 275 | 295 | 174 | 1,403 |
| Liqueur | 29 | 31 | 52 | 50 | 81 | 30 | 273 |
| Brandy | 28 | 39 | 38 | 63 | 58 | 36 | 262 |
| Top five companies / parent | |||||||
| Aldi (Süd) | 35 | 37 | 113 | 48 | 33 | 21 | 287 |
| Martini & Rossi | 16 | 23 | 37 | 25 | 17 | 14 | 132 |
| Lidl | 17 | 22 | 30 | 20 | 22 | 19 | 130 |
| Pinnacle Drinks | 0 | 8 | 41 | 24 | 16 | 18 | 107 |
| Takara Shuzo | 28 | 30 | 30 | 7 | 11 | 0 | 106 |
| Top five brands | |||||||
| Somersby | 3 | 24 | 28 | 11 | 14 | 10 | 90 |
| Martini | 15 | 18 | 26 | 4 | 4 | 2 | 69 |
| Kirkland Signature | 7 | 1 | 7 | 12 | 13 | 4 | 44 |
| M&S | 1 | 3 | 4 | 7 | 15 | 8 | 38 |
| Freixenet | 6 | 7 | 11 | 4 | 5 | 5 | 38 |
| Import status (if reported) | |||||||
| Not imported | 765 | 907 | 1,385 | 1,393 | 1,347 | 1,222 | 7,019 |
| Imported | 801 | 776 | 970 | 1,122 | 1,073 | 865 | 5,607 |
| Location of manufacture | |||||||
| France | 399 | 441 | 509 | 603 | 511 | 529 | 2,992 |
| Italy | 302 | 303 | 372 | 491 | 605 | 419 | 2,492 |
| Spain | 191 | 267 | 348 | 352 | 334 | 274 | 1,766 |
| Australia | 80 | 94 | 341 | 214 | 156 | 194 | 1,079 |
| South Africa | 106 | 103 | 140 | 108 | 109 | 106 | 672 |
| Canada (17) | 8 | 9 | 15 | 7 | 16 | 4 | 59 |
| Top five flavours (including blend) | |||||||
| Unflavoured/plain | 1,952 | 1,890 | 2,664 | 2,818 | 2,621 | 2,217 | 14,162 |
| Wine | 1 | 15 | 52 | 48 | 48 | 41 | 205 |
| Sangria | 12 | 25 | 39 | 56 | 30 | 30 | 192 |
| Strawberry | 25 | 33 | 39 | 35 | 29 | 24 | 185 |
| Peach | 30 | 28 | 28 | 37 | 38 | 23 | 184 |
| Top package types | |||||||
| Bottle | 2,026 | 2,046 | 2,828 | 3,106 | 2,901 | 2,414 | 15,321 |
| Can | 183 | 185 | 220 | 165 | 193 | 173 | 1,119 |
| Flexible (stand-up pouch/sachet/stick pack) | 111 | 86 | 134 | 124 | 84 | 69 | 608 |
| Carton | 42 | 59 | 50 | 47 | 57 | 16 | 271 |
| Jar | 7 | 4 | 6 | 9 | 8 | 0 | 34 |
| Source: Mintel; Global New Product Database, 2023 | |||||||
Examples of new products
Rosé Semi-Dry Sparkling Wine

Source: Mintel, 2023
| Company / manufacturer | Arthur Metz |
|---|---|
| Brand | Arthur Metz Ice |
| Sub-category | Wine |
| Market | Manufactured in France, not imported |
| Packaging details | Plain glass bottle, cork, stopper has twist-off metal cover |
| Product analysis | Shelf stable, 1.5 litres, 11.5% alcohol by volume, carbonated (fizzy/sparkling/bubbly), branded |
| Store name / location | Cora, Dorlisheim 67129 |
| Store type | Mass merchandise / hypermarket |
| Date published | October 2023 |
| Launch type | New product |
| Price in US dollars | 22.42 |
Retails in a 1.5 litre bottle. Made especially for festive and convivial moments with family and friends. Fresh and lingering notes of red berries. To be consumed in a large wine glass on crushed ice. Logos and certifications: QR code, Appellation d'Origine Protégée (Protected Designation of Origin).
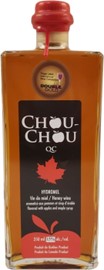
Hydromel Honey Wine
Source: Mintel, 2023
| Company / manufacturer | Miel Nature/Vetrerie Venete |
|---|---|
| Brand | Chou-Chou |
| Category | Alcoholic beverage, fortified and other wines |
| Market | Manufactured in Canada, not imported |
| Packaging details | Plain glass bottle, stopper |
| Product analysis | Shelf stable, 350 millilitres, 15% alcohol by Volume, branded, honey flavoured |
| Store name / location | Société de alcools du Québec (SAQ) Montréal-Sherbrooke Est H1N 3W1 |
| Store type | Specialist retailer |
| Date published | August 2023 |
| Launch type | New product |
| Price in US dollars | 15.09 / Can$20.00 |
This product retails in a 350 millilitre pack. Flavoured with apples and maple syrup. This mead is developed in a traditional Breton way with a touch from Quebec. Logos and certifications: Finger Lakes International Wine Competition Double Gold award.
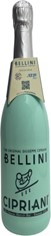
Bellini Aromatised Wine Product Cocktail with White Peach Pulp
Source: Mintel, 2023
| Company / manufacturer | Bicobi |
|---|---|
| Brand | Cipriani |
| Category | Flavoured alcoholic beverages |
| Market | Switzerland, manufactured in Italy |
| Packaging details | Coloured glass bottle |
| Product analysis | Shelf stable, 750 millilitres, 5.5% alcohol by volume, pureed/mushy/with pulp, branded |
| Store name / location | Co-op, Pfäffikon 8808 |
| Store type | Supermarket |
| Date published | August 2023 |
| Launch type | New product |
| Price in US dollars | 18.33 |
This product retails in a 750 millilitre pack. The Bellini's original recipe, prepared at Harry's Bar in Venice, is a balanced blend of DOC Prosecco wine and 20% Mediterranean white peach. Balance of fruity and dry taste, intensity and freshness. Contains sulphites. Official drink of the ATP 250. Logos and certifications: QR code, Kosher.
Adelaide Hills Crushed Apple Cider
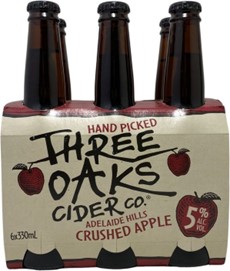
Source: Mintel, 2023
| Company / manufacturer | Vok Beverages |
|---|---|
| Importer | The Moose |
| Brand | Three Oaks Cider Co. |
| Category | Alcoholic beverages, cider |
| Market | Singapore, manufactured in Australia |
| Packaging details | Glass coloured bottle + sleeve, packaging manufacturer: Owens-Illinois |
| Product analysis | Shelf stable, 330 millilitres, 5% alcohol by volume, branded |
| Claims | Gluten free, low/no/reduced allergen, ethical – environmentally friendly package, ethical – recycling |
| Store name / location | Giant, Singapore 650376 |
| Store type | Mass merchandise/hypermarket |
| Date published | February 2023 |
| Launch type | New product |
| Price in US dollars | 18.29 |
This product retails in a pack containing six 330ml units. Hand-picked. Gluten free. Preservatives (202, 220) added. Crafted with fresh apples sourced from Adelaide Hills, South Australia. A fresh, crisp cider displaying a rounded palate and balanced sweetness. Recyclable bottle.
Brut Cava Sparkling Wine
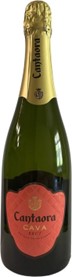
Source: Mintel, 2023
| Company / manufacturer | Wineforces/Licores Almendralejo |
|---|---|
| Importer | Saranty Imports |
| Brand | Cantaora |
| Category | Alcoholic beverages, wine |
| Market | United States, manufactured in Spain |
| Packaging details | Coloured glass bottle, cork, foil overwraps |
| Product analysis | Shelf stable, 750 millilitres, 11.5% alcohol by volume, carbonated (fizzy/sparkling/bubbly), branded |
| Store name / location | Total Wine & More, Woodlands 77380 |
| Store type | Specialist retailer |
| Date published | May 2023 |
| Launch type | New product |
| Price in US dollars | 9.99 |
This product retails in a 750 millilitre pack. Traditional method. Lemon and cider aromas that are solid and draw in. Fresh, clean feel on palate. Lively, tangy flavours of citrus, green fruits and green herbs. Zesty, a bit lemony, and balanced finish.
Pétillant Nectar Blanc Sparkling Wine
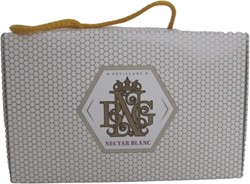
Source: Mintel, 2023
| Company / manufacturer | House of BNG |
|---|---|
| Brand | BNG |
| Category | Alcoholic beverages, wine |
| Market | South Africa, not imported |
| Packaging details | Metal aluminium can, ring-pull |
| Product analysis | Shelf stable, 250 millilitres, 10.5% alcohol by volume, carbonated (fizzy/sparkling/ bubbly), branded Claims: Ease of use, social media |
| Claims | Ease of use, social media |
| Store name / location | Woolworths, Benoni 1501 |
| Store type | Supermarket |
| Date published | May 2023 |
| Launch type | New product |
| Price in US dollars | 10.86 |
This product retails in a pack containing four 250 millilitre cans. A luxurious, convenient, single-serve bubbly for all kinds of celebrations. Logos and certification: Facebook, Instagram, Twitter
Brut Champagne
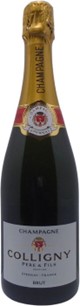
Source: Mintel, 2023
| Company / manufacturer | Maison Burtin |
|---|---|
| Importer | Saranty Imports |
| Brand | Colligny |
| Category | Alcoholic beverages, wine |
| Market | United States, manufactured in France |
| Packaging details | Glass coloured bottle, cork packaging manufacturer: Owens-Illinois |
| Product analysis | Shelf stable, 750 millilitres, 12.5% alcohol by volume, branded |
| Store name / location | Total Wine & More, Tukwila 98188 |
| Store type | Specialist retailer |
| Date published | July 2023 |
| Launch type | New product |
| Price in US dollars | 27.97 |
This product retails in a 750 millilitre pack. Elegant and well balanced. Offers a nose of aromas of white fruits, pear, and apricot.
For more information
The Canadian Trade Commissioner Service:
International Trade Commissioners can provide Canadian industry with on-the-ground expertise regarding market potential, current conditions and local business contacts, and are an excellent point of contact for export advice.
More agri-food market intelligence:
International agri-food market intelligence
Discover global agriculture and food opportunities, the complete library of Global Analysis reports, market trends and forecasts, and information on Canada's free trade agreements.
Agri-food market intelligence service
Canadian agri-food and seafood businesses can take advantage of a customized service of reports and analysis, and join our email subscription service to have the latest reports delivered directly to their inbox.
More on Canada's agriculture and agri-food sectors:
Canada's agriculture sectors
Information on the agriculture industry by sector. Data on international markets. Initiatives to support awareness of the industry in Canada. How the department engages with the industry.
Resources
- Euromonitor International | July 2023. Country report: Wine in China
- Euromonitor International | June 2023. Country report: Wine in Canada
- Euromonitor International | June 2023. Country report: Wine in the US
- Euromonitor International | June 2023. Country report: Wine in the United Kingdom
- Global Trade Tracker (GTT), 2023
- Kaczorowski, Mikolaj. Mintel | February 2023. A Year of Innovation in RTD, Wine & Spirits
- Mintel Global New Products Database, 2023
Customized Report Service – Sparkling champagne and non-grape wine in leading markets
Global Analysis Report
Prepared by: Erin-Ann Chauvin, Senior Market Analyst
© His Majesty the King in Right of Canada, represented by the Minister of Agriculture and Agri-Food (2024).
Photo credits
All photographs reproduced in this publication are used by permission of the rights holders.
All images, unless otherwise noted, are copyright His Majesty the King in Right of Canada.
To join our distribution list or to suggest additional report topics or markets, please contact:
Agriculture and Agri-Food Canada, Global Analysis1341 Baseline Rd, Tower 5, 3rd floor
Ottawa ON K1A 0C5
Canada
Email: aafc.mas-sam.aac@agr.gc.ca
The Government of Canada has prepared this report based on primary and secondary sources of information. Although every effort has been made to ensure that the information is accurate, Agriculture and Agri-Food Canada (AAFC) assumes no liability for any actions taken based on the information contained herein.
Reproduction or redistribution of this document, in whole or in part, must include acknowledgement of agriculture and agri-food Canada as the owner of the copyright in the document, through a reference citing AAFC, the title of the document and the year. Where the reproduction or redistribution includes data from this document, it must also include an acknowledgement of the specific data source(s), as noted in this document.
Agriculture and Agri-Food Canada provides this document and other report services to agriculture and food industry clients free of charge.