

Note: This report includes forecasting data that is based on baseline historical data.
Trade performance
In 2022, South Korea imported from the world a total value of US$17.4 million (1.3 million kilograms) of honey. The largest import markets for honey were the United States (US$6.3 million), New Zealand (US$5.8 million), and Australia (US$1.3 million). Canada ranked 5th place and South Korea imported US$1.0 million (141,135 kilograms) of honey from Canada. Kyrgyzstan enjoyed the biggest compound annual growth rate (CAGR) growth of 280.4% from 2018 to 2022, followed by China at a CAGR of 164.7%.
| Country | 2018 | 2019 | 2020 | 2021 | 2022 | CAGR* % 2018-2022 |
|---|---|---|---|---|---|---|
| World | 12,423.9 | 10,127.1 | 12,457.2 | 15,345.9 | 17,395.3 | 8.78 |
| United States | 3,575.6 | 3,678.1 | 5,037.6 | 6,365.3 | 6,310.7 | 15.26 |
| New Zealand | 3,785.4 | 2,798.8 | 3,421.1 | 3,884.1 | 5,849.7 | 11.50 |
| Australia | 2,272.5 | 2,466.4 | 1758.0 | 1,383.2 | 1,285.4 | −13.28 |
| Greece | 653.4 | 33.1 | 301.0 | 342.9 | 1,240.1 | 17.37 |
| Canada | 691.2 | 587.0 | 629.7 | 905.4 | 1,027.1 | 10.41 |
| Argentina | 1,030.5 | 0.0 | 634.7 | 1,385.6 | 555.3 | −14.32 |
| China | 8.0 | 8.1 | 11.8 | 89.3 | 392.8 | 164.71 |
| Bulgaria | 9.8 | 0.0 | 216.0 | 489.7 | 180.2 | 107.08 |
| Hungary | 11.5 | 11.8 | 101.9 | 66.1 | 128.0 | 82.65 |
| Kyrgyzstan | 0.5 | 6.2 | 23.6 | 13.6 | 104.7 | 280.40 |
|
Source: Global Trade Tracker, 2023 *CAGR: Compound Annual Growth Rate |
||||||
Kyrgyzstan enjoyed the biggest CAGR growth of 310.5% from 2018 to 2022, followed by China at a CAGR of 178.8%.
| Country | 2018 | 2019 | 2020 | 2021 | 2022 | CAGR* % 2018-2022 |
|---|---|---|---|---|---|---|
| World | 991,642 | 683,359 | 1,006,216 | 1,294,289 | 1,334,689 | 7.7 |
| United States | 319,675 | 350,809 | 437,387 | 532,809 | 512,723 | 12.5 |
| China | 2,907 | 3,900 | 3,608 | 30,168 | 175,605 | 178.8 |
| New Zealand | 97,374 | 66,956 | 94,376 | 83,946 | 169,376 | 14.8 |
| Canada | 121,311 | 123,394 | 128,187 | 134,985 | 141,135 | 3.9 |
| Argentina | 233,395 | 2.0 | 148,754 | 280,424 | 89,370 | −21.3 |
| Greece | 53,031 | 1,034 | 16,561 | 16,667 | 68,211 | 6.5 |
| Australia | 77,758 | 73,069 | 62,310 | 60,823 | 56,919 | −7.5 |
| Viet-Nam | 52,640 | 27,171 | 30,106 | 48,627 | 55,784 | 1.5 |
| Kyrgyzstan | 72.0 | 419.0 | 10,385 | 2,600 | 20,436 | 310.5 |
| Bulgaria | 810.0 | 5.0 | 31.905 | 46,918 | 9,808 | 86.5 |
|
Source: Global Trade Tracker, 2023 *CAGR: Compound Annual Growth |
||||||
The total Canadian exports of honey to South Korea was US$831,588.9 in 2022. Among which Manitoba exported US$825,870.1, representing 99% of the total exports to South Korea.
| Provinces | 2018 | 2019 | 2020 | 2021 | 2022 | CAGR* % 2018-2022 |
|---|---|---|---|---|---|---|
| Canada's total | 534,282.5 | 381,078.1 | 506,082.9 | 651,429.9 | 831,588.9 | 11.7 |
| Manitoba | 351,288.2 | 357,811.6 | 489,587.2 | 647,708.1 | 825,870.1 | 23.8 |
| Ontario | 0.0 | 0.0 | 0.0 | 0.0 | 3,501.7 | N/C |
| British Columbia | 154,629.9 | 23,266.5 | 16,495.7 | 3,721.8 | 2,217.1 | −65.4 |
| Alberta | 28,364.4 | 0.0 | 0.0 | 0.0 | 0.0 | N/C |
|
Source: Global Trade Tracker, 2023 *CAGR: Compound Annual Growth N/C: Not calculable |
||||||
In volume, the total Canadian exports of honey to South Korea was 145,882.0 kilograms in 2022. Among which Manitoba exported 144,673.0 kilograms, representing 99% of the total exports to South Korea.
| Provinces | 2018 | 2019 | 2020 | 2021 | 2022 | CAGR* % 2018-2022 |
|---|---|---|---|---|---|---|
| Canada's total | 123,883.0 | 128,080.0 | 134,728.0 | 140,513.0 | 145,882.0 | 4.2 |
| Manitoba | 96,690.0 | 122,106.0 | 130,808.0 | 139,662.0 | 144,673.0 | 10.6 |
| Ontario | 0.0 | 0.0 | 0.0 | 0.0 | 700.0 | N/C |
| British Columbia | 23,138.0 | 5,974.0 | 3,920.0 | 851.0 | 509.0 | −61.5 |
| Alberta | 4055.0 | 0.0 | 0.0 | 0.0 | 0.0 | −100.0 |
|
Source: Global Trade Tracker, 2023 *CAGR: Compound Annual Growth N/C: Not calculable |
||||||
Market sizes
According to Euromonitor International, retail sales of honey declined in South Korea in 2022 at a CAGR of −0.8% from 2018 to 2022. In 2022, South Korea registered total retail sales of US$226.4 million in the honey sector.
| Category | 2017 | 2018 | 2019 | 2020 | 2021 | 2022 | CAGR* % 2017-2022 |
|---|---|---|---|---|---|---|---|
| Sweet Spreads | 290.5 | 285.4 | 271.9 | 285.7 | 282.6 | 291.7 | 0.1 |
| Honey | 235.1 | 232.8 | 221.1 | 228.4 | 221.1 | 226.4 | −0.8 |
| Chocolate Spreads | 5.3 | 6.5 | 7.0 | 7.7 | 8.9 | 9.7 | 12.8 |
| Jams and Preserves | 44.1 | 40.1 | 37.7 | 43.0 | 45.7 | 48.2 | 1.8 |
| Nut and Seed Based Spreads | 6.0 | 6.0 | 6.0 | 6.6 | 6.8 | 7.4 | 4.3 |
|
Source: Euromonitor International, 2023 *CAGR: Compound Annual Growth Rate |
|||||||
It is forecasted that honey will grow at a CAGR of 1.0% from 2022 to 2027, reaching US$238.2 million in 2027.
| Category | 2022 | 2023 | 2024 | 2025 | 2026 | 2027 | CAGR* % 2022-2027 |
|---|---|---|---|---|---|---|---|
| Sweet Spreads | 291.7 | 302.2 | 300.8 | 304.1 | 306.1 | 307.1 | 1.0 |
| Honey | 226.4 | 234.0 | 233.1 | 235.9 | 237.5 | 238.2 | 1.0 |
| Chocolate Spreads | 9.7 | 10.3 | 10.7 | 11.2 | 11.7 | 12.2 | 4.7 |
| Jams and Preserves | 48.2 | 50.0 | 48.7 | 48.4 | 47.9 | 47.2 | −0.4 |
| Nut and Seed Based Spreads | 7.4 | 7.9 | 8.2 | 8.6 | 9.0 | 9.4 | 4.9 |
|
Source: Euromonitor International, 2023 *CAGR: Compound Annual Growth Rate |
|||||||
In 2022, South Koreans consumed 10.3 thousand tonnes of honey and the growth decreased at a CAGR of −2.7% from 2017 to 2022.
| Category | 2017 | 2018 | 2019 | 2020 | 2021 | 2022 | CAGR* % 2017-2022 |
|---|---|---|---|---|---|---|---|
| Sweet Spreads | 19.1 | 18.4 | 17.3 | 18.5 | 18.2 | 17.8 | −1.4 |
| Honey | 11.8 | 11.7 | 10.8 | 11.2 | 10.6 | 10.3 | −2.7 |
| Chocolate Spreads | 0.4 | 0.5 | 0.5 | 0.6 | 0.7 | 0.7 | 11.8 |
| Jams and Preserves | 6.2 | 5.7 | 5.3 | 6.0 | 6.2 | 6.1 | −0.3 |
| Nut and Seed Based Spreads | 0.6 | 0.6 | 0.6 | 0.7 | 0.7 | 0.7 | 3.1 |
|
Source: Euromonitor International, 2023 *CAGR: Compound Annual Growth Rate |
|||||||
It is forecasted that the retail sales of honey continued to drop at a CAGR of −1.6% from 2022 to 2027, decreased to 9.5 thousand tonnes in 2027.
| Category | 2022 | 2023 | 2024 | 2025 | 2026 | 2027 | CAGR* % 2022-2027 |
|---|---|---|---|---|---|---|---|
| Sweet Spreads | 17.8 | 17.7 | 17.1 | 16.9 | 16.7 | 16.4 | −1.6 |
| Honey | 10.3 | 10.2 | 9.9 | 9.8 | 9.7 | 9.5 | −1.6 |
| Chocolate Spreads | 0.7 | 0.7 | 0.7 | 0.7 | 0.7 | 0.8 | 2.7 |
| Jams and Preserves | 6.1 | 6.0 | 5.7 | 5.6 | 5.4 | 5.2 | −3.1 |
| Nut and Seed Based Spreads | 0.7 | 0.8 | 0.8 | 0.8 | 0.8 | 0.8 | 2.7 |
|
Source: Euromonitor International, 2023 *CAGR: Compound Annual Growth Rate |
|||||||
In 2022, South Koreans spent US$87.8 in honey, compared with US$100 in 2017 and US$91.6 in 2019. From 2017 to 2022, the honey growth went down, at a CAGR of −2.3%.
| Category | 2017 | 2018 | 2019 | 2020 | 2021 | 2022 | CAGR* % 2017-2022 |
|---|---|---|---|---|---|---|---|
| Sweet Spreads | 100.0 | 96.4 | 91.2 | 95.2 | 92.0 | 91.5 | −1.7 |
| Honey | 100.0 | 97.1 | 91.6 | 94.0 | 88.9 | 87.8 | −2.3 |
| Chocolate Spreads | 100.0 | 120.3 | 129.7 | 142.0 | 160.5 | 167.4 | 9.9 |
| Jams and Preserves | 100.0 | 89.3 | 83.3 | 94.3 | 98.0 | 99.7 | −0.4 |
| Nut and Seed Based Spreads | 100.0 | 98.4 | 97.5 | 105.9 | 107.1 | 111.3 | 1.4 |
|
Source: Euromonitor International, 2023 *CAGR: Compound Annual Growth |
|||||||
It is forecasted that the consumption growth continued to drop at a CAGR of −0.9% from 2022 to 2027, down to US$84.1 in 2027.
| Category | 2022 | 2023 | 2024 | 2025 | 2026 | 2027 | CAGR* % 2022-2027 |
|---|---|---|---|---|---|---|---|
| Sweet Spreads | 91.5 | 92.6 | 90.3 | 89.8 | 88.9 | 87.8 | −0.8 |
| Honey | 87.8 | 88.6 | 86.5 | 86.0 | 85.3 | 84.1 | −0.9 |
| Chocolate Spreads | 167.4 | 174.8 | 178.0 | 182.1 | 187.0 | 192.8 | 2.9 |
| Jams and Preserves | 99.7 | 101.0 | 96.3 | 94.2 | 91.8 | 88.9 | −2.3 |
| Nut and Seed Based Spreads | 111.3 | 117.1 | 119.2 | 122.3 | 126.0 | 130.2 | 3.2 |
|
Source: Euromonitor International, 2023 *CAGR: Compound Annual Growth |
|||||||
Per tonne price for honey was US$21,907 in 2022 and it grew at a CAGR of 2.0% from 2017 to 2022.
| Category | 2017 | 2018 | 2019 | 2020 | 2021 | 2022 | CAGR* % 2017-2022 |
|---|---|---|---|---|---|---|---|
| Sweet Spreads | 15,197.1 | 15,485.3 | 15,722.1 | 15,431.1 | 15,491.9 | 16,352.9 | 1.5 |
| Honey | 19,875.1 | 19,976.0 | 20,405.6 | 20,366.1 | 20,773.9 | 21,907.8 | 2.0 |
| Chocolate Spreads | 13,309.5 | 13,375.0 | 13,449.3 | 13,388.5 | 13,446.6 | 14,057.3 | 1.1 |
| Jams and Preserves | 7,056.1 | 7,095.1 | 7,117.8 | 7,136.6 | 7,358.1 | 7,945.5 | 2.4 |
| Nut and Seed Based Spreads | 9,371.8 | 9,428.2 | 9,456.6 | 9,405.0 | 9,450.7 | 9,871.5 | 1.0 |
|
Source: Euromonitor International, 2023 *CAGR: Compound Annual Growth |
|||||||
It is forecasted that per tonne of honey will be US$24,959.4 in 2027 and it will grow at a CAGR of 2.6% from 2022 to 2027.
| Category | 2022 | 2023 | 2024 | 2025 | 2026 | 2027 | CAGR* % 2022-2027 |
|---|---|---|---|---|---|---|---|
| Sweet Spreads | 16,352.9 | 17,109.8 | 17,579.2 | 17,968.0 | 18,345.7 | 18,732.0 | 2.8 |
| Honey | 21,907.8 | 23,003.7 | 23,560.3 | 24,032.3 | 24,489.5 | 24,959.4 | 2.6 |
| Chocolate Spreads | 14,057.3 | 14,619.3 | 14,971.7 | 15,270.8 | 15,560.2 | 15,857.4 | 2.4 |
| Jams and Preserves | 7,945.5 | 8,308.6 | 8,510.0 | 8,680.8 | 8,846.3 | 9,016.3 | 2.6 |
| Nut and Seed Based Spreads | 9,871.5 | 10,315.0 | 10,563.7 | 10,774.7 | 10,978.8 | 11,188.4 | 2.5 |
|
Source: Euromonitor International, 2023 *CAGR: Compound Annual Growth |
|||||||
Company share
National Agriculture Cooperative Federation had the biggest share 7.7%, followed by Dongsuh Cos Inc: 7.1%.
| Company | 2017 | 2018 | 2019 | 2020 | 2021 | 2022 | CAGR* % 2017-2022 |
|---|---|---|---|---|---|---|---|
| National Agriculture Cooperative Federation | 7.0 | 7.5 | 7.4 | 7.7 | 7.6 | 7.7 | 1.9 |
| Dongsuh Cos Inc | 6.8 | 6.7 | 6.8 | 7.2 | 7.0 | 7.1 | 0.9 |
| Others | 86.2 | 85.8 | 85.8 | 85.2 | 85.4 | 85.1 | −0.3 |
| Total | 100.0 | 100.0 | 100.0 | 100.0 | 100.0 | 100.0 | 0.0 |
|
Source: Euromonitor International, 2023 *CAGR: Compound Annual Growth |
|||||||
National Agriculture Cooperative Federation had a US$17.5 million share, followed by Dongsuh Cos Inc: US$16.1 million. All the shares grew negatively from 2017 to 2022, ranging from −0.8% to −3.0%.
| Company | 2017 | 2018 | 2019 | 2020 | 2021 | 2022 | CAGR* % 2017-2022 |
|---|---|---|---|---|---|---|---|
| National Agriculture Cooperative Federation | 18.2 | 20.0 | 17.6 | 18.6 | 18.4 | 17.5 | −0.8 |
| Dongsuh Cos Inc | 17.7 | 17.7 | 16.3 | 17.4 | 17.0 | 16.1 | −1.9 |
| Others | 224.9 | 227.7 | 204.2 | 206.8 | 207.1 | 192.8 | −3.0 |
| Total | 260.8 | 265.4 | 238.1 | 242.9 | 242.5 | 226.4 | −2.8 |
|
Source: Euromonitor International, 2023 *CAGR: Compound Annual Growth |
|||||||
Distribution channels
In 2022, store-based retailing distribution totaled a market share of 92.7% consisting of (86.0%) grocery retailers and non-grocery retailers (6.7%). Non-store e-commerce retailing holds the highest growth of market share amongst all retail distribution channels, at a CAGR of 16.5% from 2017 to 2022, driven by consumers increasing their online shopping presence due staying at home during the Covid-19 pandemic.
| Channels | 2017 | 2018 | 2019 | 2020 | 2021 | 2022 | CAGR* % 2017-2022 |
|---|---|---|---|---|---|---|---|
| Retail Offline | 96.6 | 96.2 | 95.7 | 93.4 | 92.9 | 92.7 | −0.8 |
| Grocery Retailers | 92.3 | 91.2 | 89.8 | 87.1 | 86.4 | 86.0 | −1.4 |
| Convenience Retail | 1.6 | 1.7 | 2.0 | 2.5 | 2.4 | 2.7 | 11.0 |
| Convenience Stores | 1.6 | 1.7 | 2.0 | 2.5 | 2.4 | 2.7 | 11.0 |
| Supermarkets | 15.9 | 16.5 | 16.9 | 17.5 | 17.3 | 16.5 | 0.7 |
| Hypermarkets | 59.4 | 57.2 | 55.3 | 50.8 | 50.3 | 51.0 | −3.0 |
| Warehouse Clubs | 0.8 | 0.9 | 1.0 | 1.1 | 1.2 | 1.4 | 11.8 |
| Food/drink/tobacco specialists | 1.1 | 1.1 | 1.0 | 0.9 | 0.8 | 0.7 | −8.6 |
| Small Local Grocers | 13.5 | 13.7 | 13.5 | 14.3 | 14.5 | 13.7 | 0.3 |
| Non-Grocery Retailers | 4.3 | 5.1 | 5.9 | 6.2 | 6.5 | 6.7 | 9.3 |
| General Merchandise Stores | 4.3 | 5.1 | 5.9 | 6.2 | 6.5 | 6.7 | 9.3 |
| Retail E-Commerce | 3.4 | 3.8 | 4.3 | 6.6 | 7.1 | 7.3 | 16.5 |
| Total | 100.0 | 100.0 | 100.0 | 100.0 | 100.0 | 100.0 | 0.0 |
|
Source: Euromonitor International, 2023 *CAGR: Compound Annual Growth |
|||||||
Distribution is dominated by retail offline at the value of US$270.4 million and grocery retailer took US$250.8 million. Retail E-commerce increased to US$21.3 million from US$12.5 million in 2019 and its growth is the biggest among all channels at a CAGR of 14.1% from 2017 to 2022.
| Channels | 2017 | 2018 | 2019 | 2020 | 2021 | 2022 | CAGR* % 2017-2022 |
|---|---|---|---|---|---|---|---|
| Retail Offline | 311.2 | 313.1 | 280.2 | 283.6 | 288.0 | 270.4 | −2.8 |
| Grocery Retailers | 297.3 | 296.7 | 262.9 | 264.7 | 267.8 | 250.8 | −3.3 |
| Convenience Retail | 5.1 | 5.6 | 5.7 | 7.6 | 7.3 | 7.9 | 9.1 |
| Convenience Stores | 5.1 | 5.6 | 5.7 | 7.6 | 7.3 | 7.9 | 9.1 |
| Supermarkets | 51.1 | 53.9 | 49.6 | 53.2 | 53.6 | 48.1 | −1.2 |
| Hypermarkets | 191.5 | 186.2 | 161.9 | 154.3 | 155.9 | 148.7 | −4.9 |
| Warehouse Clubs | 2.5 | 2.9 | 3.1 | 3.3 | 3.7 | 4.1 | 10.4 |
| Food/drink/tobacco specialists | 3.6 | 3.5 | 3.0 | 2.9 | 2.4 | 2.0 | −11.1 |
| Small Local Grocers | 43.5 | 44.6 | 39.6 | 43.4 | 44.9 | 40.0 | −1.7 |
| Non-Grocery Retailers | 13.9 | 16.5 | 17.3 | 18.9 | 20.1 | 19.5 | 7.0 |
| General Merchandise Stores | 13.9 | 16.5 | 17.3 | 18.9 | 20.1 | 19.5 | 7.0 |
| Retail E-Commerce | 11.0 | 12.3 | 12.5 | 20.2 | 21.9 | 21.3 | 14.1 |
| Total | 322.2 | 325.4 | 292.7 | 303.8 | 309.9 | 291.7 | −2.0 |
|
Source: Euromonitor International, 2023 *CAGR: Compound Annual Growth |
|||||||
Product launch and trends analysis
According to data from Mintel, 1,159 honey products were launched in South Korea between 2018 and 2022. During this period, bakery was the leading sub-category, followed by snacks and hot beverages. Most popular claims among honey were premium, microwaveable or no additives/preservatives. SPC Samlip, Emart / E-Mart and Lotte Shopping were the three companies with the most launches in the past five years.
| Product attributes | Yearly launch count | Total sample | ||||
|---|---|---|---|---|---|---|
| 2018 | 2019 | 2020 | 2021 | 2022 | ||
| Yearly product launches | 185 | 221 | 239 | 260 | 254 | 1,159 |
| Top five categories | ||||||
| Bakery | 32 | 39 | 49 | 40 | 50 | 210 |
| Snacks | 39 | 34 | 31 | 42 | 26 | 172 |
| Hot Beverages | 17 | 27 | 15 | 22 | 19 | 100 |
| Nutritional Drinks & Other Beverages | 10 | 17 | 17 | 20 | 33 | 97 |
| Meals & Meal Centers | 14 | 19 | 18 | 23 | 21 | 95 |
| Top five claims | ||||||
| Premium | 20 | 31 | 39 | 31 | 7 | 159 |
| Microwaveable | 13 | 25 | 28 | 30 | 3 | 127 |
| No Additives/Preservatives | 14 | 17 | 24 | 23 | 1 | 97 |
| Ease of Use | 12 | 18 | 15 | 29 | 1 | 94 |
| Convenient Packaging | 19 | 32 | 11 | 19 | 0 | 90 |
| Top five nutrition | ||||||
| Protein (listed on pack) | 130 | 146 | 171 | 160 | 174 | 781 |
| Fat (listed on pack) | 130 | 146 | 170 | 160 | 174 | 780 |
| Carbohydrates (listed on pack) | 121 | 139 | 167 | 155 | 168 | 750 |
| Energy (kcal) (listed on pack) | 121 | 139 | 166 | 155 | 167 | 748 |
| Sugars (listed on pack) | 121 | 138 | 167 | 155 | 167 | 748 |
| Top five launch types | ||||||
| New Product | 74 | 94 | 123 | 124 | 124 | 539 |
| New Variety/Range Extension | 71 | 90 | 87 | 97 | 107 | 452 |
| New Packaging | 32 | 31 | 25 | 27 | 22 | 137 |
| Relaunch | 8 | 5 | 4 | 10 | 1 | 28 |
| New Formulation | 0 | 1 | 0 | 2 | 0 | 3 |
| Top five flavours (including blend) | ||||||
| Unflavoured/Plain | 28 | 27 | 51 | 47 | 53 | 206 |
| Honey | 18 | 25 | 15 | 18 | 16 | 92 |
| Chocolate | 8 | 5 | 3 | 5 | 5 | 26 |
| Honey & Butter | 1 | 6 | 5 | 4 | 5 | 21 |
| Honey & Ginger | 2 | 1 | 0 | 4 | 2 | 9 |
| Top five companies | ||||||
| SPC Samlip | 8 | 10 | 12 | 6 | 8 | 44 |
| Emart / E-Mart | 4 | 6 | 13 | 7 | 4 | 34 |
| Lotte Shopping | 9 | 11 | 4 | 6 | 2 | 32 |
| Paris Croissant | 13 | 6 | 6 | 2 | 4 | 31 |
| Pulmuone | 7 | 5 | 6 | 4 | 1 | 23 |
| Source: Mintel, 2023 | ||||||
Examples of new products launched in South Korea
Premium Acacia Honey
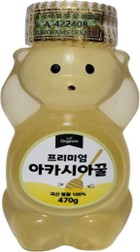
Source: Mintel, 2023
| Company | Mark FS |
|---|---|
| Manufacturer | Gavo Farms |
| Distributor | Mark FS |
| Brand | Orgavio |
| Category | Sweet spreads |
| Sub-category | Honey |
| Market | South Korea |
| Store type | Internet / mail order |
| Date published | November 2022 |
| Product source | Shopper |
| Launch type | New product |
| Price in local currency | KRW17,200.00 |
| Price in US dollars | 12.83 |
| Price in Euros | 12.44 |
Orgavio Premium Acacia Honey is now available, and retails in a 470 gram pack. - 100% domestic honey - Premium
Honey Cream Filled Bun

Source: Mintel, 2023
| Company | SPC Samlip |
|---|---|
| Manufacturer | SPC Samlip |
| Brand | Samlip Samlip Hoppang |
| Category | Bakery |
| Sub-category | Cakes, pastries and sweet goods |
| Market | South Korea |
| Store type | Convenience store |
| Date published | December 2022 |
| Product source | Shopper |
| Launch type | New packaging |
| Price in local currency | KRW6,000.00 |
| Price in US dollars | 4.58 |
| Price in Euros | 4.33 |
Samlip Samlip Hoppang Honey Cream Filled Bun has been repackaged and retails in a 360 gram pack. - Filled with honey choux cream- Can be steamed, microwaved, prepared in an air-fryer or a rice cooker- Pack bears a Bellygom design- Logos and certifications: HACCP, CCM, Green Certification
Honey Fighter Latte

Source: Mintel, 2023
| Company | Hy |
|---|---|
| Manufacturer | Seoul F&B |
| Distributor | Hy |
| Brand | Eats On Pyeonseutorang |
| Category | Ready-to-drink |
| Sub-category | Ready-to-drink (iced) coffee |
| Market | South Korea |
| Store type | Supermarket |
| Date published | December 2022 |
| Launch type | New product |
| Price in local currency | KRW2,700.00 |
| Price in US dollars | 2.02 |
| Price in Euros | 1.95 |
Eats On Pyeonseutorang Honey Fighter Latte is now available, and retails in a 300 millilitre pack. - Contains 72 milligrams of caffeine
Clover Honey
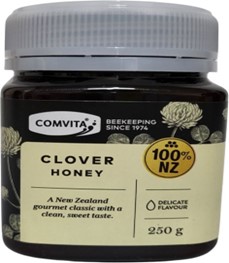
Source: Mintel, 2023
| Company | Comvita |
|---|---|
| Manufacturer | Comvita |
| Distributor | Comvita |
| Brand | Comvita |
| Category | Sweet spreads |
| Sub-category | Honey |
| Market | South Korea |
| Location of Manufacture | Nouvelle-Zélande |
| Store type | Internet / mail order |
| Date published | November 2022 |
| Launch type | New product |
| Price in local currency | KRW24,500.00 |
| Price in US dollars | 18.28 |
| Price in Euros | 17.73 |
Comvita Clover Honey is now available, and retails in a 250 gram pack. - 100% New Zealand honey - A gourmet classic with a clean, sweet taste - Delicate flavour - BPA free jar - Logos and certifications: New Zealand.com
Premium Wild Flower Honey
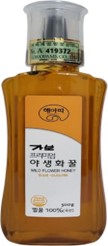
Source: Mintel, 2023
| Company | Gavo Farms |
|---|---|
| Manufacturer | Gavo Farms |
| Brand | Gavo Farms Haeatti |
| Category | Sweet spreads |
| Sub-category | Honey |
| Market | South Korea |
| Store type | Internet / mail order |
| Date published | November 2022 |
| Launch type | New product |
| Price in local currency | KRW13,200.00 |
| Price in US dollars | 9.40 |
| Price in Euros | 9.44 |
Gavo Farms Haeatti Premium Wild Flower Honey is now available, and retails in a 500 gram pack. - 100% Korean flower honey with less than 23.5% carbon isotope ratio - Collected between April and October from honey farms in the mountain - Rich in glucose and characterized by its natural aroma and taste - Can be used in a variety of food and drinks - Logos and Certifications: HACCP
Honey Butter Almond Flavoured Rice Wine

Source: Mintel, 2023
| Company | Seoul Jangsoo |
|---|---|
| Manufacturer | Seoul Jangsoo |
| Brand | Seoul Jangsoo x HBAF |
| Category | Alcoholic beverages |
| Sub-category | Fortified and other wines |
| Market | South Korea |
| Store name | Home Plus |
| Store type | Supermarket |
| Date published | November 2022 |
| Launch type | New product |
| Price in local currency | KRW2,190.00 |
| Price in US dollars | 1.67 |
| Price in Euros | 1.61 |
Seoul Jangsoo x HBAF Honey Butter Almond Flavoured Rice Wine is now available and retails in a 750 millilitre pack. - Contains 0.001% Korean honey, 0.001% butter from New Zealand, and 0.938% almond paste- Logos and certifications: HACCP
For more information
The Canadian Trade Commissioner Service:
International Trade Commissioners can provide Canadian industry with on-the-ground expertise regarding market potential, current conditions and local business contacts, and are an excellent point of contact for export advice.
More agri-food market intelligence:
International agri-food market intelligence
Discover global agriculture and food opportunities, the complete library of Global Analysis reports, market trends and forecasts, and information on Canada's free trade agreements.
Agri-food market intelligence service
Canadian agri-food and seafood businesses can take advantage of a customized service of reports and analysis, and join our email subscription service to have the latest reports delivered directly to their inbox.
More on Canada's agriculture and agri-food sectors:
Canada's agriculture sectors
Information on the agriculture industry by sector. Data on international markets. Initiatives to support awareness of the industry in Canada. How the department engages with the industry.
For additional information on Seoul Food 2023 please contact:
Ben Berry, Deputy Director
Trade Show Strategy and Delivery
Agriculture and agri-food Canada
ben.berry@agr.gc.ca
Resources
- Euromonitor, 2023
- Global Trade Tracker 2023
- Mintel Global New Products Database, 2023
Customized Report Service – Sweet spreads and honey in South Korea
Global Analysis Report
Prepared by: Hongli Wang, Market Analyst
© His Majesty the King in Right of Canada, represented by the Minister of Agriculture and Agri-Food (2023).
Photo credits
All photographs reproduced in this publication are used by permission of the rights holders.
All images, unless otherwise noted, are copyright His Majesty the King in Right of Canada.
To join our distribution list or to suggest additional report topics or markets, please contact:
Agriculture and Agri-Food Canada, Global Analysis1341 Baseline Rd, Tower 5, 3rd floor
Ottawa ON K1A 0C5
Canada
Email: aafc.mas-sam.aac@agr.gc.ca
The Government of Canada has prepared this report based on primary and secondary sources of information. Although every effort has been made to ensure that the information is accurate, Agriculture and Agri-Food Canada (AAFC) assumes no liability for any actions taken based on the information contained herein.
Reproduction or redistribution of this document, in whole or in part, must include acknowledgement of agriculture and agri-food Canada as the owner of the copyright in the document, through a reference citing AAFC, the title of the document and the year. Where the reproduction or redistribution includes data from this document, it must also include an acknowledgement of the specific data source(s), as noted in this document.
Agriculture and Agri-Food Canada provides this document and other report services to agriculture and food industry clients free of charge.