

Note: This report includes forecasting data that is based on baseline historical data.
Executive summary
Italy was the world's 5th largest organic packaged food market in 2021, based on retail value sales. Between 2016 and 2021, Italy's organic packaged food sector expanded at a compound annual growth rate (CAGR) of 7.6% or an increase of US$539.1 million in absolute value terms.
The organic packaged food market in Italy was valued at US$1.8 billion in 2021. During the 2016 to 2021 period, this market gradually grew at a CAGR of 7.6%, However, even with the pandemic overshadowing the economy, organic packaged food sales saw growth at 6.8% between 2020 and 2021.
Between 2016 and 2021, the top three fastest growing organic packaged food categories were organic shelf stable meat, seafood, fruit and vegetables, which expanded by a CAGR of 10.1%, organic spreads (CAGR 9.8%) and organic ready meals (CAGR 9.5%).
The Italy organic packaged food market remained a fragmented industry throughout 2016 and 2021, with Granlatte Societá Cooperativa Agricola arl as the only company who had a double digit market share 11.1% and was the largest company, in terms of retails value sales, followed by Rigoni di Asiago Srl (US$155.3 million 8.8% market share). While private labels continued to show strong presence in the market, with total market share of 20.4% in 2021.
Key demographic indicators
| Country | 2016 | 2021 | CAGR* 2016-2021 | 2022 | 2026 | CAGR* 2021-2026 |
|---|---|---|---|---|---|---|
| World | 34,933.6 | 50,815.4 | 7.8 | 54,475.1 | 70,304.2 | 6.7 |
| USA | 15,285.4 | 21,260.5 | 6.8 | 22,850.2 | 29,021.4 | 6.4 |
| Germany | 3,838.7 | 5,176.7 | 6.2 | 5,412.3 | 6,322.0 | 4.1 |
| China | 2,550.0 | 4,732.5 | 13.2 | 5,234.5 | 7,525.1 | 9.7 |
| France | 2,652.3 | 4,707.6 | 12.2 | 5,136.3 | 7,015.9 | 8.3 |
| Italy | 1,222.0 | 1,761.1 | 7.6 | 1,880.5 | 2,414.0 | 6.5 |
| UK | 1,392.1 | 1,749.2 | 4.7 | 1,810.7 | 2,124.1 | 4.0 |
| Canada | 867.5 | 1,237.7 | 7.4 | 1,360.7 | 1,857.9 | 8.5 |
| Netherlands | 760.4 | 1,100.3 | 7.7 | 1,159.7 | 1,501.7 | 6.4 |
| Denmark | 699.7 | 1,063.7 | 8.7 | 1,106.4 | 1,320.5 | 4.4 |
| Sweden | 673.3 | 905.0 | 6.1 | 943.8 | 1,168.0 | 5.2 |
|
Source: Euromonitor International, 2022 *CAGR: Compound annual growth rate |
||||||
Consumer characteristics - Health and wellness packaged food
Health and wellness packaged food saw slow growth during the 2016 to 2021 period, at a CAGR of 2.4% and is expected to show similar growth trends during the forecast period (2021 to 2026), at a CAGR of 3.8%. Two health and wellness packaged food categories that better performed were 'free from', and organic categories. Especially, 'free from' category saw a strong increase in retail value sales at a CAGR of 8.3% between 2016 and 2021 and is expected to see more moderate growth at a CAGR of 7.5% during the forecast period. Organic packaged food sales increased by a CAGR of 7.6% during the 2016 to 2021 period and are expected to increase by a CAGR of 6.5% during the forecast period.
| Category | 2016 | 2021 | CAGR* 2016-2021 | 2022 | 2026 | CAGR* 2021-2026 |
|---|---|---|---|---|---|---|
| Health and Wellness Packaged Food Total | 15,671.5 | 17,678.3 | 2.4 | 18,346.3 | 21,345.7 | 3.8 |
| Better For You | 2,173.9 | 2,305.6 | 1.2 | 2,374.6 | 2,687.8 | 3.1 |
| Fortified/ Functional | 3,284.3 | 3,366.8 | 0.5 | 3,478.2 | 3,704.4 | 1.9 |
| Free From | 1,479.1 | 2,202.3 | 8.3 | 2,385.9 | 3,163.8 | 7.5 |
| Naturally Healthy | 7,390.9 | 7,864.7 | 1.3 | 8,036.4 | 9,120.0 | 3.0 |
| Organic | 1,343.4 | 1,938.9 | 7.6 | 2,071.2 | 2,669.6 | 6.6 |
| Organic Packaged Food | 1,222.0 | 1,761.1 | 7.6 | 1,880.5 | 2,414.0 | 6.5 |
|
Source: Euromonitor International, 2016 *CAGR: Compound Annual Growth Rate |
||||||
Market size
The organic packaged food market in Italy was valued at US$1.8 billion in 2021. During the 2016 to 2021 period, this market gradually grew at a CAGR of 7.6%, However, even with the pandemic overshadowing the economy, organic packaged food sales saw growth at 5.0% between 2020 and 2021.
The top three organic packaged food categories, in terms of retail value sales, were organic dairy products, with total retail sales of US$461.9 million in 2021, organic rice, pasta and noodles (US$316.2 million) and organic spreads (US$248.7 million).
| Category | 2016 | 2017 | 2018 | 2019 | 2020 | 2021 |
|---|---|---|---|---|---|---|
| Organic Packaged Food Total | 1,222.0 | 1,327.1 | 1,421.6 | 1,524.3 | 1,677.8 | 1,761.1 |
| Baby Food | 38.5 | 40.2 | 41.8 | 43.7 | 45.3 | 46.4 |
| Bread | 18.6 | 19.4 | 20.5 | 21.6 | 23.8 | 25.5 |
| Breakfast Cereals | 4.3 | 4.6 | 4.9 | 5.3 | 5.7 | 6.0 |
| Confectionery | 29.0 | 29.7 | 30.4 | 31.3 | 31.9 | 32.8 |
| Dairy | 299.8 | 326.6 | 356.6 | 389.8 | 427.3 | 461.9 |
| Edible Oil | 103.8 | 108.7 | 114.6 | 117.4 | 127.5 | 132.6 |
| Ready Meals | 60.0 | 66.3 | 71.9 | 76.8 | 86.2 | 94.3 |
| Rice, Pasta and Noodles | 216.4 | 247.2 | 261.6 | 275.2 | 325.4 | 316.2 |
| Sauces, Dressings and Condiments | 32.8 | 34.4 | 35.9 | 37.8 | 40.4 | 42.8 |
| Savoury Snacks | 105.4 | 112.6 | 119.6 | 134.6 | 143.0 | 157.6 |
| Shelf Stable Meat, Seafood, Fruit and Vegetables | 69.5 | 78.0 | 89.5 | 100.9 | 109.4 | 112.5 |
| Soup | 9.9 | 10.7 | 11.3 | 12.2 | 12.8 | 13.7 |
| Spreads | 180.3 | 191.0 | 201.6 | 212.6 | 229.6 | 248.7 |
| Sweet Biscuits, Snack Bars and Fruit Snacks | 53.7 | 57.7 | 61.4 | 65.1 | 69.4 | 70.2 |
| Source: Euromonitor International, 2022 | ||||||
Between 2016 and 2021, the top three fastest growing organic packaged food categories were organic shelf stable meat, seafood, fruit and vegetables, which expanded by a CAGR of 10.1%, organic spreads (CAGR 9.8%) and organic ready meals (CAGR 9.5%).
| Category | Annual growth % 2020-2021 | CAGR* % 2016-2021 | Total growth % 2016-2021 |
|---|---|---|---|
| Organic Packaged Food Total | 5.0 | 7.6 | 44.1 |
| Baby Food | 2.4 | 3.8 | 20.5 |
| Bread | 7.1 | 6.5 | 37.1 |
| Breakfast Cereals | 5.3 | 6.9 | 39.5 |
| Confectionery | 2.8 | 2.5 | 13.1 |
| Dairy | 8.1 | 9.0 | 54.1 |
| Edible Oil | 4.0 | 5.0 | 27.7 |
| Ready Meals | 9.4 | 9.5 | 57.2 |
| Rice, Pasta and Noodles | −2.8 | 7.9 | 46.1 |
| Sauces, Dressings and Condiments | 5.9 | 5.5 | 30.5 |
| Savoury Snacks | 10.2 | 8.4 | 49.5 |
| Shelf Stable Meat, Seafood, Fruit and Vegetables | 2.8 | 10.1 | 61.9 |
| Soup | 7.0 | 6.0 | 33.9 |
| Spreads | 8.3 | 9.8 | 60.0 |
| Sweet Biscuits, Snack Bars and Fruit Snacks | 1.2 | 5.1 | 28.2 |
|
Source: Euromonitor International, 2022 *CAGR: Compound annual growth rate |
|||
With respect to the share of organic packaged food for its corresponding packaged food category, organic spread accounted for a significantly higher share compared to other organic packaged food categories. For example, organic spread represented 17.7% of the spread sales in the Italy in 2021, whereas other organic categories accounted for less than 3.1% of their corresponding packaged food category, except for organic edible oil (5.4% of the total edible oil sales), organic baby food (5.0% of the total packaged baby food sales) and organic savoury snacks (4.3% of the total savoury sales) in 2021. Similar trends are expected to continue during the forecast period.
| Category | Total Packaged Food | Organic Packaged Food | Share of Organic Packaged Food |
|---|---|---|---|
| Baby Food | 936.8 | 46.4 | 5.0 |
| Bread | 21,149.7 | 25.5 | 0.1 |
| Breakfast Cereals | 602.0 | 6.0 | 1.0 |
| Confectionery | 3,845.2 | 32.8 | 0.9 |
| Dairy | 14,752.9 | 461.9 | 3.1 |
| Edible Oil | 2,441.9 | 132.6 | 5.4 |
| Ready Meals | 2,995.9 | 94.3 | 3.1 |
| Rice, Pasta and Noodles | 18,197.1 | 316.2 | 1.7 |
| Sauces, Dressings and Condiments | 3,480.5 | 42.8 | 1.2 |
| Savoury Snacks | 3,678.3 | 157.6 | 4.3 |
| Soup | 446.7 | 13.7 | 3.1 |
| Spreads | 1,408.4 | 248.7 | 17.7 |
| Sweet Biscuits, Snack Bars and Fruit Snacks | 3,069.0 | 70.2 | 2.3 |
| Source: Euromonitor International, 2022 | |||
During the forecast period, the Italy organic packaged food market is expected to grow at a CAGR of 6.5% and to be valued at US$2.4 billion by 2026. Organic savoury snacks are expected to see the fastest growth at a CAGR of 10.2%, reaching total retail sales of US$256.6 million by 2026. Dairy is also forecast to show relatively higher growth than other organic packaged food categories, at a CAGR of 7.7%, reaching total retail value sales of US$670.1 million by 2026.
| Category | 2022 | 2023 | 2024 | 2025 | 2026 |
|---|---|---|---|---|---|
| Organic Packaged Food Total | 1,880.5 | 1,999.3 | 2,125.6 | 2,265.4 | 2,414.0 |
| Baby Food | 47.5 | 48.8 | 49.6 | 52.8 | 55.5 |
| Bread | 27.2 | 28.8 | 30.4 | 32.1 | 33.9 |
| Breakfast Cereals | 6.4 | 6.8 | 7.3 | 7.8 | 8.3 |
| Confectionery | 34.2 | 35.6 | 37.1 | 38.8 | 40.7 |
| Dairy | 500.2 | 539.1 | 577.1 | 621.6 | 670.1 |
| Edible Oil | 138.9 | 145.2 | 152.0 | 159.4 | 166.6 |
| Ready Meals | 101.5 | 108.4 | 116.1 | 124.4 | 132.9 |
| Rice, Pasta and Noodles | 329.6 | 341.4 | 355.8 | 369.8 | 383.6 |
| Sauces, Dressings and Condiments | 45.7 | 48.8 | 51.8 | 54.9 | 58.5 |
| Savoury Snacks | 174.8 | 193.2 | 213.0 | 234.0 | 256.6 |
| Shelf Stable Meat, Seafood, Fruit and Vegetables | 116.2 | 119.6 | 123.0 | 126.9 | 130.6 |
| Soup | 14.6 | 15.7 | 16.9 | 18.1 | 19.4 |
| Spreads | 269.7 | 289.2 | 311.2 | 334.1 | 359.3 |
| Sweet Biscuits, Snack Bars and Fruit Snacks | 74.0 | 78.7 | 84.3 | 90.8 | 98.1 |
| Source: Euromonitor International, 2022 | |||||
| Category | Annual growth % 2021-2022 | CAGR* % 2021-2026 | Total growth % 2021-2026 |
|---|---|---|---|
| Organic Packaged Food Total | 6.8 | 6.5 | 37.1 |
| Baby Food | 2.4 | 3.6 | 19.6 |
| Bread | 6.7 | 5.9 | 32.9 |
| Breakfast Cereals | 6.7 | 6.7 | 38.3 |
| Confectionery | 4.3 | 4.4 | 24.1 |
| Dairy | 8.3 | 7.7 | 45.1 |
| Edible Oil | 4.8 | 4.7 | 25.6 |
| Ready Meals | 7.6 | 7.1 | 40.9 |
| Rice, Pasta and Noodles | 4.2 | 3.9 | 21.3 |
| Sauces, Dressings and Condiments | 6.8 | 6.4 | 36.7 |
| Savoury Snacks | 10.9 | 10.2 | 62.8 |
| Shelf Stable Meat, Seafood, Fruit and Vegetables | 3.3 | 3.0 | 16.1 |
| Soup | 1.1 | 7.2 | 41.6 |
| Spreads | 1.6 | 7.6 | 44.5 |
| Sweet Biscuits, Snack Bars and Fruit Snacks | 4.4 | 6.9 | 39.7 |
|
Source: Euromonitor International, 2022 *CAGR: Compound annual growth rate |
|||
Competition
The Italy organic packaged food market remained a fragmented industry throughout 2016 and 2021, with Granlatte Societá Cooperativa Agricola arl as the only company who had a double digit market share 11.1% and was the largest company, in terms of retails value sales, followed by Rigoni di Asiago Srl (US$155.3 million, 8.8% market share). While private labels continued to show strong presence in the market, with total market share of 20.4% in 2021, reaching US$358.6 million.
| Company | Retail sales (US$ millions) | Market share (%) |
|---|---|---|
| Granlatte Societá Cooperativa Agricola arl | 195.2 | 11.1 |
| Rigoni di Asiago Srl | 155.3 | 8.8 |
| Alce Nero, Gruppo | 73.6 | 4.2 |
| Ecor NaturaSì SpA | 71.8 | 4.1 |
| Almaverde Bio Italia Srl, Società Consortile | 62.9 | 3.6 |
| Cooperativa Latteria Vipiteno Società Agricola | 43.6 | 2.5 |
| Idea Team Srl | 41.7 | 2.4 |
| Costa D'Oro SpA | 20.1 | 1.1 |
| Barilla Holding SpA | 19.3 | 1.1 |
| Flli De Cecco di Filippo Fara San Martino SpA | 18.7 | 1.1 |
| Private Label | 358.6 | 20.4 |
| Others | 518.2 | 29.4 |
| Source: Euromonitor International, 2022 | ||
Distribution
Store-based retail channels continue to be the main outlets for organic grocery sales, especially led by hypermarkets and supermarkets. During the 2016 to 2021 period, sales by e-commerce grew at a CAGR of 12.5%, supported by diversified online grocery e-commerce options.
| Outlet Type | 2016 | 2021 | CAGR* % 2016-2021 | ||
|---|---|---|---|---|---|
| Actual | Share | Actual | Share | ||
| Total | 1,132.4 | 100 | 1,761.1 | 100 | 9.2 |
| Store-Based Retailing | 1,097.2 | 96.9 | 1,697.7 | 96.4 | 9.1 |
| Grocery Retailers | 1,064.3 | 94.0 | 1,641.2 | 93.2 | 9.0 |
| Modern Grocery Retailers | 472.1 | 41.7 | 734.4 | 41.7 | 9.2 |
| Discounters | 137.6 | 12.1 | 220.1 | 12.5 | 9.9 |
| Forecourt Retailers | 28.9 | 2.5 | 40.5 | 2.3 | 7.0 |
| Hypermarkets | 106.9 | 9.4 | 160.3 | 9.1 | 8.4 |
| Supermarkets | 198.7 | 17.5 | 313.5 | 17.8 | 9.5 |
| Traditional Grocery Retailers | 592.2 | 52.3 | 906.8 | 51.5 | 8.9 |
| Independent Small Grocers | 592.2 | 52.3 | 906.8 | 51.5 | 8.9 |
| Non-Grocery Specialists | 32.8 | 2.9 | 56.4 | 3.2 | 11.5 |
| Non-Store Retailing | 35.2 | 3.1 | 63.4 | 3.6 | 12.5 |
| E-Commerce | 35.2 | 3.1 | 63.4 | 3.6 | 12.5 |
|
Source: Euromonitor International, 2022 *CAGR: Compound annual growth rate Note: Actuals for some of sub-outlet types are unavailable. As such, the total of certain sub-categories may not equal to the total of their super-category. |
|||||
Subsector analysis
Organic baby food
The organic baby food market in Italy expanded by a CAGR of 3.8% during the 2016 to 2021 period, recording total retail sales of US$46.4 million in 2021. Organic dried baby food saw the highest growth at a CAGR of 9.6% between 2016 and 2021.
| Category | 2016 | 2017 | 2018 | 2019 | 2020 | 2021 |
|---|---|---|---|---|---|---|
| Organic Baby Food Total | 38.5 | 40.2 | 41.8 | 43.7 | 45.3 | 46.4 |
| Milk Formula | 6.5 | 6.9 | 7.4 | 8.1 | 6.8 | 5.8 |
| Dried Baby Food | 3.8 | 4.3 | 4.7 | 5.1 | 5.6 | 6.0 |
| Prepared Baby Food | 15.2 | 15.6 | 16.2 | 16.8 | 18.3 | 19.4 |
| Other Baby Food | 13.0 | 13.4 | 13.5 | 13.7 | 14.5 | 15.2 |
| Source: Euromonitor International, 2022 | ||||||
| Category | Annual growth % 2020-2021 | CAGR* % 2016-2021 | Total growth % 2016-2021 |
|---|---|---|---|
| Organic Baby Food Total | 2.4 | 3.8 | 20.5 |
| Milk Formula | −14.7 | −2.3 | −10.8 |
| Dried Baby Food | 7.1 | 9.6 | 57.9 |
| Prepared Baby Food | 6.0 | 5.0 | 27.6 |
| Other Baby Food | 4.8 | 3.2 | 16.9 |
|
Source: Euromonitor International, 2022 *CAGR: Compound annual growth rate |
|||
With respect to competition, Alce Nero, Gruppo maintained its leadership in organic baby food throughout 2016 and 2021. In 2021, Alce Nero, Gruppo accounted for 23.9% of the total organic baby food market in Italy. Other major players were Hipp GmbH & Co Vertrieb KG with a market share of 18.1% and Danone, Groupe with a market share of 13.6% in 2021.
| Company | Retail sales (US$ millions) | Market share (%) |
|---|---|---|
| Alce Nero, Gruppo | 11.1 | 23.9 |
| Hipp GmbH & Co Vertrieb KG | 8.4 | 18.1 |
| Danone, Groupe | 6.3 | 13.6 |
| Nestlé SA | 0.6 | 1.3 |
| Il Mangiarsano SpA | 0.4 | 0.9 |
| Private Label | 10.8 | 23.3 |
| Others | 8.8 | 19.0 |
| Source: Euromonitor International, 2022 | ||
Organic dried baby food is set to experience great growth at a CAGR of 6.4% during the forecast period, with total retail sales of US$8.9 million by 2026.
| Category | 2022 | 2023 | 2024 | 2025 | 2026 |
|---|---|---|---|---|---|
| Organic Baby Food Total | 47.5 | 48.8 | 49.6 | 52.8 | 55.5 |
| Milk Formula | 4.6 | 3.8 | 2.4 | 3.0 | 3.1 |
| Dried Baby Food | 6.5 | 7.0 | 7.5 | 8.2 | 8.9 |
| Prepared Baby Food | 20.5 | 21.6 | 22.8 | 24.1 | 25.5 |
| Other Baby Food | 15.8 | 16.4 | 16.9 | 17.4 | 18.1 |
| Source: Euromonitor International, 2022 | |||||
| Category | Annual growth % 2021-2022 | CAGR* % 2021-2026 | Total growth % 2021-2026 |
|---|---|---|---|
| Organic Baby Food Total | 2.4 | 2.6 | 19.6 |
| Milk Formula | −20.7 | −12.4 | −46.6 |
| Dried Baby Food | 8.3 | 6.4 | 48.3 |
| Prepared Baby Food | 5.7 | 4.4 | 31.4 |
| Other Baby Food | 3.9 | 2.7 | 19.1 |
|
Source: Euromonitor International, 2022 *CAGR: Compound annual growth rate |
|||
Organic bread and breakfast cereals
From 2016 to 2021, organic bread and organic breakfast cereals all grew steady at at a CAGR of 6.5%, and 6.9% respectively, with total retail sales of US$25.5 million and US$6.0 million in 2021.
| Category | 2016 | 2017 | 2018 | 2019 | 2020 | 2021 |
|---|---|---|---|---|---|---|
| Organic Bread | 18.6 | 19.4 | 20.5 | 21.6 | 23.8 | 25.5 |
| Organic Breakfast Cereals | 4.3 | 4.6 | 4.9 | 5.3 | 5.7 | 6.0 |
| Source: Euromonitor International, 2022 | ||||||
| Category | Annual growth % 2020-2021 | CAGR* % 2016-2021 | Total growth % 2016-2021 |
|---|---|---|---|
| Organic Bread | 7.1 | 6.5 | 37.1 |
| Organic Breakfast Cereals | 5.3 | 6.9 | 39.5 |
|
Source: Euromonitor International, 2022 *CAGR: Compound annual growth rate |
|||
Idea Team Srl was the leading company among organic bread companies, accounting for 32.0% of the total retail value sales in 2021. Ecor NaturaSì SpA was the leading company among organic breakfast cereal companies, accounting for 47% of the total retail value sales in 2021.
| Company | Retail sales (US$ millions) | Market share (%) |
|---|---|---|
| Idea Team Srl | 8.2 | 32.0 |
| Ecor NaturaSì SpA | 5.1 | 20.0 |
| Private Label | 8.6 | 33.6 |
| Others | 3.7 | 14.5 |
| Source: Euromonitor International, 2022 | ||
| Company | Retail sales (US$ millions) | Market share (%) |
|---|---|---|
| Ecor NaturaSì SpA | 2.8 | 47.0 |
| Idea Team Srl | 1.6 | 27.1 |
| Molino Nicoli SpA | 0.8 | 13.0 |
| Alce Nero, Gruppo | 0.7 | 12.1 |
| Others | 0.0 | 0.7 |
| Source: Euromonitor International, 2022 | ||
| Category | 2022 | 2023 | 2024 | 2025 | 2026 |
|---|---|---|---|---|---|
| Organic Bread | 57.9 | 60.8 | 63.7 | 66.6 | 69.6 |
| Organic Breakfast Cereals | 72.8 | 80.5 | 89.0 | 98.3 | 108.9 |
| Source: Euromonitor International, 2022 | |||||
It is expected to see similar growth during the forecast period, at a CAGR of 5.9%, and 6.7% respectively by 2026.
| Category | Annual growth % 2021-2022 | CAGR* % 2021-2026 | Total growth % 2021-2026 |
|---|---|---|---|
| Organic Bread | 6.7 | 5.9 | 32.9 |
| Organic Breakfast Cereals | 6.7 | 6.7 | 38.3 |
|
Source: Euromonitor International, 2022 *CAGR: Compound annual growth rate |
|||
Organic cooking ingredients and meals
The Italy organic edible oil market grew at a CAGR of 5.0% during the 2016 to 2021 period, with total retail sales of US$132.6 million in 2021. It is expected to expand by a CAGR of 4.7% from 2021 to 2026, reaching total retail sales of US$166.6 million by 2026.
The organic ready meals saw continued growth at a CAGR of 9.5% during the 2016 to 2021 period with total retail sales of US$94.3 million in 2021. This market is expected to expand at a CAGR of 7.1% between 2021 and 2026, reaching total retail sales of US$132.9 million by 2026.
The retail value sales of the organic soup category increased by a CAGR of 6.7% between 2016 and 2021, with total retail sales of US$13.7 million in 2021. The organic soup market is expected to see growth at a CAGR of 7.2% from 2021 to 2026, reaching total retail sales of US$19.4 million by 2026.
The organic spreads saw growth at a CAGR of 6.6% from 2016 to 2021, with total retail sales valued at US$248.7 million in 2021. This market is expected to see a strong growth at a CAGR of 7.6% during the forecast period and to be valued at US$359.3 million by 2026.
| Category | 2016 | 2017 | 2018 | 2019 | 2020 | 2021 |
|---|---|---|---|---|---|---|
| Organic Edible Oil Total | 103.8 | 108.7 | 114.6 | 117.4 | 127.5 | 132.6 |
| Olive Oil | 54.2 | 57.4 | 61.1 | 60.4 | 65.3 | 67.6 |
| Vegetable and Seed Oil | 49.6 | 51.4 | 53.4 | 57.0 | 62.2 | 65.0 |
| Organic Ready Meals | 60.0 | 66.3 | 71.9 | 76.8 | 86.2 | 94.3 |
| Organic Sauces, Dressings and Condiments | 32.8 | 34.4 | 35.9 | 37.8 | 40.4 | 42.8 |
| Organic Soup | 9.9 | 10.7 | 11.3 | 12.2 | 12.8 | 13.7 |
| Organic Spreads Total | 216.4 | 228.8 | 240.8 | 252.6 | 271.9 | 292.5 |
| Spreads | 180.3 | 191.0 | 201.6 | 212.6 | 229.6 | 248.7 |
| Honey | 36.1 | 37.8 | 39.2 | 40.0 | 42.3 | 43.8 |
| Source: Euromonitor International, 2022 | ||||||
| Category | Annual growth % 2020-2021 | CAGR* % 2016-2021 | Total growth % 2016-2021 |
|---|---|---|---|
| Organic Edible Oil Total | 4.0 | 5.0 | 27.7 |
| Olive Oil | 3.5 | 4.5 | 24.7 |
| Vegetable and Seed Oil | 4.5 | 5.6 | 31.0 |
| Organic Ready Meals | 9.4 | 9.5 | 57.2 |
| Organic Sauces, Dressings and Condiments | 5.9 | 5.5 | 30.5 |
| Organic Soup | 7.0 | 6.7 | 38.4 |
| Organic Spreads Total | 7.6 | 6.2 | 35.2 |
| Spreads | 8.3 | 6.6 | 37.9 |
| Honey | 3.5 | 3.9 | 21.3 |
|
Source: Euromonitor International, 2022 *CAGR: Compound annual growth rate |
|||
Costa D'Oro SpA led the sales of the Italy organic edible oil, with a market share of 15.2%, followed by Ki group SpA with a market share of 7.0% and Monini SpA with a market share of 6.3% in 2021.
| Company | Retail sales (US$ millions) | Market share (%) |
|---|---|---|
| Costa D'Oro SpA | 20.1 | 15.2 |
| Ki group SpA | 9.3 | 7.0 |
| Monini SpA | 8.4 | 6.3 |
| Deoleo SA | 7.3 | 5.5 |
| Flli De Cecco di Filippo Fara San Martino SpA | 5.8 | 4.4 |
| Farchioni Olii SpA | 4.3 | 3.3 |
| Idea Team Srl | 3.2 | 2.4 |
| Olearia Desantis SpA | 2.0 | 1.5 |
| Bright Food (Group) Co Ltd | 0.3 | 0.3 |
| Private Label | 1.7 | 1.2 |
| Others | 70.2 | 53.0 |
| Source: Euromonitor International, 2022 | ||
Almaverde Bio Italia Srl, Società Consortile is Italy's leading organic ready meal company, accounting for 65.3% of the organic ready meal sales in 2021.
| Company | Retail sales (US$ millions) | Market share (%) |
|---|---|---|
| Almaverde Bio Italia Srl, Società Consortile | 61.6 | 65.3 |
| Ecor NaturaSì SpA | 12.2 | 13.0 |
| Isalpa Srl | 5.7 | 6.0 |
| Private Label | 8.0 | 8.5 |
| Others | 6.8 | 7.2 |
| Source: Euromonitor International, 2022 | ||
Orogel Surgelati SpA was the top company, accounted for 29.0% of the retail value sales, reaching US$4 million, followed by Alce Nero, Gruppo, accounting for 18.7% in 2021.
| Company | Retail sales (US$ millions) | Market share (%) |
|---|---|---|
| Orogel Surgelati SpA | 4.0 | 29.0 |
| Alce Nero, Gruppo | 2.6 | 18.7 |
| Almaverde Bio Italia Srl, Società Consortile | 1.3 | 9.4 |
| Azienda Agricola Buonamici Srl | 0.3 | 2.1 |
| Private Label | 4.8 | 35.3 |
| Other | 0.8 | 5.5 |
| Source: Euromonitor International, 2022 | ||
Rigoni di Asiago Srl was the leading spread company in Italy with a market share of 62.4%, reaching US$155.3 million, followed by Alce Nero, Gruppo with a market share of 9.7% in 2021.
| Company | Retail sales (US$ millions) | Market share (%) |
|---|---|---|
| Rigoni di Asiago Srl | 155.3 | 62.4 |
| Alce Nero, Gruppo | 24.1 | 9.7 |
| Ponti SpA | 12.3 | 4.9 |
| Apicoltura Casentinese Srl | 5.1 | 2.1 |
| Idea Team Srl | 2.3 | 0.9 |
| Conapi Consorzio Apicoltori Ed Agricoltori-biologici Italiani, Societa' Cooperativa Agricola | 1.2 | 0.5 |
| Ecor NaturaSì SpA | 1.0 | 0.4 |
| Empresas Carozzi SA | 1.0 | 0.4 |
| Private Label | 8.2 | 3.3 |
| Others | 38.2 | 15.4 |
| Source: Euromonitor International, 2022 | ||
| Category | 2022 | 2023 | 2024 | 2025 | 2026 |
|---|---|---|---|---|---|
| Organic Edible Oil Total | 138.9 | 145.2 | 152.0 | 159.4 | 166.6 |
| Olive Oil | 70.0 | 72.5 | 75.1 | 78.1 | 80.9 |
| Vegetable and Seed Oil | 68.9 | 72.7 | 76.9 | 81.3 | 85.7 |
| Organic Ready Meals | 101.5 | 108.4 | 116.1 | 124.4 | 132.9 |
| Organic Sauces, Dressings and Condiments | 45.7 | 48.8 | 51.8 | 54.9 | 58.5 |
| Organic Soup | 14.6 | 15.7 | 16.9 | 18.1 | 19.4 |
| Organic Spreads Total | 315.4 | 336.7 | 360.4 | 385.1 | 412.3 |
| Spreads | 269.7 | 289.2 | 311.2 | 334.1 | 359.3 |
| Honey | 45.7 | 47.5 | 49.2 | 51.0 | 53.0 |
| Source: Euromonitor International, 2022 | |||||
| Category | Annual growth % 2021-2022 | CAGR* % 2021-2026 | Total growth % 2021-2026 |
|---|---|---|---|
| Organic Edible Oil Total | 4.8 | 4.7 | 25.6 |
| Olive Oil | 3.6 | 3.7 | 19.7 |
| Vegetable and Seed Oil | 6.0 | 5.7 | 31.8 |
| Organic Ready Meals | 7.6 | 7.1 | 40.9 |
| Organic Sauces, Dressings and Condiments | 6.8 | 6.4 | 36.7 |
| Organic Soup | 6.6 | 7.2 | 41.6 |
| Organic Spreads Total | 7.8 | 7.1 | 41.0 |
| Spreads | 8.4 | 7.6 | 44.5 |
| Honey | 4.3 | 3.9 | 21.0 |
|
Source: Euromonitor International, 2022 *CAGR: Compound annual growth rate |
|||
Organic dairy
The Italy organic dairy market grew at a CAGR of 9.0% during the 2016 to 2021 period, recording total retail sales of US$461.9 million in 2021. Organic cheese sub-category saw the fastest growth at a CAGR of 11.4% between 2016 and 2021. Organic dairy sector is forecast to see growth at a CAGR of 7.7% from 2021 to 2026, reaching total retail sales of US$670.1 million by 2026.
| Category | 2016 | 2017 | 2018 | 2019 | 2020 | 2021 |
|---|---|---|---|---|---|---|
| Organic Dairy Total | 299.8 | 326.6 | 356.6 | 389.8 | 427.3 | 461.9 |
| Organic Butter and Spreads | 39.7 | 41.4 | 43.1 | 44.6 | 47.8 | 50.9 |
| Organic Cheese | 115.3 | 126.8 | 139.1 | 156.1 | 178.7 | 197.6 |
| Organic Milk | 89.3 | 94.8 | 101.4 | 118.2 | 130.2 | 140.5 |
| Organic Yoghurt | 53.7 | 61.8 | 71.1 | 69.0 | 68.5 | 70.6 |
| Organic Cream | 1.8 | 1.8 | 1.9 | 2.0 | 2.1 | 2.1 |
| Source: Euromonitor International, 2022 | ||||||
| Category | Annual growth % 2020-2021 | CAGR* % 2016-2021 | Total growth % 2016-2021 |
|---|---|---|---|
| Organic Dairy Total | 8.1 | 9.0 | 54.1 |
| Organic Butter and Spreads | 6.5 | 5.1 | 28.2 |
| Organic Cheese | 10.6 | 11.4 | 71.4 |
| Organic Milk | 7.9 | 9.5 | 57.3 |
| Organic Yoghurt | 3.1 | 5.6 | 31.5 |
| Organic Cream | 0.0 | 3.1 | 16.7 |
|
Source: Euromonitor International, 2022 *CAGR: Compound annual growth rate |
|||
The Italy organic dairy market is highly fragmented, with sales led by Granlatte Societá Cooperativa Agricola arl, which accounted for 42.3% of the total organic dairy sales in 2021.
| Company | Retail sales (US$ millions) | Market share (%) |
|---|---|---|
| Granlatte Societá Cooperativa Agricola arl | 195.2 | 42.3 |
| Cooperativa Latteria Vipiteno Società Agricola | 43.6 | 9.4 |
| Andros SAS | 14.8 | 3.2 |
| Saputo Inc | 11.9 | 2.6 |
| Prealpi Industria Casearia SpA | 7.8 | 1.7 |
| Latteria Montello SpA | 5.7 | 1.2 |
| Brazzale SpA | 5.5 | 1.2 |
| Private Label | 56.6 | 12.3 |
| Others | 120.8 | 26.1 |
| Source: Euromonitor International, 2022 | ||
| Category | 2022 | 2023 | 2024 | 2025 | 2026 |
|---|---|---|---|---|---|
| Organic Dairy Total | 500.2 | 539.1 | 577.1 | 621.6 | 670.1 |
| Organic Butter and Spreads | 54.6 | 57.1 | 59.8 | 62.5 | 66.1 |
| Organic Cheese | 216.6 | 235.1 | 251.0 | 270.2 | 290.7 |
| Organic Milk | 152.3 | 164.8 | 178.2 | 193.8 | 210.3 |
| Organic Yoghurt | 74.4 | 79.8 | 85.7 | 92.6 | 100.5 |
| Organic Cream | 2.2 | 2.3 | 2.4 | 2.5 | 2.6 |
| Source: Euromonitor International, 2022 | |||||
| Category | Annual growth % 2021-2022 | CAGR* % 2021-2026 | Total growth % 2021-2026 |
|---|---|---|---|
| Organic Dairy Total | 8.3 | 7.7 | 45.1 |
| Organic Butter and Spreads | 7.3 | 5.4 | 29.9 |
| Organic Cheese | 9.6 | 8.0 | 47.1 |
| Organic Milk | 8.4 | 8.4 | 49.7 |
| Organic Yoghurt | 5.4 | 7.3 | 42.4 |
| Organic Cream | 4.8 | 4.4 | 23.8 |
|
Source: Euromonitor International, 2022 *CAGR: Compound annual growth rate |
|||
Organic rice and pasta
During the 2016 to 2021 period, the Italy organic rice and pasta market saw a growth at a CAGR of 7.9% and was valued at US$316.2 million in 2021. While this market is forecast to see positive growth, the growth of the market will be at a CAGR of 3.9%, reaching total retail sales of US$383.6 million by 2026.
| Category | 2016 | 2017 | 2018 | 2019 | 2020 | 2021 |
|---|---|---|---|---|---|---|
| Organic Rice and Pasta Total | 216.4 | 247.2 | 261.6 | 275.2 | 325.4 | 316.2 |
| Rice | 13.4 | 14.9 | 15.9 | 16.8 | 19.7 | 19.1 |
| Pasta | 203.0 | 232.3 | 245.7 | 258.4 | 305.7 | 297.1 |
| Source: Euromonitor International, 2022 | ||||||
| Category | Annual growth % 2020-2021 | CAGR* % 2016-2021 | Total growth % 2016-2021 |
|---|---|---|---|
| Organic Rice and Pasta Total | −2.8 | 7.9 | 46.1 |
| Organic Rice | −3.0 | 7.3 | 42.5 |
| Organic Pasta | −2.8 | 7.9 | 46.4 |
|
Source: Euromonitor International, 2022 *CAGR: Compound annual growth rate |
|||
In 2021, the retail value sales of Italy organic rice and pasta sector are led by Ecor NaturaSì SpA with a market share of 11.5%, Barilla Holding SpA with a market share of 6.1% and Alce Nero, Gruppo with a market share of 6.0%. Private labels accounted for 55.8% of this market, recording total retail sales of US$176.6 million in 2021.
| Company | Retail sales (US$ millions) | Market share (%) |
|---|---|---|
| Ecor NaturaSì SpA | 36.3 | 11.5 |
| Barilla Holding SpA | 19.3 | 6.1 |
| Alce Nero, Gruppo | 19.0 | 6.0 |
| Flli De Cecco di Filippo Fara San Martino SpA | 12.3 | 3.9 |
| Newlat Food SpA | 7.1 | 2.2 |
| Idea Team Srl | 5.6 | 1.8 |
| Sarchio SpA | 4.4 | 1.4 |
| Private Label | 176.6 | 55.8 |
| Others | 35.6 | 11.2 |
| Source: Euromonitor International, 2022 | ||
| Category | 2022 | 2023 | 2024 | 2025 | 2026 |
|---|---|---|---|---|---|
| Organic Rice and Pasta Total | 329.6 | 341.4 | 355.8 | 369.8 | 383.6 |
| Organic Rice | 19.9 | 20.7 | 21.5 | 22.4 | 23.3 |
| Organic Pasta | 309.7 | 320.7 | 334.3 | 347.4 | 360.3 |
| Source: Euromonitor International, 2022 | |||||
| Category | Annual growth % 2021-2022 | CAGR* % 2021-2026 | Total growth % 2021-2026 |
|---|---|---|---|
| Organic Rice and Pasta Total | 4.2 | 3.9 | 21.3 |
| Organic Rice | 4.2 | 4.1 | 22.0 |
| Organic Pasta | 4.2 | 3.9 | 21.3 |
|
Source: Euromonitor International, 2022 *CAGR: Compound annual growth rate |
|||
Canada exported pulses to Italy 2017 to 2021
Canada's exports of pulses to Italy in values declined for the past five years at a CAGR of −41.9% between 2017 and 2021, from Can$8,961.3 thousand in 2017 to Can$1,023.5 thousand in 2021. Only organic lentils grew at a CAGR of 53.7% between 2019 and 2021, reaching Can$316.8 thousand in 2021.
| HS Code | Description | 2017 | 2018 | 2019 | 2020 | 2021 | CAGR* % 2017-2021 |
|---|---|---|---|---|---|---|---|
| Total | 8,961.3 | 5,064.3 | 2,212.3 | 2,759.7 | 1,023.5 | −41.9 | |
| 07134021 | lentils, certified organic, green, including french, dried, shelled, w/n skinned / split, nowhere else specified | 7,576.7 | 3,325.3 | 1,532.1 | 1,965.8 | 427.4 | −51.3 |
| 07134029 | lentils, certified organic, nes, dried, shelled, w/n skinned / split,o/t seeds for sowing | 134.0 | 50.2 | 316.8 | 53.7 | ||
| 07134022 | lentils, certified organic, red, dried, shelled, w/n skinned / split, nowhere else specified | 1,366.1 | 1,738.9 | 546.2 | 743.7 | 279.3 | −32.8 |
| 07131021 | peas, certified organic, yellow, dried,shelled,w/n skinned / split, o/t seeds for sowing | 18.4 | N/C[1] | ||||
|
Source: Global Trade Tracker 2022 *CAGR: Compound annual growth rate 1: Not Calculable |
|||||||
| HS Code | Description | 2017 | 2018 | 2019 | 2020 | 2021 | CAGR* % 2017-2021 |
|---|---|---|---|---|---|---|---|
| Total | 8,366.9 | 5,487.0 | 3,439.1 | 3,167.3 | 964.9 | −42.7 | |
| 07134021 | lentils, certified organic, green, including fresh,dried,shelled, w/n skinned/split, nowhere else specified | 6,794.1 | 3,359.3 | 2,466.5 | 2,262.6 | 416.4 | −50.2 |
| 07134022 | lentils, certified organic, red, dried, shelled, w/n skinned/split, nowhere else specified | 1,547.8 | 2,127.8 | 854.3 | 859.9 | 346.0 | −31.2 |
| 07134029 | lentils, certified organic, nes, dried, shelled, w/n skinned/split,o/t seeds for sowing | 118.3 | 44.9 | 202.6 | 30.9 | ||
| 07131021 | peas, certified organic, yellow, dried, shelled, w/n skinned/split, o/t seeds for sowing | 24.9 | N/C[1] | ||||
|
Source: Global Trade Tracker 2022 *CAGR: Compound annual growth rate 1: Not Calculable |
|||||||
New product launch analysis
From 2017 to 2021, 1,040 organic packaged food products were introduced in Italy with the highest number of new products launched in 2019. The most popular product claim was organic (1,007 products from 2017 to 2021). Other popular claims were low/no/reduced allergen (328 products from 2017 to 2021) and Ethical - Sustainable (Habitat/Resources) (298 products from 2017 to 2021). The companies with the highest number of new product launches was EcorNaturaSì with 155 products, followed by Baule Volante (59 products) and Conad (22 products). Nearly half of the product launches (504 products) was new products. The top five packaging types included flexible (392 products) followed by jar (187 products).
| Product attributes | Number of new products by year | Total | ||||
|---|---|---|---|---|---|---|
| 2017 | 2018 | 2019 | 2020 | 2021 | ||
| Yearly product launches | 235 | 226 | 242 | 190 | 147 | 1,040 |
| Top 10 claims | ||||||
| Organic | 231 | 215 | 237 | 183 | 141 | 1,007 |
| Low/No/Reduced Allergen | 85 | 73 | 79 | 47 | 44 | 328 |
| Ethical - Sustainable (Habitat/Resources) | 63 | 41 | 79 | 64 | 51 | 298 |
| Vegan/No Animal Ingredients | 47 | 76 | 55 | 43 | 39 | 260 |
| Gluten Free | 59 | 53 | 68 | 38 | 38 | 256 |
| Ethical - Environmentally Friendly Product | 47 | 34 | 68 | 52 | 40 | 241 |
| Ethical - Environmentally Friendly Package | 53 | 34 | 41 | 63 | 42 | 233 |
| Ethical - Recycling | 26 | 12 | 24 | 41 | 17 | 120 |
| Babies and Toddlers (0-4) | 52 | 12 | 35 | 4 | 15 | 118 |
| Wholegrain | 26 | 27 | 28 | 20 | 12 | 113 |
| Top 5 companies | ||||||
| EcorNaturaSì | 31 | 30 | 20 | 47 | 27 | 155 |
| Baule Volante | 15 | 16 | 21 | 5 | 2 | 59 |
| Conad | 0 | 1 | 21 | 0 | 0 | 22 |
| Terre e Tradizioni | 15 | 3 | 0 | 1 | 2 | 21 |
| HiPP | 11 | 1 | 5 | 0 | 3 | 20 |
| Top 5 flavour component | ||||||
| Unflavoured/Plain | 107 | 92 | 106 | 80 | 78 | 463 |
| Apple | 10 | 3 | 9 | 4 | 7 | 33 |
| Ginger | 5 | 8 | 10 | 3 | 2 | 28 |
| Tomato | 10 | 8 | 4 | 4 | 1 | 27 |
| Vegetable | 9 | 10 | 4 | 2 | 1 | 26 |
| Top 5 ingredients | ||||||
| Waters (Food) | 95 | 62 | 70 | 30 | 28 | 285 |
| Salt (Food) | 49 | 64 | 56 | 42 | 46 | 257 |
| Sunflower Seed Oil (Food) | 45 | 66 | 41 | 33 | 32 | 217 |
| Food Acids | 32 | 35 | 39 | 21 | 20 | 147 |
| Sea Salt (Food) | 31 | 47 | 25 | 20 | 21 | 144 |
| Launch types | ||||||
| New Product | 127 | 101 | 128 | 76 | 72 | 504 |
| New Variety/Range Extension | 75 | 70 | 80 | 77 | 39 | 341 |
| New Packaging | 19 | 32 | 24 | 14 | 22 | 111 |
| Relaunch | 12 | 14 | 10 | 22 | 13 | 71 |
| New Formulation | 2 | 9 | 0 | 1 | 1 | 13 |
| Top 5 packaged types | ||||||
| Flexible | 108 | 70 | 78 | 71 | 65 | 392 |
| Jar | 38 | 32 | 59 | 26 | 32 | 187 |
| Bottle | 25 | 23 | 31 | 24 | 10 | 113 |
| Carton | 16 | 19 | 15 | 15 | 11 | 76 |
| Tray | 11 | 27 | 15 | 13 | 3 | 69 |
| Source: Mintel GNPD, 2022 | ||||||
Examples of new products
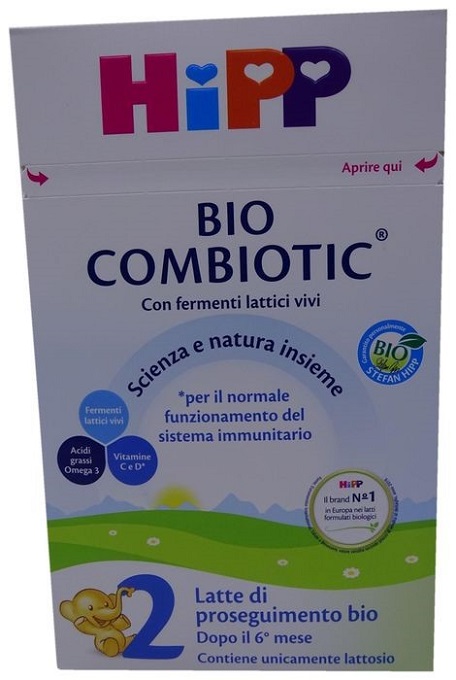
Stage 2 Organic Baby Milk Powder Formula
| Record ID | 9266144 |
|---|---|
| Company | HiPP |
| Manufacturer | HiPP |
| Brand | HiPP Bio Combiotic |
| Category | Baby Food |
| Sub-category | Baby formula (6-12 months) |
| Market | Italy |
| Production Code | DE NW 201 EG |
| Store name | Sorgentenatura.it |
| Store type | Internet / mail order |
| Date published | December 2021 |
| Product source | Shopper |
| Launch type | New product |
| Price in local currency | €19.30 |
| Price in US dollars | 21.84 |
HiPP Bio Combiotic Latte di Proseguimento Bio 2 (Stage 2 Organic Baby Milk Powder Formula) is said to be Europe's number 1 brand in organic formulated milks. The product has been made with selected organic ingredients, and has been formulated with vitamin C and D to support the immune system; live lactic ferments; omega 3 fatty acids, and lactose. It is suitable from six months onwards, and can be prepared by mixing 150 millilitres of boiled water with five scoops of powder. It retails in a 600 gram recyclable pack providing 44 100 millilitre portions, and featuring preparation instructions as well as the EU Organic and FSC Mix logos. The packaging is made with lower CO2 emissions compared to tin cans, is 99% recyclable, is printed with plant-based oil colors and made with cardboard from responsibly managed sources.
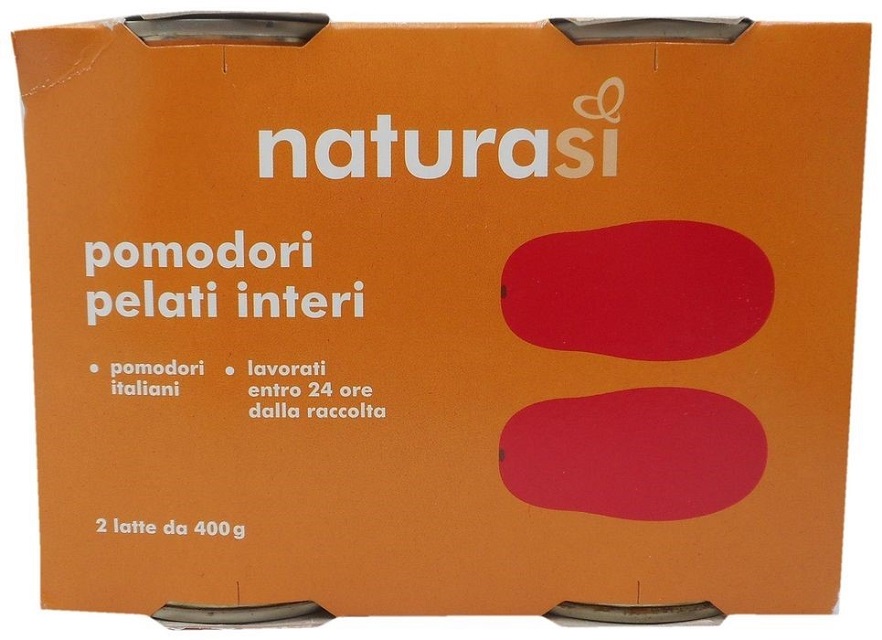
Organic Whole Peeled Tomatoes
| Record ID | 8810525 |
|---|---|
| Company | EcorNaturaSì |
| Manufacturer | Defiap |
| Brand | NaturaSì |
| Category | Fruit and vegetables |
| Sub-category | Vegetables |
| Market | Italy |
| Store name | Naturitas.it |
| Store type | Internet / mail order |
| Date published | June 2021 |
| Product source | Shopper |
| Launch type | New packaging |
| Price in local currency | €2.35 |
| Price in US dollars | 2.85 |
NaturaSì Pomodori Pelati Interi Biologici (Organic Whole Peeled Tomatoes) have been repackaged in a newly designed pack with new graphics. The product consists of Italian tomatoes processed within 24 hours from harvest, and retails in a two 400 gram pack featuring the EU Organic logo as well as a QR code. The manufacturer claims to write only essential info on pack to avoid wasting packaging material and to support an ecosystem based on a circularity between production process and economy, collaborating with conscious producers, transformers, distributors and consumers who share ethical farming finalised to the production of vital food accessible to anyone.
For more information
The Canadian Trade Commissioner Service:
International Trade Commissioners can provide Canadian industry with on-the-ground expertise regarding market potential, current conditions and local business contacts, and are an excellent point of contact for export advice.
More agri-food market intelligence:
International agri-food market intelligence
Discover global agriculture and food opportunities, the complete library of Global Analysis reports, market trends and forecasts, and information on Canada's free trade agreements.
Agri-food market intelligence service
Canadian agri-food and seafood businesses can take advantage of a customized service of reports and analysis, and join our email subscription service to have the latest reports delivered directly to their inbox.
More on Canada's agriculture and agri-food sectors:
Canada's agriculture sectors
Information on the agriculture industry by sector. Data on international markets. Initiatives to support awareness of the industry in Canada. How the department engages with the industry.
Resources
- Euromonitor International 2022
- Mintel, New Product Database 2022
- Global Trade Tracker 2022
Health and wellness – Organic packaged food trends in Italy
Global Analysis Report
Prepared by: Hongli Wang, Senior Market Analyst
© His Majesty the King in Right of Canada, represented by the Minister of Agriculture and Agri-Food (2022).
Photo credits
All photographs reproduced in this publication are used by permission of the rights holders.
All images, unless otherwise noted, are copyright His Majesty the King in Right of Canada.
To join our distribution list or to suggest additional report topics or markets, please contact:
Agriculture and Agri-Food Canada, Global Analysis1341 Baseline Rd, Tower 5, 3rd floor
Ottawa ON K1A 0C5
Canada
Email: aafc.mas-sam.aac@agr.gc.ca
The Government of Canada has prepared this report based on primary and secondary sources of information. Although every effort has been made to ensure that the information is accurate, Agriculture and Agri-Food Canada (AAFC) assumes no liability for any actions taken based on the information contained herein.
Reproduction or redistribution of this document, in whole or in part, must include acknowledgement of agriculture and agri-food Canada as the owner of the copyright in the document, through a reference citing AAFC, the title of the document and the year. Where the reproduction or redistribution includes data from this document, it must also include an acknowledgement of the specific data source(s), as noted in this document.
Agriculture and Agri-Food Canada provides this document and other report services to agriculture and food industry clients free of charge.