

Note: This report includes forecasting data that is based on baseline historical data.
Executive summary
Overall, the Health and wellness (HW) food and beverage sector in Japan reached a retail sales value of US$55.1 billion in 2021, which stayed the same at a compound annual growth rate (CAGR) of 0.0% between 2016 and 2021 and are expected to continue to grow at a CAGR of 1.6% (2021-2026). During the pandemic, Japanese remained alert and refrained from going out of home. This made the retail sales of HW foods and beverages remain stagnant, no growth at all between 2016 and 2021.
In 2021, among H&W foods and beverages, a total of 40.3% of the market were from within the HW packaged food category (US$23.2 billion), with fortified/functional (FF) packaged food products representing the highest sales value at US$11.7 billion, followed by Free From products (US$5.4 billion) and naturally healthy (NH) packaged food (US$2.9 billion). The HW packaged food grew at A CAGR of 0.7% between 2016 and 2021 and is expected to grow at a CAGR of 1.6% between 2021 and 2026.
H&W packaged beverage products represented the remaining 59.7% market in retail share value, reaching sales of US$31.9 billion, thriving the most from within the FF, NH and better for you (BFY) related drink categories. Although the CAGR growth is negative between 2016 and 2021, but will expect to be bounced back to 1.7% between 2021 and 2026, reaching US$34.7 billion in 2026.
FF dairy was the largest category (US$6.9 billion) within FF packaged foods in 2021, representing almost 50.6% total market share. FF confectionery was the second largest in retail value (US$2.2 billion) in 2021. It is worth noting that FF yoghurt represented 89.0% of the entire FF dairy, reaching US$5.9 billion.
Market overview
Health and wellness (HW) is the combination of organic food and beverages, fortified/functional (FF) food and beverages, naturally healthy (NH) food and beverages, better for you (BFY) food and beverages and food intolerance products.
Overall, the HW food and beverage sector in Japan reached a retail sales value of US$55.1 billion in 2021, which stayed the same at a compound annual growth rate (CAGR) of 0.0% between 2016 and 2021 and are expected to continue to grow at a CAGR of 1.6% (2021-2026). During the pandemic, Japanese remained alert and refrained from going out of home. This made the retail sales of H & W foods and beverages remain stagnant, no growth at all between 2016 and 2021.
In 2021, among HW foods and beverages, a total of 40.3% of the market were from within the HW packaged food category (US$23.2 billion), with FF packaged food products representing the highest sales value at US$11.7 billion, followed by Free From products (US$5.4 billion) and NH packaged food (US$2.9 billion). The HW packaged food grew at a CAGR of 0.7% between 2016 and 2021 and is expected to grow at a CAGR of 1.6% between 2021 and 2026.
HW packaged beverage products represented the remaining 59.7% market in retail share value, reaching sales of US$31.9 billion, thriving the most from within the FF, NH and BFY related drink categories. Although the CAGR growth is negative between 2016 and 2021, but will expect to be bounced back to 1.7% between 2021 and 2026, reaching US$34.7 billion in 2026.
| Category | 2016 | 2021 | CAGR* % 2016-2021 | 2022 | 2026 | CAGR* % 2021-2026 |
|---|---|---|---|---|---|---|
| Health and wellness | 55,196.1 | 55,120.5 | 0.0 | 56,474.9 | 59,808.6 | 1.6 |
| Naturally Healthy (NH) | 26,487.1 | 26,274.4 | −0.2 | 27,055.3 | 28,537.7 | 1.7 |
| Fortified/Functional (FF) | 18,613.4 | 18,793.3 | 0.2 | 19,221.7 | 20,370.6 | 1.6 |
| Free From | 5,279.5 | 5,421.0 | 0.5 | 5,525.3 | 6,020.6 | 2.1 |
| Better For You (BFY) | 4,232.5 | 4,029.3 | −1.0 | 4,066.6 | 4,240.1 | 1.0 |
| Organic | 583.6 | 602.6 | 0.6 | 606.1 | 639.7 | 1.2 |
|
Source: Euromonitor International, 2022 *CAGR: Compound annual growth rate |
||||||
| Category | 2016 | 2021 | CAGR* % 2016-2021 | 2022 | 2026 | CAGR* % 2021-2026 |
|---|---|---|---|---|---|---|
| Health and wellness packaged food | 22,453.9 | 23,238.4 | 0.7 | 23,565.3 | 25,159.9 | 1.6 |
| Fortified/Functional Packaged Food | 11,486.3 | 11,726.7 | 0.4 | 11,870.7 | 12,570.1 | 1.4 |
| Free From Products | 5,279.5 | 5,421.0 | 0.5 | 5,525.3 | 6,020.6 | 2.1 |
| Naturally Healthy Packaged Food | 2,707.0 | 2,975.2 | 1.9 | 3,024.3 | 3,249.5 | 1.8 |
| Better For You Packaged Food | 2,588.7 | 2,698.9 | 0.8 | 2,723.8 | 2,873.3 | 1.3 |
| Organic Packaged Food | 392.4 | 416.6 | 1.2 | 421.1 | 446.5 | 1.4 |
|
Source: Euromonitor International, 2022 *CAGR: Compound annual growth rate |
||||||
| Category | 2016 | 2021 | CAGR* % 2016-2021 | 2022 | 2026 | CAGR* % 2021-2026 |
|---|---|---|---|---|---|---|
| Health and wellness beverages | 32,742.2 | 31,882.1 | −0.5 | 32,909.6 | 34,648.7 | 1.7 |
| Naturally Healthy Beverages | 23,780.1 | 23,299.2 | −0.4 | 24,030.9 | 25,288.2 | 1.7 |
| Fortified/Functional Beverages | 7,127.2 | 7,066.5 | −0.2 | 7,350.9 | 7,800.5 | 2.0 |
| Better For You Beverages | 1,643.7 | 1,330.4 | −4.1 | 1,342.8 | 1,366.8 | 0.5 |
| Organic Beverages | 191.2 | 186.0 | −0.5 | 184.9 | 193.2 | 0.8 |
|
Source: Euromonitor International, 2022 *CAGR: Compound annual growth rate |
||||||
Retail sales
FF packaged food products reached US$11.7 billion in 2021 from US$11.5 billion in 2016.
FF dairy was the largest category (US$6.9 billion) within FF packaged foods in 2021, representing almost 50.6% total market share. FF confectionery was the second largest in retail value (US$2.2 billion) in 2021. It is worth noting that FF yoghurt represented 89.0% of the entire FF dairy, reaching US$5.9 billion.
The FF cheese subcategory had the fastest growth at a CAGR of 3.8% (2016-2021). It is expected to grow at CAGR of 3.4% between 2021 and 2026.
| Category | 2016 | 2021 | CAGR* % 2016-2021 | 2022 | 2026 | CAGR* % 2021-2026 |
|---|---|---|---|---|---|---|
| Total Fortified/Functional packaged food | 11,486.3 | 11,726.7 | 0.4 | 11,870.7 | 12,570.1 | 1.4 |
| Fortified/Functional Baby Food | 594.9 | 498.5 | −3.5 | 462.4 | 411.9 | −3.7 |
| Fortified/Functional Breakfast Cereals | 740.9 | 793.2 | 1.4 | 836.0 | 928.0 | 3.2 |
| Fortified/Functional Bread | 187.2 | 207.5 | 2.1 | 210.8 | 226.7 | 1.8 |
| Fortified/Functional Confectionery | 2,187.3 | 2,247.3 | 0.5 | 2,290.2 | 2,490.2 | 2.1 |
| Fortified/Functional Dairy | 6,796.1 | 6,920.3 | 0.4 | 7,003.7 | 7,395.0 | 1.3 |
| Fortified/Functional Butter and Spreads | 72.1 | 64.7 | −2.1 | 62.9 | 58.9 | −1.9 |
| Fortified/Functional Cheese | 14.3 | 17.2 | 3.8 | 17.8 | 20.3 | 3.4 |
| Fortified/Functional Milk | 802.3 | 866.8 | 1.6 | 868.8 | 896.5 | 0.7 |
| Fortified/Functional Powder Milk | 59.0 | 61.8 | 0.9 | 62.3 | 65.7 | 1.2 |
| Fortified/Functional Yoghurt | 5,848.5 | 5,909.8 | 0.2 | 5,991.9 | 6,353.7 | 1.5 |
| Fortified/Functional Sweet Biscuits, Snack Bars and Fruit Snacks | 865.6 | 937.5 | 1.6 | 944.9 | 991.7 | 1.1 |
| Fortified/Functional Sweet Biscuits | 203.6 | 230.8 | 2.5 | 232.0 | 241.4 | 0.9 |
| Fortified/Functional Snack Bars | 662.0 | 706.7 | 1.3 | 712.9 | 750.2 | 1.2 |
| Fortified/Functional Vegetable and Seed Oil | 114.2 | 122.4 | 1.4 | 122.8 | 126.5 | 0.7 |
|
Source: Euromonitor International, 2022 *CAGR: Compound annual growth rate |
||||||
FF beverages experienced negative growth than FF packaged food products in market size from 2016 to 2021, with a −0.2% CAGR. But they are expected to grow at a CAGR of 2.0%. FF Plant-based and malt-based hot drinks was the fastest-growing subcategory during the period at a CAGR of 25.6%, reaching US$50.9 million in 2021.
FF Carbonates are expected to grow at a CAGR of 3.1% between 2021 and 2026, followed by FF concentrates at a CAGR of 2.5%, reaching US$49.7 million in 2026.
| Category | 2016 | 2021 | CAGR* % 2016-2021 | 2022 | 2026 | CAGR* % 2021-2026 |
|---|---|---|---|---|---|---|
| Total Fortified/Functional beverages | 7,127.2 |
7,066.5 |
−0.2 | 7,350.9 | 7,800.5 | 2.0 |
| Fortified/Functional Hot Drinks | 24.9 | 59.5 | 19.0 | 47.5 | 30.6 | −12.5 |
| Fortified/Functional Instant Coffee | 1.2 | 1.3 | 1.6 | 1.3 | 1.3 | 0.0 |
| Fortified/Functional Other Hot Drinks | 23.7 | 58.2 | 19.7 | 46.2 | 29.3 | −12.8 |
| Fortified/Functional Chocolate-based Flavoured Powder Drinks | 7.3 | 7.3 | 0.0 | 7.1 | 7.1 | −0.6 |
| Fortified/Functional Plant-based and Malt-based Hot Drinks | 16.3 | 50.9 | 25.6 | 39.1 | 22.2 | −15.3 |
| Fortified/Functional Soft Drinks | 7,102.2 | 7,007.0 | −0.3 | 7,303.4 | 7,769.9 | 2.1 |
| Fortified/Functional Bottled Water | 567.3 | 517.1 | −1.8 | 518.6 | 535.9 | 0.7 |
| Fortified/Functional Carbonates | 751.1 | 643.0 | −3.1 | 699.6 | 750.2 | 3.1 |
| Fortified/Functional Concentrates | 56.8 | 43.9 | −5.0 | 48.3 | 49.7 | 2.5 |
| Fortified/Functional Energy Drinks | 2,413.2 | 2,953.5 | 4.1 | 3,018.0 | 3,296.6 | 2.2 |
| Fortified/Functional Fruit/Vegetable Juice | 358.7 | 321.9 | −2.1 | 342.3 | 346.1 | 1.5 |
| Fortified/Functional RTD Coffee | 88.4 | 66.0 | −5.7 | 67.0 | 66.0 | 0.0 |
| Fortified/Functional RTD Tea | 2.0 | 1.9 | −1.0 | 2.0 | 2.1 | 2.0 |
| Fortified/Functional Sports Drinks | 2,864.8 | 2,459.7 | −3.0 | 2,607.6 | 2,723.3 | 2.1 |
| Regular Sports Drinks | 2,618.6 | 2,243.3 | −3.0 | 2,387.9 | 2,492.2 | 2.1 |
| Reduced Sugar Sports Drinks | 246.2 | 216.4 | −2.5 | 219.7 | 231.1 | 1.3 |
|
Source: Euromonitor International, 2022 *CAGR: Compound annual growth rate |
||||||
Distribution channel
FF foods and beverages were distributed mainly through store-based retailing at 88.7% in 2016 but slightly decreased to 88.3% in 2021. Non-store retailing, though represented 11.3% in 2016, but increased to 11.7% in 2021. Especially the E-Commerce recorded the fastest CAGR growth at 3.2% in actual retail value table or 2.9% in per centage table from 2016 to 2021, reaching US$985.6 million in 2021.
| Channel | 2016 | 2017 | 2018 | 2019 | 2020 | 2021 | CAGR* % 2016-2021 |
|---|---|---|---|---|---|---|---|
| Store-Based Retailing | 16,519.2 | 16,578.4 | 16,749.0 | 16,733.8 | 16,366.6 | 16,586.7 | 0.1 |
| Grocery Retailers | 9,937.6 | 9,935.6 | 10,100.8 | 10,132.2 | 9,835.6 | 10,065.8 | 0.3 |
| Modern Grocery Retailers | 9,663.2 | 9,664.9 | 9,827.1 | 9,859.6 | 9,587.4 | 9,821.6 | 0.3 |
| Convenience Stores | 2,460.3 | 2,435.7 | 2,504.6 | 2,523.8 | 2,321.4 | 2,400.1 | −0.5 |
| Supermarkets | 7,202.9 | 7,229.2 | 7,322.5 | 7,335.8 | 7,266.0 | 7,421.5 | 0.6 |
| Traditional Grocery Retailers | 274.4 | 270.7 | 273.7 | 272.6 | 248.3 | 244.2 | −2.3 |
| Independent Small Grocers | 176.5 | 173.9 | 174.3 | 172.4 | 157.8 | 152.3 | −2.9 |
| Other Grocery Retailers | 98.0 | 96.7 | 99.5 | 100.1 | 90.5 | 91.8 | −1.3 |
| Non-Grocery Specialists | 2,570.1 | 2,631.3 | 2,658.4 | 2,661.0 | 2,639.5 | 2,640.2 | 0.5 |
| Mixed Retailers | 4,011.5 | 4,011.6 | 3,989.7 | 3,940.6 | 3,891.5 | 3,880.7 | −0.7 |
| Non-Store Retailing | 2,094.2 | 2,120.9 | 2,164.0 | 2,182.7 | 2,150.0 | 2,206.6 | 1.1 |
| Vending | 756.0 | 747.2 | 766.9 | 771.3 | 665.4 | 691.2 | −1.8 |
| Homeshopping | 498.0 | 516.4 | 528.8 | 538.2 | 533.5 | 529.8 | 1.2 |
| E-Commerce | 840.2 | 857.2 | 868.3 | 873.2 | 951.2 | 985.6 | 3.2 |
| Total | 18,613.4 | 18,699.3 | 18,913.0 | 18,916.5 | 18,516.7 | 18,793.3 | 0.2 |
|
Source: Euromonitor International, 2022 *CAGR: Compound annual growth rate |
|||||||
| Channel | 2016 | 2017 | 2018 | 2019 | 2020 | 2021 | CAGR* % 2016-2021 |
|---|---|---|---|---|---|---|---|
| Store-Based Retailing | 88.7 | 88.7 | 88.6 | 88.5 | 88.4 | 88.3 | −0.1 |
| Grocery Retailers | 53.4 | 53.1 | 53.4 | 53.6 | 53.1 | 53.6 | 0.1 |
| Modern Grocery Retailers | 51.9 | 51.7 | 52.0 | 52.1 | 51.8 | 52.3 | 0.2 |
| Convenience Stores | 13.2 | 13.0 | 13.2 | 13.3 | 12.5 | 12.8 | −0.6 |
| Supermarkets | 38.7 | 38.7 | 38.7 | 38.8 | 39.2 | 39.5 | 0.4 |
| Traditional Grocery Retailers | 1.5 | 1.4 | 1.4 | 1.4 | 1.3 | 1.3 | −2.8 |
| Independent Small Grocers | 0.9 | 0.9 | 0.9 | 0.9 | 0.9 | 0.8 | −2.3 |
| Other Grocery Retailers | 0.5 | 0.5 | 0.5 | 0.5 | 0.5 | 0.5 | 0.0 |
| Non-Grocery Specialists | 13.8 | 14.1 | 14.1 | 14.1 | 14.3 | 14.0 | 0.3 |
| Mixed Retailers | 21.6 | 21.5 | 21.1 | 20.8 | 21.0 | 20.6 | −0.9 |
| Non-Store Retailing | 11.3 | 11.3 | 11.4 | 11.5 | 11.6 | 11.7 | 0.7 |
| Vending | 4.1 | 4.0 | 4.1 | 4.1 | 3.6 | 3.7 | −2.0 |
| Homeshopping | 2.7 | 2.8 | 2.8 | 2.8 | 2.9 | 2.8 | 0.7 |
| E-Commerce | 4.5 | 4.6 | 4.6 | 4.6 | 5.1 | 5.2 | 2.9 |
| Total | 100.0 | 100.0 | 100.0 | 100.0 | 100.0 | 100.0 | 0.0 |
|
Source: Euromonitor International, 2022 *CAGR: Compound annual growth rate |
|||||||
Top company retail shares
In 2021, leading companies in the FF packaged food category were fairly distributed and included the Yakult Honsha Co Ltd at an 10.4% retail share value, Meiji Holdings Co Ltd (9.2%), and the Otsuka Holdings Co Ltd (8,8%).
| Company Name | 2016 | 2017 | 2018 | 2019 | 2020 | 2021 | CAGR* % 2016-2021 | Market share % 2021 |
|---|---|---|---|---|---|---|---|---|
| Yakult Honsha Co Ltd | 1,903.9 | 1,953.1 | 1,924.8 | 1,900.8 | 1,906.5 | 1,956.4 | 0.5 | 10.4 |
| Meiji Holdings Co Ltd | 1,840.9 | 1,849.6 | 1,780.5 | 1,753.3 | 1,742.0 | 1,737.2 | −1.2 | 9.2 |
| Otsuka Holdings Co Ltd | 1,866.9 | 1,826.4 | 1,883.0 | 1,836.4 | 1,623.7 | 1,645.9 | −2.5 | 8.8 |
| Coca-Cola Co, The | 1,669.8 | 1,623.7 | 1,501.9 | 1,508.8 | 1,340.2 | 1,399.7 | −3.5 | 7.4 |
| Suntory Holdings Ltd | 897.5 | 904.1 | 946.1 | 932.3 | 926.1 | 912.9 | 0.3 | 4.9 |
| Monster Beverage Corp | 285.9 | 330.6 | 425.2 | 548.9 | 672.6 | 700.9 | 19.6 | 3.7 |
| Megmilk Snow Brand Co Ltd | 577.9 | 597.8 | 617.2 | 619.3 | 608.3 | 622.7 | 1.5 | 3.3 |
| Asahi Group Holdings Ltd | 546.2 | 520.3 | 515.3 | 546.3 | 590.6 | 614.5 | 2.4 | 3.3 |
| Kirin Holdings Co Ltd | 376.8 | 325.8 | 398.0 | 421.4 | 416.6 | 439.1 | 3.1 | 2.3 |
| Lotte Group | 503.7 | 495.8 | 499.6 | 500.9 | 405.8 | 410.8 | −4.0 | 2.2 |
|
Source: Euromonitor International, 2021 *CAGR: Compound annual growth rate |
||||||||
Top leaders within the FF drink category included Coca-Cola Co, 18.6%, followed by Suntory Holdings Ltd (16.0%), and Asahi Group Holdings Ltd (14.4%) in 2021.
| Company Name | 2016 | 2017 | 2018 | 2019 | 2020 | 2021 | CAGR* % 2016-2021 | Market share % 2021 |
|---|---|---|---|---|---|---|---|---|
| Coca-Cola Co, The | 6,036.1 | 6,151.2 | 6,074.6 | 6,041.2 | 5,552.0 | 5,940.3 | −0.3 | 18.6 |
| Suntory Holdings Ltd | 4,871.2 | 5,072.1 | 5,228.1 | 5,328.1 | 5,139.3 | 5,092.9 | 0.9 | 16.0 |
| ITO EN Ltd | 4,637.2 | 4,683.6 | 4,848.5 | 4,843.6 | 4,540.8 | 4,594.8 | −0.2 | 14.4 |
| Asahi Group Holdings Ltd | 2,583.3 | 2,505.6 | 2,653.5 | 2,540.8 | 2,267.5 | 2,307.4 | −2.2 | 7.2 |
| Kirin Holdings Co Ltd | 1,797.4 | 1,789.6 | 1,887.7 | 1,864.7 | 1,710.7 | 1,718.8 | −0.9 | 5.4 |
| Otsuka Holdings Co Ltd | 1,696.3 | 1,650.6 | 1,699.4 | 1,661.5 | 1,458.6 | 1,483.8 | −2.6 | 4.7 |
| Kagome Co Ltd | 1,130.7 | 1,235.5 | 1,251.3 | 1,263.4 | 1,287.1 | 1,315.6 | 3.1 | 4.1 |
| Monster Beverage Corp | 285.9 | 330.6 | 425.2 | 548.9 | 672.6 | 700.9 | 19.6 | 2.2 |
| PepsiCo Inc | 741.5 | 582.6 | 527.8 | 509.6 | 461.6 | 481.6 | −8.3 | 1.5 |
| Red Bull GmbH | 394.0 | 400.3 | 463.3 | 453.0 | 408.5 | 367.9 | −1.4 | 1.2 |
|
Source: Euromonitor International, 2022 *CAGR: Compound annual growth rate |
||||||||
New product launch analysis
According to Mintel's Global New Products Database (GNPD), there were 5,843 launches of functional food and beverage products in Japan between January 2017 and December 2021. Among which, 3,981 were functional food, 1,853 were functional drink.
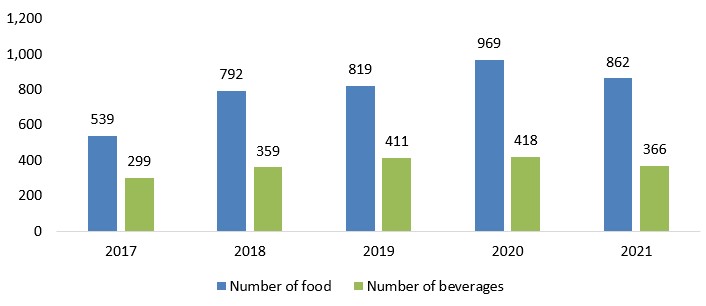
Description of above image
| Date Published | Number of functional food | Number of functional beverages |
|---|---|---|
| 2017 | 539 | 299 |
| 2018 | 792 | 359 |
| 2019 | 819 | 411 |
| 2020 | 969 | 418 |
| 2021 | 862 | 366 |
| Total Sample | 3,981 | 1,853 |
Source: Mintel, 2022
In 2021, the top five functional packaged food products manufacturers were located in Japan, Thailand, Netherland, China and South Korea. The top five brands were Topvalu, Nissin York Tokachi Nomu Yogurt, Glico Sunao, Kanro Puré Gummy and Kanro. The top ingredient claims were vegetable based, domestic, dietary, for baking and top.
| Product attributes | Yearly launch count | ||||
|---|---|---|---|---|---|
| 2017 | 2018 | 2019 | 2020 | 2021 | |
| Top five flavours | |||||
| Unflavoured/Plain | 102 | 189 | 165 | 215 | 161 |
| Chocolate | 19 | 32 | 47 | 51 | 57 |
| Mint | 42 | 49 | 36 | 42 | 34 |
| Lemon | 21 | 45 | 46 | 48 | 35 |
| Strawberry | 20 | 31 | 42 | 55 | 39 |
| Top five locations of manufacture | |||||
| Japan | 77 | 100 | 69 | 109 | 98 |
| Thailand | 5 | 7 | 4 | 6 | 9 |
| Netherlands | 3 | 1 | 1 | 2 | 8 |
| China | 0 | 3 | 1 | 0 | 2 |
| South Korea | 1 | 0 | 1 | 2 | 2 |
| Top five brands | |||||
| Topvalu | 8 | 13 | 19 | 22 | 9 |
| Nissin York Tokachi Nomu Yogurt | 6 | 9 | 13 | 18 | 12 |
| Glico Sunao | 6 | 7 | 8 | 21 | 14 |
| Kanro Puré Gummy | 7 | 6 | 13 | 11 | 11 |
| Kanro | 10 | 14 | 10 | 7 | 6 |
| Top five launch types | |||||
| New Variety/Range Extension | 220 | 300 | 281 | 342 | 273 |
| Relaunch | 144 | 214 | 255 | 329 | 331 |
| New Packaging | 98 | 197 | 164 | 157 | 170 |
| New Product | 74 | 80 | 119 | 141 | 87 |
| New Formulation | 3 | 1 | 0 | 0 | 1 |
| Top five categories | |||||
| Dairy | 95 | 211 | 213 | 238 | 187 |
| Sugar and Gum Confectionery | 135 | 182 | 203 | 210 | 176 |
| Meals and Meal Centers | 51 | 52 | 44 | 105 | 142 |
| Snacks | 49 | 70 | 64 | 97 | 84 |
| Bakery | 38 | 65 | 67 | 47 | 60 |
| Top ingredient claims | |||||
| Vegetable Based | 227 | 318 | 322 | 443 | 429 |
| Domestic | 23 | 40 | 108 | 311 | 516 |
| Dietary | 53 | 51 | 76 | 95 | 89 |
| For Baking | 32 | 54 | 65 | 68 | 87 |
| Top | 25 | 39 | 31 | 92 | 106 |
| Source: Mintel, 2022 | |||||
In 2021, the top five manufacturers of the functional beverages were located in Japan, China, South Korea, German and Singapore. The top five brands were Kagome Yasai Seikatsu 100, Meiji Savas, Topvalu, Sujahta Meiraku Kazoku No Uruoi and Asahi Style Balance. The top ingredient claims were vegetable based, domestic, dietary, green and imported.
| Product attributes | Yearly launch count | ||||
|---|---|---|---|---|---|
| 2017 | 2018 | 2019 | 2020 | 2021 | |
| Top five flavours | |||||
| Unflavoured/Plain | 56 | 47 | 68 | 70 | 72 |
| Lemon | 30 | 47 | 40 | 61 | 44 |
| Fruit | 11 | 18 | 24 | 34 | 16 |
| Yogurt/Yoghurt | 15 | 12 | 19 | 28 | 11 |
| Apple | 20 | 9 | 16 | 14 | 17 |
| Top five locations of manufacture | |||||
| Japan | 96 | 110 | 128 | 117 | 131 |
| China | 0 | 0 | 1 | 1 | 3 |
| South Korea | 0 | 0 | 0 | 2 | 3 |
| Germany | 0 | 0 | 0 | 0 | 3 |
| Singapore | 0 | 0 | 0 | 1 | 0 |
| Top five brands | |||||
| Kagome Yasai Seikatsu 100 | 2 | 15 | 26 | 22 | 33 |
| Meiji Savas | 5 | 11 | 16 | 13 | 3 |
| Topvalu | 1 | 3 | 8 | 13 | 4 |
| Sujahta Meiraku Kazoku No Uruoi | 0 | 2 | 6 | 9 | 10 |
| Asahi Style Balance | 5 | 8 | 9 | 5 | 0 |
| Top five launch types | |||||
| New Variety/Range Extension | 141 | 115 | 145 | 126 | 97 |
| Relaunch | 57 | 133 | 126 | 167 | 110 |
| New Packaging | 52 | 74 | 74 | 76 | 86 |
| New Product | 48 | 37 | 66 | 49 | 73 |
| New Formulation | 1 | 0 | 0 | 0 | 0 |
| Top five categories | |||||
| Juice Drinks | 73 | 132 | 113 | 115 | 107 |
| Nutritional Drinks and Other Beverages | 90 | 87 | 101 | 118 | 96 |
| Sports and Energy Drinks | 40 | 47 | 68 | 64 | 60 |
| RTDs | 33 | 29 | 45 | 39 | 38 |
| Carbonated Soft Drinks | 34 | 34 | 48 | 35 | 26 |
| Top ingredient claims | |||||
| Vegetable Based | 35 | 77 | 88 | 88 | 86 |
| Domestic | 15 | 14 | 46 | 129 | 148 |
| Dietary | 52 | 53 | 55 | 50 | 41 |
| Green | 44 | 32 | 38 | 37 | 34 |
| Imported | 0 | 0 | 18 | 23 | 23 |
| Source: Mintel, 2022 | |||||
Examples of new product launches
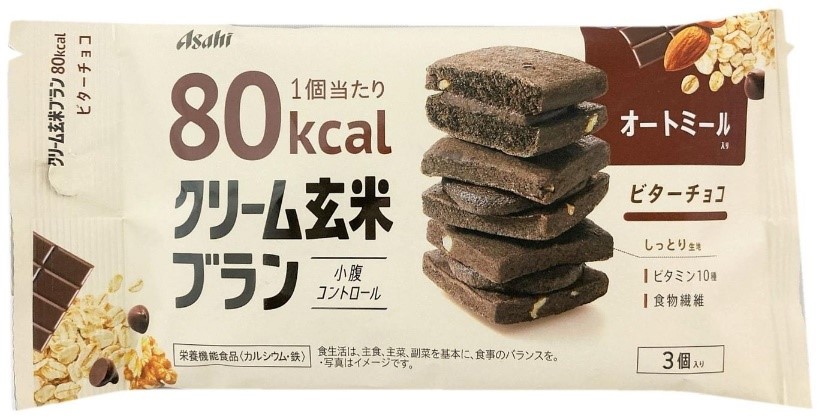
Bitter Chocolate Cream Biscuit
Source: Mintel, 2022
| Company | Asahi Group Foods |
|---|---|
| Manufacturer | Beigyokudo Shokuhin |
| Distributor | Asahi Group Foods |
| Brand | Asahi Cream Genmai Bran 80kcal |
| Category | Bakery |
| Sub-category | Sweet biscuits / cookies |
| Market | Japan |
| Store type | Convenience Store |
| Date published | October 2021 |
| Launch type | New product |
| Price in local currency | JPY178.00 |
| Price in US dollars | 1.58 |
| Price in Euros | 1.37 |
Asahi Cream Genmai Bran 80kcal Bitter Chocolate Cream Biscuit is now available. The moist biscuits are made with oatmeal to enhance satiety and contain 10 vitamins, dietary fibre, added calcium for bones and teeth, and fortified iron, which is important for the formation of red blood cells. The product provides only 80kcal per unit and retails in a 54 gram pack with three units. Launched on October 11, 2021. Recommended retail price not available.
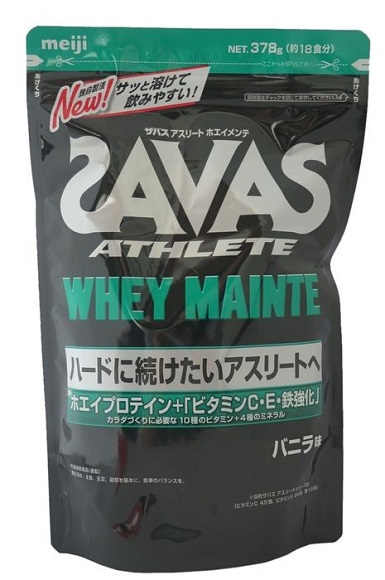
Vanilla Flavour Protein Powder
Source: Mintel, 2022
| Company | Meiji |
|---|---|
| Manufacturer | Meiji |
| Brand | Meiji Savas Athlete Whey Mainte |
| Category | Nutritional drinks and other beverages |
| Sub-category | Nutritional and meal replacement drinks |
| Market | Japan |
| Import status | Not imported |
| Store type | Drug store / pharmacy |
| Date published | April 2021 |
| Launch type | New product |
| Price in local currency | JPY3618.00 |
| Price in US dollars | 33.11 |
| Price in Euros | 28.16 |
Meiji Savas Athlete Whey Mainte Vanilla Flavour Protein Powder is now available. This product is said to be for athletes who want to keep training hard for an extended time and contains whey protein as well as ten vitamins and four minerals which are necessary when body building. It has an amino acid score of 100 and contains 4.5 times more vitamin C, 3.4 times more vitamin E and 1.5 times more iron than Meiji Savas Athlete protein powders, as well as six B vitamins, vitamins A and D, zinc, calcium and magnesium. It contains 75% protein, comprising 100% whey which is easily absorbable and said to be ideal for protein intake directly after training. The zinc is said to support eyesight but is also useful in the metabolism of proteins and nucleic acids and to support the health of the skin and mucous membranes. The product is said to dissolve quickly and to be easy to drink, and can also be eaten with breakfast, after a meal, or one hour before bed. It can be prepared by mixing 21 grams with 300 millilitres water or milk and retails in a 378 gram pack with a zipper, sufficient for 18 portions, containing a spoon and featuring a QR code. Launched in March, 2021, with a recommended retail price of 3,564 yen.
Mixed Yellow Peach & Valencia Orange Smoothie

Source: Mintel, 2022
| Company | Kagome |
|---|---|
| Brand | Kagome Yasai Seikatsu 100 |
| Category | Juice drinks |
| Sub-category | Juice |
| Store name | Sanwa |
| Store type | Supermarket |
| Date published | November 2021 |
| Launch type | New packaging |
| Price in local currency | JPY516.00 |
| Price in US dollars | 4.53 |
Kagome Yasai Seikatsu 100 Mixed Yellow Peach & Valencia Orange Smoothie has been repackaged in a 1,000 gram pack featuring the FSC Mix and Go with Green logos. This sweet and sour drink is made with 14 vegetables or 51% vegetable juice, providing half the recommended daily intake, and five fruits or 48% fruit juice. It is high in dietary fibre and vitamins B2, B12, C and E, and is free from added sugar, added salt, sweeteners, thickeners and preservatives. Launched on October 5, 2021. Recommended retail price not available.
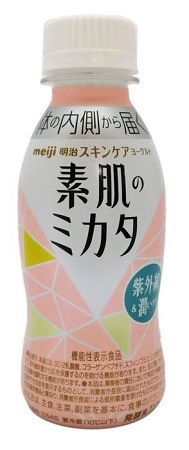
Yogurt Drink for Skin Care
Source: Mintel, 2022
| Company | Meiji |
|---|---|
| Brand | Meiji Suhada No Mikata |
| Category | Dairy |
| Sub-category | Drinking yogurt and liquid cultured milk |
| Store name | Sanwa |
| Store type | Supermarket |
| Date published | November 2021 |
| Launch type | Relaunch |
| Price in local currency | JPY135.00 |
| Price in US dollars | 1.19 |
Meiji Suhada No Mikata Yogurt Drink for Skin Care has been relaunched. This FFC-certified drink is formulated with SC-2 lactic acid bacteria, collagen peptides and sphingomyelin to help protect skin against UV rays and retain moisture in skin. The product has a 0.5% milk fat content and retails in a 112 millilire bottle. Launched in September, 2021. Recommended retail price not available.
For more information
The Canadian Trade Commissioner Service:
International Trade Commissioners can provide Canadian industry with on-the-ground expertise regarding market potential, current conditions and local business contacts, and are an excellent point of contact for export advice.
More agri-food market intelligence:
International agri-food market intelligence
Discover global agriculture and food opportunities, the complete library of Global Analysis reports, market trends and forecasts, and information on Canada's free trade agreements.
Agri-food market intelligence service
Canadian agri-food and seafood businesses can take advantage of a customized service of reports and analysis, and join our email subscription service to have the latest reports delivered directly to their inbox.
More on Canada's agriculture and agri-food sectors:
Canada's agriculture sectors
Information on the agriculture industry by sector. Data on international markets. Initiatives to support awareness of the industry in Canada. How the department engages with the industry.
For additional information on FoodEx Japan 2023, please contact:
Ben Berry, Deputy Director
Trade Show Strategy and Delivery
Agriculture and agri-food Canada
ben.berry@agr.gc.ca
Resources
- Euromonitor International. 2022
- Mintel Global New Products Database, 2022
Health and Wellness Series – Functional foods and beverages in Japan
Global Analysis Report
Prepared by: Hongli, Wang, Market Analyst
© His Majesty the King in Right of Canada, represented by the Minister of Agriculture and Agri-Food (2023).
Photo credits
All photographs reproduced in this publication are used by permission of the rights holders.
All images, unless otherwise noted, are copyright His Majesty the King in Right of Canada.
To join our distribution list or to suggest additional report topics or markets, please contact:
Agriculture and Agri-Food Canada, Global Analysis1341 Baseline Rd, Tower 5, 3rd floor
Ottawa ON K1A 0C5
Canada
Email: aafc.mas-sam.aac@agr.gc.ca
The Government of Canada has prepared this report based on primary and secondary sources of information. Although every effort has been made to ensure that the information is accurate, Agriculture and Agri-Food Canada (AAFC) assumes no liability for any actions taken based on the information contained herein.
Reproduction or redistribution of this document, in whole or in part, must include acknowledgement of agriculture and agri-food Canada as the owner of the copyright in the document, through a reference citing AAFC, the title of the document and the year. Where the reproduction or redistribution includes data from this document, it must also include an acknowledgement of the specific data source(s), as noted in this document.
Agriculture and Agri-Food Canada provides this document and other report services to agriculture and food industry clients free of charge.