

Note: This report includes forecasting data that is based on baseline historical data.
Executive summary
Natural sweet biscuits, snack bars and fruit snacks reached US$2,113.1 million in 2022 and the compound annual growth rate (CAGR) is 6.7% from 2019 to 2022.
Natural confectionery reached US$1,763.5 million in 2022 and the CAGR is 14.3% from 2019 to 2022. Annual growth 2021 to 2022 of was 15.2% and total growth 2019 to 2022 was 49.2%.
Natural savoury snacks reached US$2,694.8 million in 2022 and the CAGR is 7.2% from 2019 to 2022. Annual growth 2021 to 2022 of was 5.2% and total growth 2019 to 2022 was 23.3%.
Natural baby food reached US$415.8 million in 2022 and the CAGR is 2.6% from 2019 to 2022. Annual growth 2021 to 2022 of was −15.5% and total growth 2019 to 2022 was 7.9%.
Natural drinking milk products reached US$850.3 million in 2022 and the CAGR is 20.4% from 2019 to 2022. Annual growth 2021 to 2022 of was 18.8% and total growth 2019 to 2022 was 74.5%.
Natural meals and soups reached US$1,922.3 million in 2022 and the CAGR is 2.1% from 2019 to 2022. Annual growth 2021 to 2022 of was −1.8% and total growth 2019 to 2022 was 6.4%.
Natural sweet spreads reached US$1,189.0 million in 2022 and the CAGR is 7.2% from 2019 to 2022. Annual growth 2021 to 2022 of was 7.0% and total growth 2019 to 2022 was 23.3%.
Natural baked goods reached US$2,110.7 million in 2022 and the CAGR is 7.9% from 2019 to 2022. Annual growth 2021 to 2022 of was −0.3% and total growth 2019 to 2022 was 25.5%.
Natural processed meat, seafood and alternatives to meat reached US$6,250.0 million in 2022 and the CAGR is 15.1% from 2019 to 2022.
Retail sales of natural food
Health and wellness (H&W) are the combination of fortified/functional (FF) food and beverages, natural food and beverages, health benefit food and beverages, better for you (BFY) food, organic food and beverages, and beverages and food intolerance products.
This report is focusing on natural food and beverages in the H&W group. Natural sweet biscuits, snack bars and fruit snacks reached US$2,113.1 million in 2022 and the compound annual growth rate (CAGR) is 6.7% from 2019 to 2022. Annual growth 2021 to 2022 of was 7.9% and total growth 2019 to 2022 was 21.6%. Natural snack bars have the negative CAGR growth −2.5% while natural sweet biscuits record the highest CAGR growth 17.4% from 2019 to 2022.
| Category | 2019 | 2020 | 2021 | 2022 | CAGR* % 2019-2022 | Annual growth (%) 2021-2022 | Total growth (%) 2019-2022 |
|---|---|---|---|---|---|---|---|
| Natural Sweet Biscuits, Snack Bars and Fruit Snacks | 1,737.3 | 1,779.1 | 1,958.4 | 2,113.1 | 6.7 | 7.9 | 21.6 |
| Natural Fruit Snacks | 326.1 | 375.2 | 450.8 | 518.8 | 16.7 | 15.1 | 59.1 |
| Natural Snack Bars | 997.5 | 826.3 | 893.4 | 924.9 | −2.5 | 3.5 | −7.3 |
| Natural Sweet Biscuits | 413.6 | 577.7 | 614.2 | 669.4 | 17.4 | 9.0 | 61.8 |
|
Source: Euromonitor International, 2023 *CAGR: Compound annual growth rate |
|||||||
The CAGR of the natural sweet biscuits, snack bars and fruit snacks are 6.6% from 2022 to 2027. Annual growth 2022 to 2023 of was 9.5% and total growth 2022 to 2027 was 37.7%. Natural snack bars are projected to have the highest CAGR growth 8.8% from 2022 to 2027.
| Category | 2023 | 2024 | 2025 | 2026 | 2027 | CAGR* % 2022-2027 | Annual growth (%) 2022-2023 | Total growth (%) 2022-2027 |
|---|---|---|---|---|---|---|---|---|
| Natural Sweet Biscuits, Snack Bars and Fruit Snacks | 2,314.2 | 2,435.9 | 2,585.6 | 2,743.1 | 2,909.6 | 6.6 | 9.5 | 37.7 |
| Natural Fruit Snacks | 561.8 | 593.6 | 630.0 | 668.6 | 713.0 | 6.6 | 8.3 | 37.4 |
| Natural Snack Bars | 1,045.8 | 1,118.8 | 1,211.7 | 1,309.9 | 1,409.3 | 8.8 | 13.1 | 52.4 |
| Natural Sweet Biscuits | 706.6 | 723.4 | 743.8 | 764.6 | 787.3 | 3.3 | 5.6 | 17.6 |
|
Source: Euromonitor International, 2023 *CAGR: Compound annual growth rate |
||||||||
Natural confectionery reached US$1,763.5 million in 2022 and the CAGR is 14.3% from 2019 to 2022. Annual growth 2021 to 2022 was 15.2% and total growth 2019 to 2022 was 49.2%. Natural gum has a negative CAGR growth of −12.1% from 2019 to 2022 while natural sugar confectionery has the biggest growth of 21.0%.
| Category | 2019 | 2020 | 2021 | 2022 | CAGR* % 2019-2022 | Annual growth (%) 2021-2022 | Total growth (%) 2019-2022 |
|---|---|---|---|---|---|---|---|
| Natural Confectionery | 1,181.9 | 1,262.2 | 1,531.2 | 1,763.5 | 14.3 | 15.2 | 49.2 |
| Natural Chocolate Confectionery | 467.9 | 478.2 | 514.9 | 570.8 | 6.9 | 10.9 | 22.0 |
| Natural Gum | 78.7 | 58.1 | 74.7 | 53.5 | −12.1 | −28.4 | −32.0 |
| Natural Sugar Confectionery | 635.3 | 725.9 | 941.6 | 1,139.3 | 21.5 | 21.0 | 79.3 |
|
Source: Euromonitor International, 2023 *CAGR: Compound annual growth rate |
|||||||
The CAGR of the natural confectionery is 5.3% from 2022 to 2027. Annual growth 2022 to 2023 of was 7.7% and total growth 2022 to 2027 was 29.3%. Natural gum is projected to record the highest CAGR growth of 8.9% from 2022 to 2027.
| Category | 2023 | 2024 | 2025 | 2026 | 2027 | CAGR* % 2022-2027 | Annual growth (%) 2022-2023 | Total growth (%) 2022-2027 |
|---|---|---|---|---|---|---|---|---|
| Natural Confectionery | 1,900.1 | 2,002.7 | 2,101.5 | 2,192.9 | 2,280.7 | 5.3 | 7.7 | 29.3 |
| Natural Chocolate Confectionery | 618.6 | 650.4 | 674.9 | 695.9 | 716.7 | 4.7 | 8.4 | 25.6 |
| Natural Gum | 57.1 | 61.4 | 68.6 | 75.7 | 81.8 | 8.9 | 6.7 | 52.9 |
| Natural Sugar Confectionery | 1,224.4 | 1,290.9 | 1,358.0 | 1,421.3 | 1,482.2 | 5.4 | 7.5 | 30.1 |
|
Source: Euromonitor International, 2023 *CAGR: Compound annual growth rate |
||||||||
Natural savoury snacks reached US$2,694.8 million in 2022 and the CAGR is 7.2% from 2019 to 2022. Annual growth 2021 to 2022 of was 5.2% and total growth 2019 to 2022 was 23.3%. Natural popcorn has the biggest CAGR growth of 15.0% followed by natural pretzels at a CAGR of 14.3% from 2019 to 2022.
| Category | 2019 | 2020 | 2021 | 2022 | CAGR* % 2019-2022 | Annual growth (%) 2021-2022 | Total growth (%) 2019-2022 |
|---|---|---|---|---|---|---|---|
| Natural Savoury Snacks | 2,185.6 | 2,594.8 | 2,561.4 | 2,694.8 | 7.2 | 5.2 | 23.3 |
| Natural Nuts, Seeds and Trail Mixes | 631.3 | 700.3 | 672.4 | 708.7 | 3.9 | 5.4 | 12.3 |
| Natural Salty Snacks | 607.6 | 796.7 | 679.2 | 729.2 | 6.3 | 7.4 | 20.0 |
| Natural Savour Biscuits | 436.9 | 492.5 | 575.9 | 550.2 | 8.0 | −4.5 | 25.9 |
| Natural Popcorn | 351.8 | 440.7 | 494.6 | 535.4 | 15.0 | 8.2 | 52.2 |
| Natural Pretzels | 26.4 | 28.8 | 27.2 | 39.4 | 14.3 | 44.9 | 49.2 |
| Natural Meat, Seafood and Other Savoury Snacks | 131.5 | 135.8 | 112.1 | 132.0 | 0.1 | 17.8 | 0.4 |
|
Source: Euromonitor International, 2023 *CAGR: Compound annual growth rate |
|||||||
The CAGR of the natural savoury snacks is 2.9% from 2022 to 2027. Annual growth 2022 to 2023 of was 5.9% and total growth 2022 to 2027 was 15.5%. Natural meat, seafood and other savoury snacks are projected to record the highest CAGR growth of 6.7% from 2022 to 2027.
| Category | 2023 | 2024 | 2025 | 2026 | 2027 | CAGR* % 2022-2027 | Annual growth (%) 2022-2023 | Total growth (%) 2022-2027 |
|---|---|---|---|---|---|---|---|---|
| Natural Savoury Snacks | 2,855.1 | 2,951.3 | 3,017.9 | 3,065.5 | 3,111.5 | 2.9 | 5.9 | 15.5 |
| Natural Nuts, Seeds and Trail Mixes | 720.1 | 732.6 | 737.2 | 737.1 | 736.1 | 0.8 | 1.6 | 3.9 |
| Natural Salty Snacks | 800.3 | 854.6 | 884.6 | 901.4 | 915.4 | 4.7 | 9.8 | 25.5 |
| Natural Savoury Biscuits | 567.1 | 564.5 | 572.9 | 582.7 | 590.0 | 1.4 | 3.1 | 7.2 |
| Natural Popcorn | 583.9 | 605.8 | 618.7 | 629.0 | 644.8 | 3.8 | 9.1 | 20.4 |
| Natural Pretzels | 39.6 | 39.8 | 40.8 | 41.9 | 43.0 | 1.8 | 0.5 | 9.1 |
| Natural Meat, Seafood and Other Savoury Snacks | 144.1 | 154.0 | 163.7 | 173.4 | 182.2 | 6.7 | 9.2 | 38.0 |
|
Source: Euromonitor International, 2023 *CAGR: Compound annual growth rate |
||||||||
Natural baby food reached US$415.8 million in 2022 and the CAGR is 2.6% from 2019 to 2022. Annual growth 2021-2022 of was −15.5% and total growth 2019 to 2022 was 7.9%. Natural prepared baby food has the biggest growth of 12.3% while the other three subcategory: natural dried baby food (−9.0%), natural other baby food (−3.3%) and natural milk formula (−11.2%) all have negative CAGR growths.
| Category | 2019 | 2020 | 2021 | 2022 | CAGR* % 2019-2022 | Annual growth (%) 2021-2022 | Total growth (%) 2019-2022 |
|---|---|---|---|---|---|---|---|
| Natural Baby Food | 385.5 | 421.7 | 491.9 | 415.8 | 2.6 | −15.5 | 7.9 |
| Natural Dried Baby Food | 11.0 | 8.6 | 13.2 | 8.3 | −9.0 | −37.1 | −24.5 |
| Natural Prepared Baby Food | 185.1 | 242.2 | 267.7 | 262.4 | 12.3 | −2.0 | 41.8 |
| Natural Other Baby Food | 60.6 | 55.5 | 69.1 | 54.8 | −3.3 | −20.7 | −9.6 |
| Natural Milk Formula | 128.8 | 115.4 | 142.0 | 90.3 | −11.2 | −36.4 | −29.9 |
|
Source: Euromonitor International, 2023 *CAGR: Compound annual growth rate |
|||||||
The CAGR of the natural baby food is projected to be −2.0% from 2022 to 2027. Annual growth 2022 to 2023 of was 2.6% and total growth 2022 to 2027 was −9.5%. Natural dried baby food is projected to record the highest CAGR growth of 9.2% from 2022 to 2027 followed by natural other baby food at a CAGR of 6.1%.
| Category | 2023 | 2024 | 2025 | 2026 | 2027 | CAGR* % 2022-2027 | Annual growth (%) 2022-2023 | Total growth (%) 2022-2027 |
|---|---|---|---|---|---|---|---|---|
| Natural Baby Food | 426.8 | 414.9 | 392.4 | 378.1 | 376.2 | −2.0 | 2.6 | −9.5 |
| Natural Dried Baby Food | 10.4 | 11.4 | 12.0 | 12.4 | 12.9 | 9.2 | 25.3 | 55.4 |
| Natural Prepared Baby Food | 277.8 | 284.6 | 274.1 | 263.9 | 263.5 | 0.1 | 5.9 | 0.4 |
| Natural Other Baby Food | 59.0 | 62.5 | 66.3 | 70.0 | 73.6 | 6.1 | 7.7 | 34.3 |
| Natural Milk Formula | 79.7 | 56.5 | 40.1 | 31.8 | 26.3 | −21.9 | −11.7 | −70.9 |
|
Source: Euromonitor International, 2023 *CAGR: Compound annual growth rate |
||||||||
Natural drinking milk products reached US$850.3 million in 2022 and the CAGR is 20.4% from 2019 to 2022. Annual growth 2021-2022 was 18.8% and total growth 2019 to 2022 was 74.5%. Natural Yoghurt and Sour Milk Products reached US$2,472.3 million in 2022 and the CAGR is 7.2% from 2019 to 2022. Annual growth 2021-2022 of was 6.8% and total growth 2019 to 2022 was 23.2%. Natural Other Dairy reached US$1,865.6 million in 2022 and the CAGR is 14.7% from 2019 to 2022. Annual growth 2021-2022 of was 5.0% and total growth 2019 to 2022 was 50.9%.
| Category | 2019 | 2020 | 2021 | 2022 | CAGR* % 2019-2022 | Annual growth (%) 2021-2022 | Total growth (%) 2019-2022 |
|---|---|---|---|---|---|---|---|
| Natural Drinking Milk Products | 487.2 | 579.8 | 715.5 | 850.3 | 20.4 | 18.8 | 74.5 |
| Flavoured Milk Drinks | 406.3 | 465.7 | 547.3 | 662.5 | 17.7 | 21.0 | 63.1 |
| Natural Plant-based Milk | 80.8 | 114.1 | 168.2 | 187.8 | 32.5 | 11.7 | 132.4 |
| Natural Yoghurt and Sour Milk Products | 2,006.9 | 2,149.3 | 2,315.5 | 2,472.3 | 7.2 | 6.8 | 23.2 |
| Natural Sour Milk products | 51.6 | 47.6 | 57.2 | 41.7 | −6.9 | −27.1 | −19.2 |
| Natural Yoghurt | 1,955.3 | 2,101.7 | 2,258.2 | 2,430.7 | 7.5 | 7.6 | 24.3 |
| Natural Other Dairy | 1,236.4 | 1,609.6 | 1,776.7 | 1,865.6 | 14.7 | 5.0 | 50.9 |
| Natural Chilled and Shelf Stable Desserts | 10.8 | 9.1 | 22.5 | 19.9 | 22.6 | −11.6 | 84.3 |
| Natural Coffee Whiteners | 534.1 | 739.9 | 923.0 | 941.9 | 20.8 | 2.0 | 76.4 |
| Natural Cream | 691.5 | 860.6 | 831.3 | 903.8 | 9.3 | 8.7 | 30.7 |
|
Source: Euromonitor International, 2023 *CAGR: Compound annual growth rate |
|||||||
The CAGR of drinking milk products is projected to be −4.5% from 2022 to 2027. Annual growth 2022 to 2023 of was 1.1% and total growth 2022 to 2027 was −20.5%. Natural Yoghurt and Sour Milk Products are projected to grow at a CAGR of 2.3%. Annual growth 2022 to 2023 of was 3.4% and total growth 2022 to 2027 was 11.8%. Natural Other Dairy is projected to grow at a CAGR of 6.0%. Annual growth 2022 to 2023 of was 8.1% and total growth 2022 to 2027 was 34.0%.
| Category | 2023 | 2024 | 2025 | 2026 | 2027 | CAGR* % 2022-2027 | Annual growth (%) 2022-2023 | Total growth (%) 2022-2027 |
|---|---|---|---|---|---|---|---|---|
| Natural Drinking Milk Products | 859.4 | 827.7 | 776.4 | 716.3 | 675.8 | −4.5 | 1.1 | −20.5 |
| Flavoured Milk Drinks | 663.5 | 632.6 | 583.4 | 527.9 | 493.0 | −5.7 | 0.2 | −25.6 |
| Natural Plant-based Milk | 195.9 | 195.1 | 193.0 | 188.4 | 182.8 | −0.5 | 4.3 | −2.7 |
| Natural Yoghurt and Sour Milk Products | 2,556.0 | 2,603.2 | 2,651.7 | 2,704.8 | 2,763.6 | 2.3 | 3.4 | 11.8 |
| Natural Sour Milk products | 43.2 | 44.2 | 42.8 | 40.7 | 38.6 | −1.5 | 3.6 | −7.4 |
| Natural Yoghurt | 2,512.8 | 2,559.0 | 2,608.9 | 2,664.1 | 2,725.0 | 2.3 | 3.4 | 12.1 |
| Natural Other Dairy | 2,016.8 | 2,142.8 | 2,261.6 | 2,377.5 | 2,500.5 | 6.0 | 8.1 | 34.0 |
| Natural Chilled and Shelf Stable Desserts | 18.9 | 15.7 | 10.4 | 5.7 | 3.7 | −28.6 | −5.0 | −81.4 |
| Natural Coffee Whiteners | 987.3 | 1,035.9 | 1,085.9 | 1,138.4 | 1,193.2 | 4.8 | 4.8 | 26.7 |
| Natural Cream | 1,010.6 | 1,091.2 | 1,165.3 | 1,233.3 | 1,303.6 | 7.6 | 11.8 | 44.2 |
|
Source: Euromonitor International, 2023 *CAGR: Compound annual growth rate |
||||||||
Natural meals and soups reached US$1,922.3 million in 2022 and the CAGR is 2.1% from 2019 to 2022. Annual growth 2021 to 2022 of was −1.8% and total growth 2019 to 2022 was 6.4%. Natural pizza has the biggest growth of 6.1% while natural prepared salads have the lowest growth of −4.6% from 2019 to 2022.
| Category | 2019 | 2020 | 2021 | 2022 | CAGR* % 2019-2022 | Annual growth (%) 2021-2022 | Total growth (%) 2019-2022 |
|---|---|---|---|---|---|---|---|
| Natural Meals and Soups | 1,806.7 | 2,139.7 | 1,958.4 | 1,922.3 | 2.1 | −1.8 | 6.4 |
| Natural Ready Meals | 1,136.1 | 1,373.2 | 1,334.9 | 1,274.1 | 3.9 | −4.6 | 12.1 |
| Natural Soup | 452.8 | 547.0 | 404.0 | 404.4 | −3.7 | 0.1 | −10.7 |
| Natural Pizza | 168.1 | 193.0 | 206.4 | 200.7 | 6.1 | −2.8 | 19.4 |
| Natural Prepared Salads | 49.7 | 26.6 | 13.1 | 43.2 | −4.6 | 229.8 | −13.1 |
|
Source: Euromonitor International, 2023 *CAGR: Compound annual growth rate |
|||||||
The CAGR of the natural meals and soups are projected to be 0.4% from 2022 to 2027. Annual growth 2022 to 2023 of was −0.9% and total growth 2022 to 2027 was 1.9%. Natural soup is projected to record the highest CAGR growth of 3.0% while natural prepared salads are projected to be slowest growth of −8.6% from 2022 to 2027.
| Category | 2023 | 2024 | 2025 | 2026 | 2027 | CAGR* % 2022-2027 | Annual growth (%) 2022-2023 | Total growth (%) 2022-2027 |
|---|---|---|---|---|---|---|---|---|
| Natural Meals and Soups | 1,905.7 | 1,849.3 | 1,862.4 | 1,902.5 | 1,959.7 | 0.4 | −0.9 | 1.9 |
| Natural Ready Meals | 1,264.8 | 1,229.9 | 1,246.9 | 1,278.1 | 1,319.6 | 0.7 | −0.7 | 3.6 |
| Natural Soup | 418.4 | 425.9 | 437.7 | 451.9 | 469.6 | 3.0 | 3.5 | 16.1 |
| Natural Pizza | 179.7 | 155.6 | 143.2 | 140.0 | 142.9 | −6.6 | −10.5 | −28.8 |
| Natural Prepared Salads | 42.8 | 38.0 | 34.7 | 32.6 | 27.6 | −8.6 | −0.9 | −36.1 |
|
Source: Euromonitor International, 2023 *CAGR: Compound annual growth rate |
||||||||
Natural sweet spreads reached US$1,189.0 million in 2022 and the CAGR is 7.2% from 2019 to 2022. Annual growth 2021-2022 of was 7.0% and total growth 2019 to 2022 was 23.3%. Natural Nut and Seed
Based Spreads has the biggest CAGR growth of 7.9% followed by natural jams and preserves at the CAGR growth of 6.1% from 2019 to 2022.
| Category | 2019 | 2020 | 2021 | 2022 | CAGR* % 2019-2022 | Annual growth (%) 2021-2022 | Total growth (%) 2019-2022 |
|---|---|---|---|---|---|---|---|
| Natural Sweet Spreads | 964.0 | 1,122.6 | 1,110.8 | 1,189.0 | 7.2 | 7.0 | 23.3 |
| Natural Jams and Preserves | 348.9 | 399.5 | 399.4 | 416.5 | 6.1 | 4.3 | 19.4 |
| Natural Nut and Seed Based Spreads | 615.1 | 723.1 | 711.4 | 772.5 | 7.9 | 8.6 | 25.6 |
|
Source: Euromonitor International, 2023 *CAGR: Compound annual growth rate |
|||||||
The CAGR of the natural sweet spreads are projected to be 4.2% from 2022 to 2027. Annual growth 2022 to 2023 of was 4.6% and total growth 2022 to 2027 was 23.1%. Natural nut and seed-based spreads are projected to record the highest CAGR growth of 4.7% followed by natural Jams and preserves at the CAGR growth of 3.3% from 2022 to 2027.
| Category | 2023 | 2024 | 2025 | 2026 | 2027 | CAGR* % 2022-2027 | Annual growth (%) 2022-2023 | Total growth (%) 2022-2027 |
|---|---|---|---|---|---|---|---|---|
| Natural Sweet Spreads | 1,244.0 | 1,300.6 | 1,341.0 | 1,401.4 | 1,463.1 | 4.2 | 4.6 | 23.1 |
| Natural Jams and Preserves | 440.7 | 461.1 | 470.4 | 479.5 | 490.5 | 3.3 | 5.8 | 17.8 |
| Natural Nut and Seed Based Spreads | 803.3 | 839.5 | 870.6 | 921.9 | 972.6 | 4.7 | 4.0 | 25.9 |
|
Source: Euromonitor International, 2023 *CAGR: Compound annual growth rate |
||||||||
Natural baked goods reached US$2,110.7 million in 2022 and the CAGR is 7.9% from 2019 to 2022. Annual growth 2021 to 2022 of was −0.3% and total growth 2019 to 2022 was 25.5%. Natural bread has the biggest growth of 12.7% while the natural pastries have the lowest at CAGR growth of −6.6% from 2019 to 2022.
| Category | 2019 | 2020 | 2021 | 2022 | CAGR* % 2019-2022 | Annual growth (%) 2021-2022 | Total growth (%) 2019-2022 |
|---|---|---|---|---|---|---|---|
| Natural Baked Goods | 1,681.3 | 1,863.0 | 2,117.4 | 2,110.7 | 7.9 | −0.3 | 25.5 |
| Natural Bread | 815.5 | 1,059.8 | 1,109.7 | 1,166.0 | 12.7 | 5.1 | 43.0 |
| Natural Cakes | 397.2 | 344.2 | 552.4 | 486.1 | 7.0 | −12.0 | 22.4 |
| Natural Dessert Mixes | 92.4 | 131.3 | 130.1 | 110.7 | 6.2 | −14.9 | 19.8 |
| Natural Frozen Baked Goods | 157.7 | 166.6 | 209.1 | 169.7 | 2.5 | −18.8 | 7.6 |
| Natural Pastries | 218.4 | 161.2 | 116.1 | 178.1 | −6.6 | 53.4 | −18.5 |
|
Source: Euromonitor International, 2023 *CAGR: Compound annual growth rate |
|||||||
The CAGR of the natural baked goods are projected to be 11.2% from 2022 to 2027. Annual growth 2022 to 2023 of was 14.4% and total growth 2022 to 2027 was 70.2%. Natural cakes are projected to record the highest CAGR growth of 30.0% while natural pastries are projected to be slowest growth of −8.0% from 2022 to 2027.
| Category | 2023 | 2024 | 2025 | 2026 | 2027 | CAGR* % 2022-2027 | Annual growth (%) 2022-2023 | Total growth (%) 2022-2027 |
|---|---|---|---|---|---|---|---|---|
| Natural Baked Goods | 2,414.1 | 2,611.3 | 2,894.8 | 3,228.5 | 3,592.4 | 11.2 | 14.4 | 70.2 |
| Natural Bread | 1,215.9 | 1,184.9 | 1,236.7 | 1,314.7 | 1,400.6 | 3.7 | 4.3 | 20.1 |
| Natural Cakes | 735.5 | 992.0 | 1,248.0 | 1,520.4 | 1,808.2 | 30.0 | 51.3 | 272.0 |
| Natural Dessert Mixes | 109.5 | 108.9 | 109.9 | 113.0 | 117.1 | 1.1 | −1.1 | 5.8 |
| Natural Frozen Baked Goods | 167.5 | 155.1 | 150.0 | 147.7 | 149.2 | −2.5 | −1.3 | −12.1 |
| Natural Pastries | 185.6 | 170.3 | 150.2 | 132.7 | 117.2 | −8.0 | 4.2 | −34.2 |
|
Source: Euromonitor International, 2023 *CAGR: Compound annual growth rate |
||||||||
Natural processed meat, seafood and alternatives to meat reached US$6,250.0 million in 2022 and the CAGR is 15.1% from 2019 to 2022. Annual growth 2021 to 2022 of was 10.4% and total growth 2019 to 2022 was 52.6%. Natural meat and seafood substitutes have the biggest growth of 33.6% followed by the natural processed meat at a CAGR growth of 15.6% from 2019 to 2022.
| Category | 2019 | 2020 | 2021 | 2022 | CAGR* % 2019-2022 | Annual growth (%) 2021-2022 | Total growth (%) 2019-2022 |
|---|---|---|---|---|---|---|---|
| Natural Processed Meat, Seafood and Alternatives to Meat | 4,095.3 | 5,101.6 | 5,659.3 | 6,250.0 | 15.1 | 10.4 | 52.6 |
| Natural Processed Meat | 3,550.0 | 4,365.0 | 4,919.7 | 5,478.1 | 15.6 | 11.4 | 54.3 |
| Natural Processed Seafood | 519.7 | 690.8 | 675.7 | 710.7 | 11.0 | 5.2 | 36.8 |
| Natural Meat and Seafood Substitutes | 25.6 | 45.9 | 63.8 | 61.1 | 33.6 | −4.2 | 138.7 |
|
Source: Euromonitor International, 2023 *CAGR: Compound annual growth rate |
|||||||
The CAGR of the natural processed meat, seafood and alternatives to meat are projected to be 4.1% from 2022 to 2027. Annual growth 2022 to 2023 was 5.6% and total growth 2022 to 2027 was 22.3%. Natural processed meat is projected to record the highest CAGR growth of 4.2% followed by the natural meat and seafood substitutes at a CAGR growth of 3.4% from 2022 to 2027.
| Category | 2023 | 2024 | 2025 | 2026 | 2027 | CAGR* % 2022-2027 | Annual growth (%) 2022-2023 | Total growth (%) 2022-2027 |
|---|---|---|---|---|---|---|---|---|
| Natural Processed Meat, Seafood and Alternatives to Meat | 6,602.5 | 6,870.6 | 7,144.2 | 7,399.3 | 7,645.8 | 4.1 | 5.6 | 22.3 |
| Natural Processed Meat | 5,792.3 | 6,036.7 | 6,284.8 | 6,515.1 | 6,737.7 | 4.2 | 5.7 | 23.0 |
| Natural Processed Seafood | 745.2 | 769.7 | 792.9 | 814.7 | 836.0 | 3.3 | 4.9 | 17.6 |
| Natural Meat and Seafood Substitutes | 65.0 | 64.1 | 66.5 | 69.4 | 72.2 | 3.4 | 6.4 | 18.2 |
|
Source: Euromonitor International, 2023 *CAGR: Compound annual growth rate |
||||||||
Top 10 companies of natural food
Top three companies are General Mills Inc (US$501.9 million, market share 23.8% in 2022), Mondelez International Inc (US$329.4 million, market share 15.6%) and Marc Inc (US$169.4 million, market share 8.0%). Among top 10 companies, all companies have the positive growth except General Mills Inc which has the negative growth at a CAGR of −7.5%.
| Company name | 2019 | 2020 | 2021 | 2022 | CAGR* % in 2019-2022 | Market share % in 2022 |
|---|---|---|---|---|---|---|
| General Mills Inc | 633.3 | 516.3 | 514.1 | 501.9 | −7.5 | 23.8 |
| Mondelez International Inc | 235.1 | 294.9 | 340.8 | 329.4 | 11.9 | 15.6 |
| Mars Inc | 166.9 | 120.2 | 159.4 | 169.4 | 0.5 | 8.0 |
| Sun-Maid Growers Inc | 129.1 | 130.8 | 155.3 | 135.5 | 1.6 | 6.4 |
| Kellogg Co | 69.2 | 63.0 | 87.8 | 86.7 | 7.8 | 4.1 |
| PepsiCo Inc | 21.8 | 33.9 | 52.3 | 53.0 | 34.5 | 2.5 |
| Lenny & Larry's LLC | 23.0 | 21.6 | 24.1 | 39.7 | 20.0 | 1.9 |
| Kroger Co | 12.7 | 24.8 | 19.1 | 39.2 | 45.6 | 1.9 |
| Lotus Bakeries NV | 7.1 | 13.6 | 17.4 | 36.9 | 73.2 | 1.7 |
| Summit Naturals Inc | 2.2 | 24.2 | 32.3 | N/C | 1.5 | |
|
Source: Euromonitor International, 2023 *CAGR: Compound annual growth rate N/C: Not calculable |
||||||
Top three companies are Mars Inc (US$230.7 million, market share 20.2% in 2022), Haribo GmbH & Co KG (US$138.3 million, market share 12.1%) and Chocoladefabriken Lindt & Sprüngli AG (US$134.3 million, market share 11.8%).
| Company name | 2019 | 2020 | 2021 | 2022 | CAGR* % in 2019-2022 | Market share % in 2022 |
|---|---|---|---|---|---|---|
| Mars Inc | 147.8 | 162.9 | 248.2 | 230.7 | 16.0 | 20.2 |
| Haribo GmbH & Co KG | 122.4 | 97.1 | 139.3 | 138.3 | 4.2 | 12.1 |
| Ricola AG | 132.9 | 121.7 | 140.1 | 134.3 | 0.3 | 11.8 |
| Chocoladefabriken Lindt & Sprüngli AG | 101.1 | 71.1 | 92.2 | 83.0 | −6.4 | 7.3 |
| Ferrero & related parties | 19.4 | 38.0 | 59.9 | 61.3 | 46.7 | 5.4 |
| Hershey Co, The | 59.1 | 73.7 | 79.7 | 58.2 | −0.5 | 5.1 |
| Po Ho Co AG | 20.9 | 14.5 | 9.3 | 51.9 | 35.4 | 4.6 |
| Darrell Lea Chocolate Co Pty Ltd | 11.8 | 28.9 | 33.9 | 51.6 | 63.5 | 4.5 |
| Ritter GmbH & Co KG, Alfred | 78.0 | 68.7 | 54.9 | 51.2 | −13.1 | 4.5 |
| Lofthouse of Fleetwood Ltd | 0.5 | 7.4 | 14.1 | 36.7 | 318.7 | 3.2 |
|
Source: Euromonitor International, 2023 *CAGR: compound annual growth rate |
||||||
Top three companies are Hershey Co, (US$375.6 million, market share 13.9% in 2022), Mondelez International Inc (US$261.0 million, market share 9.7%) and Wonderful Co LLC (US$222.8 million, market share 8.3%). All the top 10 companies have the positive growth except Wonderful Co LLC (−3.8%) from 2019 to 2022.
| Company name | 2019 | 2020 | 2021 | 2022 | CAGR* % in 2019-2022 | Market share % in 2022 |
|---|---|---|---|---|---|---|
| Hershey Co | 211.7 | 264.8 | 325.0 | 375.6 | 21.1 | 13.9 |
| Mondelez International Inc | 167.0 | 217.0 | 251.2 | 261.0 | 16.0 | 9.7 |
| Wonderful Co LLC, | 250.0 | 270.0 | 209.9 | 222.8 | −3.8 | 8.3 |
| PepsiCo Inc | 172.5 | 190.1 | 166.8 | 177.1 | 0.9 | 6.6 |
| Campbell Soup Co | 155.4 | 189.9 | 192.7 | 156.6 | 0.3 | 5.8 |
| Kettle Heroes LLC | 37.1 | 59.7 | 72.3 | 126.3 | 50.4 | 4.7 |
| Blue Diamond Growers | 112.2 | 109.3 | 111.6 | 114.8 | 0.8 | 4.3 |
| Kroger Co | 71.0 | 140.3 | 119.6 | 89.2 | 7.9 | 3.3 |
| Kellogg Co | 39.0 | 33.9 | 66.3 | 54.8 | 12.0 | 2.0 |
| Hain Celestial Group Inc | 14.6 | 29.3 | 36.7 | 45.5 | 46.1 | 1.7 |
|
Source: Euromonitor International, 2023 *CAGR: compound annual growth rate |
||||||
Top three companies are Nestlé SA (US$217.6 million, market share 52.3% in 2022), Reckitt Benckiser Group Plc (US$90.3 million, market share 21.7%) and Hero Group GmbH (US$49.1 million, market share 11.8%).
| Company name | 2019 | 2020 | 2021 | 2022 | CAGR* % in 2019-2022 | Market share % in 2022 |
|---|---|---|---|---|---|---|
| Nestlé SA | 150.5 | 178.2 | 231.5 | 217.6 | 13.1 | 52.3 |
| Reckitt Benckiser Group Plc (RB) | 128.8 | 115.4 | 142.0 | 90.3 | −11.2 | 21.7 |
| Hero Group GmbH | 46.6 | 64.4 | 52.4 | 49.1 | 1.8 | 11.8 |
| Hain Celestial Group Inc | 31.6 | 31.0 | 31.7 | 28.7 | −3.2 | 6.9 |
| Sun-Maid Growers Inc | 14.7 | 18.7 | 20.2 | 17.6 | 6.2 | 4.2 |
| Danone, Groupe | 13.3 | 14.1 | 14.2 | 12.5 | −2.0 | 3.0 |
| Total | 385.5 | 421.7 | 491.9 | 415.8 | 2.6 | 100.0 |
|
Source: Euromonitor International, 2023 *CAGR: compound annual growth rate |
||||||
Top three companies are Chobani LLC (US$1,559.8 million, market share 63.1% in 2022), Fage International SA (US$227.7 million, market share 9.2%) and Noosa Yoghurt LLC (US$186.4 million, market share 7.5%).
| Company name | 2019 | 2020 | 2021 | 2022 | CAGR* % in 2019-2022 | Market share % in 2022 |
|---|---|---|---|---|---|---|
| Chobani LLC | 1,110.2 | 1,281.6 | 1,391.0 | 1,559.8 | 12.0 | 63.1 |
| Fage International SA | 231.8 | 245.9 | 245.3 | 227.7 | −0.6 | 9.2 |
| Noosa Yoghurt LLC | 168.7 | 176.1 | 179.8 | 186.4 | 3.4 | 7.5 |
| Lactalis, Groupe | 144.1 | 132.0 | 147.2 | 142.1 | −0.5 | 5.7 |
| Danone, Groupe | 124.4 | 89.5 | 85.2 | 103.5 | −5.9 | 4.2 |
| General Mills Inc | 50.1 | 35.6 | 47.0 | 48.8 | −0.9 | 2.0 |
| Lifeway Foods Inc | 51.6 | 47.6 | 57.2 | 41.7 | −6.9 | 1.7 |
| Kroger Co | 5.8 | 6.0 | 7.1 | 8.9 | 15.3 | 0.4 |
| Wegmans Food Markets Inc | 7.8 | 12.0 | 8.7 | 3.6 | −22.7 | 0.1 |
| Hy-Vee Inc | 2.6 | 4.5 | 6.3 | N/C | 0.0 | |
|
Source: Euromonitor International, 2023 *CAGR: Compound annual growth rate N/C: Not calculable |
||||||
Top three companies are Amy's Kitchen Inc (US$474.9 million, market share 24.7% in 2022), ConAgra Brands Inc (US$376.5 million, market share 19.6%) and Campbell Soup Co (US$142.4 million, market share 7.4%).
| Company name | 2019 | 2020 | 2021 | 2022 | CAGR* % in 2019-2022 | Market share % in 2022 |
|---|---|---|---|---|---|---|
| Amy's Kitchen Inc | 450.4 | 677.0 | 529.1 | 474.9 | 1.8 | 24.7 |
| ConAgra Brands Inc | 261.1 | 296.6 | 392.9 | 376.5 | 13.0 | 19.6 |
| Campbell Soup Co | 139.9 | 176.5 | 144.8 | 142.4 | 0.6 | 7.4 |
| Nestlé SA | 82.6 | 125.1 | 131.3 | 134.3 | 17.6 | 7.0 |
| General Mills Inc | 81.1 | 87.0 | 89.8 | 79.2 | −0.8 | 4.1 |
| Kroger Co | 40.5 | 50.3 | 44.5 | 55.7 | 11.2 | 2.9 |
| Evol - Union of Agricultural Cooperatives of Volos | 31.0 | 45.3 | 37.6 | 33.3 | 2.4 | 1.7 |
| Newman's Own Inc | 17.4 | 18.0 | 25.2 | 28.6 | 18.0 | 1.5 |
| PepsiCo Inc | 14.8 | 14.5 | 15.8 | 20.1 | 10.7 | 1.0 |
| Productos Fernandez SA | 20.1 | 23.1 | 19.8 | 17.9 | −3.8 | 0.9 |
|
Source: Euromonitor International, 2023 *CAGR: compound annual growth rate |
||||||
Top three companies are JM Smucker Co (US$569.9 million, market share 47.9% in 2022), Hormel Foods Corp (US$216.2 million, market share 16.2%) and Andros SAS (US$61.7 million, market share 5.2%).
| Company name | 2019 | 2020 | 2021 | 2022 | CAGR* % in 2019-2022 | Market share % in 2022 |
|---|---|---|---|---|---|---|
| JM Smucker Co. | 372.5 | 476.0 | 565.6 | 569.9 | 15.2 | 47.9 |
| Hormel Foods Corp | 168.3 | 189.7 | 187.7 | 216.2 | 8.7 | 18.2 |
| Andros SAS | 76.1 | 65.9 | 59.1 | 61.7 | −6.8 | 5.2 |
| St Dalfour Frères | 23.3 | 29.7 | 37.2 | 43.2 | 22.9 | 3.6 |
| National Grape Coop Association Inc | 53.1 | 62.3 | 59.6 | 42.3 | −7.3 | 3.6 |
| Stonewall Kitchen LLC | 11.5 | 16.9 | 16.0 | 27.9 | 34.4 | 2.3 |
| Oswal Organics Pvt Ltd | 9.7 | 11.7 | 7.1 | 16.3 | 18.9 | 1.4 |
| Kroger Co | 7.1 | 5.3 | 4.3 | 15.5 | 29.7 | 1.3 |
| Alimer SA | 5.6 | 7.9 | 11.8 | 14.5 | 37.3 | 1.2 |
| Adolf Darbo AG | 6.3 | 12.4 | 9.6 | 11.4 | 21.9 | 1.0 |
|
Source: Euromonitor International, 2023 *CAGR: compound annual growth rate |
||||||
Top three companies are Kellogg Co (US$116.0 million, market share 5.5% in 2022), Aras Gida San Tic Ltd Sti (US$105.7 million, market share 5.0%) and Katrin Ko EOOD (US$89.1 million, market share 4.2%). Among top 10 companies, Dr Schär AG/SpA has the biggest CAGR growth of 76.8% while the lowest growth is Mestemacher GmbH at a CAGR of −24.3%.
| Company name | 2019 | 2020 | 2021 | 2022 | CAGR* % in 2019-2022 | Market share % in 2022 |
|---|---|---|---|---|---|---|
| Kellogg Co | 126.0 | 93.8 | 95.4 | 116.0 | −2.7 | 5.5 |
| Aras Gida San Tic Ltd Sti | 57.4 | 56.1 | 102.0 | 105.7 | 22.6 | 5.0 |
| Katrin Ko EOOD | 180.3 | 89.1 | N/C | 4.2 | ||
| Flowers Foods Inc | 54.2 | 59.5 | 95.7 | 74.4 | 11.1 | 3.5 |
| Kroger Co | 84.3 | 176.8 | 143.4 | 74.4 | −4.1 | 3.5 |
| Ener-G Foods Inc | 19.6 | 29.9 | 25.0 | 73.3 | 55.2 | 3.5 |
| Dr Schär AG/SpA | 13.1 | 31.1 | 40.8 | 72.4 | 76.8 | 3.4 |
| HE Butt Grocery Co | 43.8 | 22.1 | 85.6 | 63.5 | 13.2 | 3.0 |
| Hostess Brands LLC | 15.5 | 25.6 | 49.1 | 62.9 | 59.5 | 3.0 |
| Mestemacher GmbH | 112.4 | 106.5 | 36.8 | 48.7 | −24.3 | 2.3 |
|
Source: Euromonitor International, 2023 *CAGR: Compound annual growth rate N/C: Not calculable |
||||||
Top three companies are Tyson Foods Inc (US$1,245.2 million, market share 19.9% in 2022), Hormel Foods Corp (US$860.4 million, market share 13.8%) and Kraft Heinz Co (US$824.3 million, market share 13.2%).
| Company name | 2019 | 2020 | 2021 | 2022 | CAGR* % in 2019-2022 | Market share % in 2022 |
|---|---|---|---|---|---|---|
| Tyson Foods Inc | 721.3 | 938.4 | 1,230.5 | 1,245.2 | 20.0 | 19.9 |
| Hormel Foods Corp | 526.4 | 680.9 | 738.3 | 860.4 | 17.8 | 13.8 |
| Kraft Heinz Co | 538.4 | 678.0 | 740.9 | 824.3 | 15.3 | 13.2 |
| WH Group | 190.5 | 214.8 | 222.8 | 290.5 | 15.1 | 4.6 |
| Land O'Frost Inc | 109.8 | 117.9 | 148.6 | 149.0 | 10.7 | 2.4 |
| Kroger Co | 101.9 | 175.6 | 153.4 | 129.6 | 8.3 | 2.1 |
| Dongwon Group | 112.8 | 118.7 | 128.7 | 119.5 | 1.9 | 1.9 |
| Wegmans Food Markets Inc | 65.7 | 173.1 | 116.0 | 109.5 | 18.6 | 1.8 |
| Johnsonville Sausage LLC | 69.4 | 101.3 | 100.3 | 100.8 | 13.2 | 1.6 |
| Albertsons Cos Inc | 3.3 | 4.4 | 90.2 | 79.8 | 189.2 | 1.3 |
|
Source: Euromonitor International, 2023 *CAGR: compound annual growth rate |
||||||
Retail sales of natural beverages
Natural hot drinks reached US$2,300.4 million in 2022 and the CAGR is 15.7% from 2019 to 2022. Annual growth 2021 to 2022 of was 6.9% and total growth 2019 to 2022 was 54.8%. Natural sugar fresh coffee has the biggest CAGR growth of 19.9% while natural instant coffee has the lowest CAGR growth of 2.7% from 2019 to 2022.
| Category | 2019 | 2020 | 2021 | 2022 | CAGR* % 2019-2022 | Annual growth (%) 2021-2022 | Total growth (%) 2019-2022 |
|---|---|---|---|---|---|---|---|
| Natural Hot Drinks | 1,485.7 | 2,027.9 | 2,152.1 | 2,300.4 | 15.7 | 6.9 | 54.8 |
| Natural Coffee | 833.6 | 1,127.0 | 1,303.1 | 1,420.3 | 19.4 | 9.0 | 70.4 |
| Natural Fresh Coffee | 809.7 | 1,102.4 | 1,272.0 | 1,394.4 | 19.9 | 9.6 | 72.2 |
| Natural Instant Coffee | 23.9 | 24.7 | 31.1 | 25.9 | 2.7 | −16.7 | 8.4 |
| Natural Tea | 652.1 | 900.9 | 849.0 | 880.1 | 10.5 | 3.7 | 35.0 |
| Natural Black Tea | 150.1 | 200.5 | 203.9 | 197.4 | 9.6 | −3.2 | 31.5 |
| Natural Fruit/Herbal Tea | 454.4 | 638.4 | 584.0 | 630.3 | 11.5 | 7.9 | 38.7 |
| Natural Green Tea | 47.7 | 62.0 | 61.2 | 52.4 | 3.2 | −14.4 | 9.9 |
|
Source: Euromonitor International, 2023 *CAGR: Compound annual growth rate |
|||||||
The CAGR of the natural hot drinks is 4.4% from 2022 to 2027. Annual growth 2022 to 2023 of was 4.7% and total growth 2022 to 2027 was 24.2%. Natural fruit/herbal tea is projected to have the highest CAGR growth 6.1% from 2022 to 2027.
| Category | 2023 | 2024 | 2025 | 2026 | 2027 | CAGR* % 2022-2027 | Annual growth (%) 2022-2023 | Total growth (%) 2022-2027 |
|---|---|---|---|---|---|---|---|---|
| Natural Hot Drinks | 2,409.2 | 2,511.4 | 2,625.2 | 2,740.4 | 2,857.7 | 4.4 | 4.7 | 24.2 |
| Natural Coffee | 1,476.9 | 1,541.1 | 1,612.4 | 1,681.9 | 1,753.0 | 4.3 | 4.0 | 23.4 |
| Natural Fresh Coffee | 1,447.6 | 1,510.8 | 1,582.2 | 1,652.3 | 1,724.0 | 4.3 | 3.8 | 23.6 |
| Natural Instant Coffee | 29.3 | 30.3 | 30.2 | 29.6 | 29.0 | 2.3 | 13.1 | 12.0 |
| Natural Tea | 932.3 | 970.2 | 1,012.8 | 1,058.6 | 1,104.7 | 4.7 | 5.9 | 25.5 |
| Natural Black Tea | 202.5 | 202.5 | 201.7 | 201.5 | 202.6 | 0.5 | 2.6 | 2.6 |
| Natural Fruit/Herbal Tea | 675.5 | 713.2 | 756.6 | 802.8 | 847.9 | 6.1 | 7.2 | 34.5 |
| Natural Green Tea | 54.2 | 54.6 | 54.4 | 54.2 | 54.2 | 0.7 | 3.4 | 3.4 |
|
Source: Euromonitor International, 2023 *CAGR: compound annual growth rate |
||||||||
Natural soft drinks reached US$45,516.1 million in 2022 and the CAGR is 11.0% from 2019 to 2022. Annual growth 2021 to 2022 of was 4.8% and total growth 2019 to 2022 was 36.9%. Natural sports drinks have the biggest CAGR growth of 21.9% while natural concentrates have the lowest CAGR growth of 7.3% from 2019 to 2022.
| Category | 2019 | 2020 | 2021 | 2022 | CAGR* % 2019-2022 | Annual growth (%) 2021-2022 | Total growth (%) 2019-2022 |
|---|---|---|---|---|---|---|---|
| Natural Soft Drinks | 33,241.3 | 37,162.5 | 43,411.5 | 45,516.1 | 11.0 | 4.8 | 36.9 |
| Natural Bottled Water | 9,926.2 | 10,991.7 | 11,630.5 | 12,361.8 | 7.6 | 6.3 | 24.5 |
| Natural Carbonates | 8,336.8 | 8,904.0 | 11,342.3 | 11,410.4 | 11.0 | 0.6 | 36.9 |
| Natural Cola Carbonates | 1,650.3 | 1,858.0 | 2,779.9 | 2,655.3 | 17.2 | −4.5 | 60.9 |
| Natural Non-Cola Carbonates | 6,686.5 | 7,046.0 | 8,562.4 | 8,755.1 | 9.4 | 2.3 | 30.9 |
| Natural Concentrates | 262.7 | 278.9 | 306.9 | 324.5 | 7.3 | 5.7 | 23.5 |
| Natural Juice | 5,026.6 | 5,838.8 | 6,696.9 | 7,019.2 | 11.8 | 4.8 | 39.6 |
| Natural RTD Coffee | 823.5 | 972.8 | 1,375.8 | 1,318.7 | 17.0 | −4.2 | 60.1 |
| Natural RTD Tea | 2,464.6 | 2,656.8 | 3,152.2 | 3,131.7 | 8.3 | −0.7 | 27.1 |
| Natural Energy Drinks | 3,828.5 | 4,574.8 | 5,112.9 | 5,295.1 | 11.4 | 3.6 | 38.3 |
| Natural Sports Drinks | 2,572.4 | 2,944.7 | 3,794.1 | 4,654.7 | 21.9 | 22.7 | 80.9 |
|
Source: Euromonitor International, 2023 *CAGR: Compound annual growth rate |
|||||||
The CAGR of the natural soft Drinks is 3.1% from 2022 to 2027. Annual growth 2022 to 2023 of was 5.1% and total growth 2022 to 2027 was 16.6%. Natural sports drinks are projected to have the highest CAGR growth 8.1% from 2022 to 2027.
| Category | 2023 | 2024 | 2025 | 2026 | 2027 | CAGR* % 2022-2027 | Annual growth (%) 2022-2023 | Total growth (%) 2022-2027 |
|---|---|---|---|---|---|---|---|---|
| Natural Soft Drinks | 47,842.2 | 49,131.7 | 50,311.1 | 51,560.5 | 53,075.9 | 3.1 | 5.1 | 16.6 |
| Natural Bottled Water | 12,890.4 | 13,273.8 | 13,675.2 | 14,046.0 | 14,455.7 | 3.2 | 4.3 | 16.9 |
| Natural Carbonates | 11,755.3 | 11,945.7 | 12,101.2 | 12,260.8 | 12,439.5 | 1.7 | 3.0 | 9.0 |
| Natural Cola Carbonates | 2,597.4 | 2,554.3 | 2,500.4 | 2,477.9 | 2,431.3 | −1.7 | −2.2 | −8.4 |
| Natural Non-Cola Carbonates | 9,157.9 | 9,391.3 | 9,600.8 | 9,782.9 | 10,008.2 | 2.7 | 4.6 | 14.3 |
| Natural Concentrates | 346.8 | 356.4 | 361.5 | 367.3 | 374.7 | 2.9 | 6.9 | 15.5 |
| Natural Juice | 7,172.5 | 7,114.5 | 7,086.1 | 7,093.5 | 7,136.9 | 0.3 | 2.2 | 1.7 |
| Natural RTD Coffee | 1,448.9 | 1,538.8 | 1,629.7 | 1,720.2 | 1,813.7 | 6.6 | 9.9 | 37.5 |
| Natural RTD Tea | 3,262.7 | 3,354.7 | 3,430.5 | 3,487.0 | 3,570.1 | 2.7 | 4.2 | 14.0 |
| Natural Energy Drinks | 5,803.4 | 5,988.6 | 6,078.3 | 6,233.6 | 6,423.5 | 3.9 | 9.6 | 21.3 |
| Natural Sports Drinks | 5,162.1 | 5,559.1 | 5,948.6 | 6,352.0 | 6,861.8 | 8.1 | 10.9 | 47.4 |
|
Source: Euromonitor International, 2023 *CAGR: Compound annual growth rate |
||||||||
Top 10 companies of natural beverages
Top three companies are Nestlé SA (US$555.2 million, market share 24.0% in 2022), East West Tea Co LLC (US$191.2 million, market share 8.3%) and Ekaterra (US$188.9 million, market share 8.2%). Organic India Pvt Ltd has the biggest CAGR growth of 33.4% followed by Kroger Co at a CAGR of 16.5%.
| Company name | 2019 | 2020 | 2021 | 2022 | CAGR* % in 2019-2022 | Market share % in 2022 |
|---|---|---|---|---|---|---|
| Nestlé SA | 367.6 | 419.6 | 505.4 | 552.2 | 14.5 | 24.0 |
| East West Tea Co LLC | 128.3 | 179.4 | 148.3 | 191.2 | 14.2 | 8.3 |
| Ekaterra | 172.2 | 204.4 | 161.6 | 188.9 | 3.1 | 8.2 |
| JDE Peet's BV | 58.0 | 70.1 | 84.4 | 90.9 | 16.2 | 4.0 |
| Associated British Foods Plc | 60.0 | 80.4 | 86.0 | 78.5 | 9.4 | 3.4 |
| Kroger Co | 40.5 | 38.0 | 39.0 | 64.0 | 16.5 | 2.8 |
| ZooScape Corp | 98.6 | 131.0 | 63.2 | N/C | 2.7 | |
| RC Bigelow Inc | 57.4 | 71.4 | 66.0 | 61.1 | 2.1 | 2.7 |
| Organic India Pvt Ltd | 23.4 | 36.9 | 48.7 | 55.6 | 33.4 | 2.4 |
| Keurig Dr Pepper Inc | 52.8 | 47.0 | 53.3 | 54.5 | 1.1 | 2.4 |
|
Source: Euromonitor International, 2023 *CAGR: compound annual growth rate N/C: Non calculable |
||||||
Top three companies are Coca-Cola Co (US$9,310.6 million, market share 20.5% in 2022), PepsiCo Inc (US$5,762.2 million, market share 12.7%) and Red Bull GmbH (US$4,058.9 million, market share 8.9%). PepsiCo Inc has the biggest CAGR growth of 17.7% followed by Starbucks Corp at a CAGR of 17.5%.
| Company name | 2019 | 2020 | 2021 | 2022 | CAGR* % in 2019-2022 | Market share % in 2022 |
|---|---|---|---|---|---|---|
| Coca-Cola Co | 6,591.0 | 7,538.9 | 8,756.9 | 9,310.6 | 12.2 | 20.5 |
| PepsiCo Inc | 3,531.7 | 3,779.7 | 5,103.2 | 5,762.2 | 17.7 | 12.7 |
| Red Bull GmbH | 2,744.5 | 3,339.9 | 3,849.5 | 4,058.9 | 13.9 | 8.9 |
| Keurig Dr Pepper Inc | 2,476.3 | 2,745.2 | 3,217.9 | 3,246.2 | 9.4 | 7.1 |
| BlueTriton Brands Inc | 1,478.3 | 1,598.0 | 1,594.2 | 1,854.1 | 7.8 | 4.1 |
| Tropicana Brands Group | 751.0 | 916.2 | 1,221.1 | 1,185.6 | 16.4 | 2.6 |
| Starbucks Corp | 729.0 | 850.7 | 1,210.2 | 1,182.9 | 17.5 | 2.6 |
| Nestlé SA | 727.3 | 792.4 | 940.5 | 1,068.4 | 13.7 | 2.3 |
| Talking Rain Beverage Co | 559.3 | 642.5 | 759.8 | 762.5 | 10.9 | 1.7 |
| Hornell Brewing Co | 671.2 | 711.0 | 785.1 | 755.6 | 4.0 | 1.7 |
|
Source: Euromonitor International, 2023 *CAGR: Compound annual growth rate |
||||||
New product launch analysis
According to Mintel's Global New Products Database (GNPD), there were 58,360 natural products launched in US between January 2018 and December 2022. Among which, 43,865 were food, 9,499 were beverages, 2,825 were health and 2,171 were pets.
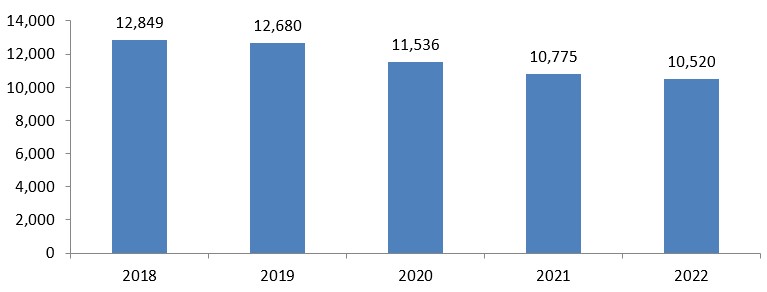
Description of above image
| 2018 | 2019 | 2020 | 2021 | 2022 | Total sample | |
|---|---|---|---|---|---|---|
| Products launched | 12,849 | 12,680 | 11,536 | 10,775 | 10,520 | 58,360 |
Source: Mintel, 2023
| Date Published | Number of natural food | Number of natural beverages |
|---|---|---|
| 2018 | 9,471 | 2,190 |
| 2019 | 9,668 | 1,997 |
| 2020 | 8,840 | 1,759 |
| 2021 | 8,052 | 1,837 |
| 2022 | 7,834 | 1,716 |
| Total Sample | 43,865 | 9,499 |
| Source: Mintel, 2023 | ||
In 2022, the top five natural food manufacturers were located in USA, Mexico, Italy and Germany. The top five brands were Signature Select, Great Value, Giant Eagle, Good & Gather and Kroger. The top ingredient claims were natural, vegetable Based, organic, enriched and artificial.
| Product attributes | Yearly launch count | |||||
|---|---|---|---|---|---|---|
| 2018 | 2019 | 2020 | 2021 | 2022 | Total | |
| Top five flavours component | ||||||
| Unflavoured/Plain | 1,611 | 1,651 | 1,629 | 1,387 | 1,329 | 7,607 |
| Chocolate | 599 | 592 | 501 | 561 | 489 | 2,742 |
| Strawberry | 339 | 343 | 268 | 273 | 285 | 1,508 |
| Chicken | 361 | 306 | 273 | 230 | 215 | 1,385 |
| Vanilla/Vanilla Bourbon/Vanilla Madagascar | 248 | 274 | 210 | 252 | 197 | 1,181 |
| Top five locations of manufacture | ||||||
| United States | 1,808 | 1,810 | 1,584 | 1,222 | 1,210 | 7,634 |
| Canada | 348 | 404 | 326 | 449 | 408 | 1,935 |
| Mexico | 142 | 154 | 120 | 159 | 183 | 758 |
| Italy | 103 | 173 | 131 | 167 | 161 | 735 |
| Germany | 64 | 122 | 61 | 59 | 134 | 440 |
| Top five brands | ||||||
| Signature Select | 134 | 156 | 68 | 148 | 54 | 560 |
| Great Value | 183 | 69 | 92 | 84 | 127 | 555 |
| Giant Eagle | 85 | 95 | 91 | 111 | 124 | 506 |
| Good & Gather | 0 | 43 | 167 | 71 | 72 | 353 |
| Kroger | 137 | 89 | 41 | 43 | 42 | 352 |
| Top launch types | ||||||
| New Variety/Range Extension | 3,515 | 4,027 | 3,903 | 3,321 | 3,259 | 18,025 |
| New Packaging | 3,179 | 2,804 | 2,452 | 2,386 | 2,572 | 13,393 |
| New Product | 1,886 | 2,067 | 1,797 | 1,717 | 1,477 | 8,944 |
| Relaunch | 867 | 749 | 655 | 602 | 506 | 3,379 |
| New Formulation | 24 | 21 | 33 | 26 | 20 | 124 |
| Top five categories | ||||||
| Snacks | 1,545 | 1,832 | 1,477 | 1,317 | 1,217 | 7,388 |
| Bakery | 1,265 | 1,261 | 1,202 | 1,345 | 1,158 | 6,231 |
| Sauces & Seasonings | 992 | 783 | 1,028 | 838 | 941 | 4,582 |
| Processed Fish, Meat & Egg Products | 963 | 933 | 918 | 787 | 943 | 4,544 |
| Dairy | 908 | 1,019 | 902 | 689 | 569 | 4,087 |
| Top ingredient claims | ||||||
| Natural | 7,077 | 7,116 | 6,396 | 6,276 | 6,131 | 32,996 |
| Vegetable Based | 1,529 | 1,614 | 1,375 | 1,398 | 1,289 | 7,205 |
| Organic | 1,566 | 1,707 | 1,669 | 1,090 | 974 | 7,006 |
| Enriched | 1,510 | 1,408 | 1,244 | 1,325 | 1,198 | 6,685 |
| Artificial | 1,407 | 1,403 | 1,115 | 1,292 | 1,302 | 6,519 |
| Source: Mintel, 2023 | ||||||
In 2022, the top five nutrition of the natural beverages were energy, carbohydrates, fat, protein and sodium. The top five brands were great value, ritual, signature select, Coca-Cola and Meijer. The top ingredient claims were natural, organic, artificial, green, and vegetable based.
| Product attributes | Yearly launch count | |||||
|---|---|---|---|---|---|---|
| 2018 | 2019 | 2020 | 2021 | 2022 | Total | |
| Top five flavours | ||||||
| Unflavoured/Plain | 465 | 408 | 314 | 246 | 218 | 1,651 |
| Lime | 132 | 100 | 99 | 94 | 92 | 517 |
| Strawberry | 91 | 101 | 105 | 124 | 93 | 514 |
| Lemon | 105 | 98 | 105 | 94 | 96 | 498 |
| Mango | 85 | 72 | 84 | 78 | 86 | 405 |
| Top five nutrition | ||||||
| Energy (kcal) (listed on pack) | 1,533 | 1,412 | 1,257 | 1,283 | 1,220 | 6,705 |
| Carbohydrates (listed on pack) | 1,520 | 1,408 | 1,253 | 1,280 | 1,217 | 6,678 |
| Fat (listed on pack) | 1,477 | 1,361 | 1,229 | 1,242 | 1,154 | 6,463 |
| Protein (listed on pack) | 1,475 | 1,361 | 1,229 | 1,235 | 1,151 | 6,451 |
| Sodium (listed on pack) | 1,468 | 1,352 | 1,205 | 1,208 | 1,161 | 6,394 |
| Top five brands | ||||||
| Great Value | 36 | 18 | 14 | 14 | 13 | 95 |
| Ritual | 4 | 27 | 17 | 24 | 9 | 81 |
| Signature Select | 14 | 8 | 12 | 42 | 4 | 80 |
| Coca-Cola | 16 | 21 | 8 | 8 | 4 | 57 |
| Meijer | 15 | 22 | 9 | 8 | 1 | 55 |
| Top launch types | ||||||
| New Variety/Range Extension | 691 | 668 | 612 | 679 | 619 | 3,269 |
| New Product | 678 | 678 | 491 | 483 | 481 | 2,811 |
| New Packaging | 619 | 535 | 501 | 565 | 530 | 2,750 |
| Relaunch | 192 | 108 | 151 | 109 | 85 | 645 |
| New Formulation | 10 | 8 | 4 | 1 | 1 | 24 |
| Top categories | ||||||
| Hot Beverages | 463 | 370 | 388 | 409 | 295 | 1,925 |
| Nutritional Drinks & Other Beverages | 381 | 341 | 238 | 301 | 373 | 1,634 |
| Alcoholic Beverages | 309 | 330 | 292 | 329 | 298 | 1,558 |
| Water | 262 | 237 | 252 | 202 | 128 | 1,081 |
| Juice Drinks | 299 | 280 | 186 | 172 | 141 | 1,078 |
| Top five ingredient claims | ||||||
| Natural | 1,444 | 1,316 | 1,231 | 1,392 | 1,284 | 6,667 |
| Organic | 388 | 384 | 308 | 215 | 212 | 1,507 |
| Artificial | 313 | 213 | 204 | 278 | 313 | 1,321 |
| Green | 129 | 128 | 115 | 106 | 144 | 622 |
| Vegetable Based | 112 | 107 | 86 | 92 | 85 | 482 |
|
Source: Mintel, 2023 |
||||||
Examples of new product launches
Heritage Natural Duroc Pork Traditional Breakfast Sausages
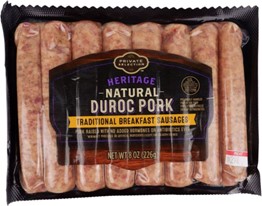
Source: Mintel, 2023
| Company | Kroger |
|---|---|
| Brand | Private Selection |
| Category | Processed fish, meat and egg products |
| Sub-category | Meat products |
| Market | United States |
| Store name | Kroger |
| Store type | Supermarket |
| Date published | December 2022 |
| Product source | Shopper |
| Launch type | New variety / range extension |
| Price in local currency | $3.99 |
| Price in Euros | 3.77 |
Seamix Bei Ji Xia (Cold Water Shrimp) have been repackaged. They are caught in the North Atlantic, and are described as firm, fleshy and sweet. This protein-rich premium product is microwaveable and retails in a new 365 gram pack bearing the MSC logo, a QR code and Tao Xian Da mobile Apps information.
Onion & Vinegar Baked Crispy Mushroom Chips
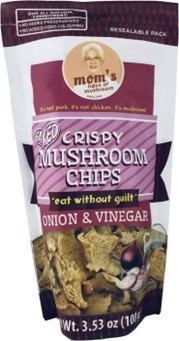
Source: Mintel, 2023
| Company | MHM Global Manufacturing |
|---|---|
| Manufacturer | MHM Global Manufacturing |
| Brand | Mom's Haus of Mushroom |
| Category | Snacks |
| Sub-category | Vegetable snacks |
| Market | United States |
| Location of manufacture | Philippines |
| Import status | Imported product |
| Store type | Supermarket |
| Date published | December 2022 |
| Product source | Shopper |
| Launch type | New product |
| Price in local currency | $7.99 |
| Price in Euros | 7.61 |
Mom's Haus of Mushroom Onion & Vinegar Baked Crispy Mushroom Chips are now available, and retail in a 3.53 ounce pack. - Baked- All natural commitment - Free from added preservatives and food colorings - Resealable pack - Logos and certifications: QR code
California Natural Raisins
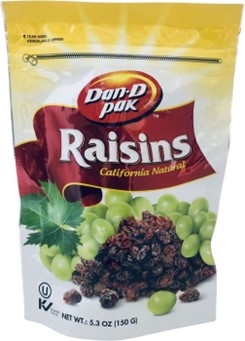
Source: Mintel, 2023
| Company | Dan-D-Pak |
|---|---|
| Manufacturer | Dan-D-Pak |
| Brand | Dan-D-Pak |
| Category | Snacks |
| Sub-category | Fruit snacks |
| Market | United States |
| Location of manufacture | United States |
| Import status | Not imported |
| Store name | Seafood City |
| Store type | Supermarket |
| Date published | December 2022 |
| Product source | Shopper |
| Launch type | New variety / range extension |
| Price in local currency | $0.99 |
| Price in Euros | 0.94 |
Dan-D Pak California Natural Raisins are now available, and retail in a 5.3 ounce pack. - Resealable pack - Logos and certifications: Kosher, QR code
Mucho Mango Fruit Juice Cocktail Liquid Water Enhancer

Source: Mintel, 2023
| Company | Arizona Beverages |
|---|---|
| Manufacturer | Arizona Beverages |
| Brand | Arizona |
| Category | Nutritional drinks and other beverages |
| Sub-category | Beverage concentrates |
| Market | United States |
| Location of manufacture | United States |
| Import status | Not imported |
| Store type | Supermarket |
| Date published | December 2022 |
| Product source | Shopper |
| Launch type | New packaging |
| Price in local currency | $4.49 |
| Price in Euros | 4.25 |
AriZona Mucho Mango Fruit Juice Cocktail Liquid Water Enhancer has been repackaged, and now retails in a newly designed 1.62 fluid ounce pack. - All natural flavors- Five calories per serving- Contains 3% juice - Just two squeezes per 16.9 fluid ounces serving - Manufacturer is an American company, family owned and operated - Logos and certifications: Kosher
Lemon Mint Cold Pressed Fruit Juice
Source: Mintel, 2023
| Company | Good Crop |
|---|---|
| Distributor | Good Crop |
| Brand | Sofresco |
| Category | Juice drinks |
| Sub-category | Juice |
| Market | United States |
| Store type | Supermarket |
| Date published | December 2022 |
| Product source | Shopper |
| Launch type | New packaging |
| Price in local currency | $2.99 |
| Price in Euros | 2.83 |
Sofresco Lemon Mint Cold Pressed Fruit Juice has been repackaged in a newly designed 12 fluid ounce pack. - 100% natural - Cold pressed - No added sugar, GMO - 100% fruit and vegetables juice - HPP processed - BPA free pack - Logos and certifications: High Pressure Certified, QR code
For more information
The Canadian Trade Commissioner Service:
International Trade Commissioners can provide Canadian industry with on-the-ground expertise regarding market potential, current conditions and local business contacts, and are an excellent point of contact for export advice.
More agri-food market intelligence:
International agri-food market intelligence
Discover global agriculture and food opportunities, the complete library of Global Analysis reports, market trends and forecasts, and information on Canada's free trade agreements.
Agri-food market intelligence service
Canadian agri-food and seafood businesses can take advantage of a customized service of reports and analysis, and join our email subscription service to have the latest reports delivered directly to their inbox.
More on Canada's agriculture and agri-food sectors:
Canada's agriculture sectors
Information on the agriculture industry by sector. Data on international markets. Initiatives to support awareness of the industry in Canada. How the department engages with the industry.
For additional information on the Natural Products Expo East (NPEE) or Americas Food and Beverage Show (AFB), please contact:
Cecile Landgrebe
Trade Commissioner
Consulate General of Canada
Government of Canada
cecile.landgrebe@international.gc.ca
Resources
- Euromonitor International. 2023
- Mintel Global New Products Database, 2023
Health and wellness series – Naturally healthy foods and beverages in United States
Global Analysis Report
Prepared by: Hongli, Wang, Market Analyst
© His Majesty the King in Right of Canada, represented by the Minister of Agriculture and Agri-Food (2023).
Photo credits
All photographs reproduced in this publication are used by permission of the rights holders.
All images, unless otherwise noted, are copyright His Majesty the King in Right of Canada.
To join our distribution list or to suggest additional report topics or markets, please contact:
Agriculture and Agri-Food Canada, Global Analysis1341 Baseline Rd, Tower 5, 3rd floor
Ottawa ON K1A 0C5
Canada
Email: aafc.mas-sam.aac@agr.gc.ca
The Government of Canada has prepared this report based on primary and secondary sources of information. Although every effort has been made to ensure that the information is accurate, Agriculture and Agri-Food Canada (AAFC) assumes no liability for any actions taken based on the information contained herein.
Reproduction or redistribution of this document, in whole or in part, must include acknowledgement of agriculture and agri-food Canada as the owner of the copyright in the document, through a reference citing AAFC, the title of the document and the year. Where the reproduction or redistribution includes data from this document, it must also include an acknowledgement of the specific data source(s), as noted in this document.
Agriculture and Agri-Food Canada provides this document and other report services to agriculture and food industry clients free of charge.