

Note: This report includes forecasting data that is based on baseline historical data.
Executive summary
Belgium is a diverse consumer market of 11.8 million located at the heart of Europe with approximately 97% living in urban areas It has one of the highest per capita incomes in Europe with a gross domestic product (GDP) of $515 billion in 2021.
Belgium is one of the world's largest organic packaged food markets, valued at US$474.7 million in 2021. Demand for organic packaged food has grown in Belgium as consumers make healthier choices in light of the COVID-19 pandemic.
Top three organic packaged food categories were organic dairy, accouting for 54.8% of Belgium's total organic packaged food market, organic bread (21.0%) and organic spreads (3.8%). The fastest growing categories were organic ready meals, which grew at a compound annual growth rate (CAGR) of 8.4%, followed by organic ice cream (CAGR 6.7%,US$1.8 million) and organic confectionary (CAGR 5.6%).
Canadian organic packaged food exporters have preferential market access to the EU-Canada Organic Equivalency Agreement. The agreement allows for Canadian products to be exported as organic products to the European Union (EU), provided that the products meet organic food requirements and certified as organic in Canada or the EU.
Market overview
Belgium is a diverse consumer market located at the heart of Europe. It is composed of the francophone Wallonia region to the south, the Dutch speaking Flanders region in the north, and the bilingual capital region of Brussels, in addition to a small number of German speakers. Referred to as "the capital of Europe," Brussels is home to the headquarters of the European Union (EU) and of the North Atlantic Treaty Organization (NATO), as well as hundreds of international institutions, associations, and multinational corporations.
Belgium's GDP reached $515 billion in 2021, while its bilateral agriculture trade with Canada totaled $351.8 million in 2021. With its major ports (Antwerp is the second largest port in Europe), a significant portion of bilateral trade either originates in, or is destined for, other EU countries. Canada ranks as Belgium's 13th largest import source with Belgium ranking as the 15th largest recipient of Canadian exports in 2021.
Belgium is densely populated with a population of 11.8 million in one of Europe's smallest landmasses. Most of the population is concentrated in the northern two-thirds of the country with approximately 97% living in urban areas It has one of the highest per capita incomes in Europe, with a balanced income distribution, resulting in widely distributed purchasing power among its residents. Belgium's central location in the wealthiest region of Europe makes it an ideal gateway for exports to destinations throughout Europe. Within a radius of 500km, 140 million EU consumers can be reached, representing 60% of Europe's purchasing power.
Belgium is the world's fourteenth largest organic packaged food market, based on 2021 retail sales. Between 2016 and 2021, Belgium's organic packaged food sector expanded at a CAGR of 3.1% or an increase of US$54.5 milion. Demand for organic packaged food has grown as consumers make healthier choices in light of the COVID-19 pandemic. The positive outlook for organic packaged food is expected to continue with a CAGR of 4.5% over 2021-2026 or an increase of US$93.8 million.
| Country | 2016 | 2021 | CAGR* (%) 2016-2021 | 2022 | 2026 | CAGR* (%) 2021-2026 |
|---|---|---|---|---|---|---|
| World | 34,933.6 | 50,815.4 | 7.8 | 54,475.1 | 70,304.2 | 6.7 |
| United States | 15,285.4 | 21,260.5 | 6.8 | 22,850.2 | 29,021.4 | 6.4 |
| Germany | 3,838.7 | 5,176.7 | 6.2 | 5,412.3 | 6,322.0 | 4.1 |
| China | 2,550.0 | 4,732.5 | 13.2 | 5,234.5 | 7,525.1 | 9.7 |
| France | 2,652.3 | 4,707.6 | 12.2 | 5,136.3 | 7,015.9 | 8.3 |
| Italy | 1,222.0 | 1,761.1 | 7.6 | 1,880.5 | 2,414.0 | 6.5 |
| United Kingdom | 1,392.1 | 1,749.2 | 4.7 | 1,810.7 | 2,124.1 | 4.0 |
| Canada | 867.5 | 1,237.7 | 7.4 | 1,360.7 | 1,857.9 | 8.5 |
| Netherlands | 760.4 | 1,100.3 | 7.7 | 1,159.7 | 1,501.7 | 6.4 |
| Denmark | 699.7 | 1,063.7 | 8.7 | 1,106.4 | 1,320.5 | 4.4 |
| Sweden | 673.3 | 905 | 6.1 | 943.8 | 1,168.0 | 5.2 |
| Austria | 614.9 | 807.1 | 5.6 | 816 | 982.2 | 4.0 |
| Switzerland | 440.2 | 524.9 | 3.6 | 536.5 | 631.5 | 3.8 |
| Japan | 392.4 | 416.6 | 1.2 | 421.1 | 446.5 | 1.4 |
| Belgium | 331 | 385.5 | 4.2 | 400.8 | 590.9 | 4.5 |
| Spain | 213.1 | 316.7 | 8.2 | 337.8 | 415.3 | 5.6 |
| Norway | 155.5 | 233.7 | 8.5 | 251.8 | 332 | 7.3 |
| Turkey | 37.9 | 159.1 | 33.2 | 201.6 | 456.9 | 23.5 |
|
Source: Euromonitor International, 2022 *CAGR: Compound annual growth rate |
||||||
Consumer characteristics
Belgians have a high awareness of environmental issues and that awareness was heightened during the pandemic. According to a Euromonitor survey, Belgian consumers' green attitudes are more aligned when it comes to product packaging: 52% of respondents say they select recyclable packaging and 49% use refillable/reusable packaging. 60% of survey respondents say they try to have a positive impact on the environment through their everyday actions, but that does not always apply to purchasing decisions. According to the survey, only 19% of respondents (compared to 32% globally) say they try to buy sustainably produced items,
According to the survey, fewer Belgians than their global counterparts are concerned about their eating habits. For example, despite the growing global interest in plant-based foods, Belgian consumers are still meat lovers, and meat consumption rates did not veer far off course during lockdown, as consumers purchased meat to cook at home while there were restrictions on foodservice outlets. According to the survey, fewer Belgians practice vegetarianism (3%) and veganism (2%) than their global counterparts, however, a considerable number of Belgians are altering their diets: 10% of respondents say they follow a flexitarian diet, ie typically not eating meat (or fish) but consuming it occasionally.
While 44% say they look for healthy ingredients in food and beverages, only 27% (compared to 45% globally) say they closely read the nutrition labels of food and beverages. Only 14% (compared to 29% globally) say they keep track of the calories in the food that they eat, and 34% (compared to 44% globally) say they actively monitor what they eat in order to manage their weight.
Market size
Health and wellness (HW) packaged food saw growth during the 2016 to 2021 period, at a CAGR of 2.6% and is expected to show similar growth over 2021-2026, at a CAGR of 2.5% Only the organic and free from categories grew faster. The organic packaged food market in Belgium is one of the smallest HW categories, valued at US$ 474.7 million in 2021. Organic packaged food sales increased by a CAGR of 4.2% over 2016-2021 and are expected to increase by a CAGR of 4.5% over 2021-2026.
| Category | 2016 | 2021 | CAGR* (%) 2016-2021 | 2022 | 2026 | CAGR* (%) 2021-2026 |
|---|---|---|---|---|---|---|
| HW packaged food total | 4,516.4 | 5,146.5 | 2.6 | 5,217.1 | 5,823.6 | 2.5 |
| Better for you | 1,301.40 | 1,436.10 | 2.0 | 1,445.80 | 1,541.00 | 1.4 |
| Fortified/ functional | 837 | 928.8 | 2.1 | 942 | 1,042.80 | 2.3 |
| Free from | 219.3 | 350.4 | 9.8 | 380 | 545.3 | 9.2 |
| Naturally healthy | 1,771.80 | 1,956.60 | 2.0 | 1,955.70 | 2,103.70 | 1.5 |
| Organic | 386.8 | 474.7 | 4.2 | 493.7 | 590.9 | 4.5 |
|
Source: Euromonitor International, 2022 *CAGR: Compound Annual Growth Rate |
||||||
Top three organic packaged food categories, in terms of retail sales, were organic dairy, accouting for 54.8% of Belgium's total organic packaged food market, with total retail sales of US$211.3 million in 2021, organic bread (21.0%, US$81.0 milion) and organic spreads (3.8%, US$14.7 million). Between 2016 and 2021, top three fastest growing organic packaged food categories were organic ready meals, which expanded at a CAGR of 8.4% with total retail sales valued at US$9.3 million in 2021, organic ice cream (CAGR 6.7%,US$1.8 million) and organic confectionary (CAGR 5.6%, US$10.5 million).
During the forecast period, the Belgian organic packaged food market is expected to grow at a CAGR of 3.1% and to be valued at CA$479.5 million by 2026. Organic ready meals is expected to see the fastest growth at a CAGR of 8.4%, reaching total retail sales of US$15.1 million by 2026. Ice cream is also forecast to show relatively higher growth than other organic packaged food categories, at a CAGR of 6.7%, reaching total retail value sales of US$2.6 million by 2026.
| Category | 2016 | 2017 | 2018 | 2019 | 2020 | 2021 |
|---|---|---|---|---|---|---|
| Organic Packaged Food Total | 331.0 | 342.8 | 355.0 | 366.3 | 378.6 | 385.5 |
| Baby food | 5.8 | 6.0 | 6.5 | 7.1 | 6.8 | 7.2 |
| Bread | 68.2 | 71.0 | 73.6 | 76.0 | 79.9 | 81.0 |
| Breakfast cereals | 2.0 | 2.1 | 2.2 | 2.3 | 2.5 | 2.6 |
| Confectionery | 8.0 | 9.0 | 9.9 | 10.6 | 10.4 | 10.5 |
| Dairy | 187.5 | 193.1 | 198.4 | 202.4 | 206.4 | 211.3 |
| Edible oil | 5.5 | 5.6 | 5.9 | 6.3 | 6.8 | 6.9 |
| Frozen meat, seafood, fruit and vegetables | 6.5 | 6.7 | 7.0 | 7.3 | 7.8 | 7.6 |
| Ice cream | 1.3 | 1.4 | 1.5 | 1.5 | 1.7 | 1.8 |
| Ready meals | 6.2 | 6.6 | 7.1 | 7.6 | 8.5 | 9.3 |
| Rice, pasta and noodles | 5.5 | 5.7 | 5.9 | 6.2 | 7.2 | 6.7 |
| Sauces, dressings and condiments | 3.4 | 3.5 | 3.6 | 3.7 | 3.9 | 3.9 |
| Savoury snacks | 1.6 | 1.7 | 1.7 | 1.8 | 1.9 | 1.9 |
| Shelf stable meat, seafood, fruit and vegetables | 6.0 | 6.1 | 6.3 | 6.5 | 6.9 | 6.7 |
| Soup | 1.6 | 1.6 | 1.7 | 1.8 | 1.9 | 2.0 |
| Spreads | 11.9 | 12.4 | 13.0 | 14.0 | 14.8 | 14.7 |
| Sweet biscuits, snack bars and fruit snacks | 10.0 | 10.3 | 10.7 | 11.2 | 11.2 | 11.4 |
| Source: Euromonitor International, 2022 | ||||||
| Category | Annual growth (%) 2020-2021 | CAGR* (%) 2016-2021 | Total growth (%) 2016-2021 |
|---|---|---|---|
| Organic Packaged Food Total | 1.8 | 3.1 | 16.5 |
| Baby food | 5.6 | 4.4 | 24.1 |
| Bread | 1.4 | 3.5 | 18.8 |
| Breakfast cereals | 3.8 | 5.4 | 30.0 |
| Confectionery | 1.0 | 5.6 | 31.3 |
| Dairy | 2.3 | 2.4 | 12.7 |
| Edible oil | 1.4 | 4.6 | 25.5 |
| Frozen meat, seafood, fruit and vegetables | −2.6 | 3.2 | 16.9 |
| Ice cream | 5.6 | 6.7 | 38.5 |
| Ready meals | 8.6 | 8.4 | 50.0 |
| Rice, pasta and noodles | −7.5 | 4.0 | 21.8 |
| Sauces, dressings and condiments | 0.0 | 2.8 | 14.7 |
| Savoury snacks | 0.0 | 3.5 | 18.8 |
| Shelf stable meat, seafood, fruit and vegetables | −3.0 | 2.2 | 11.7 |
| Soup | 5.0 | 4.6 | 25.0 |
| Spreads | −0.7 | 4.3 | 23.5 |
| Sweet biscuits, snack bars and fruit snacks | 1.8 | 2.7 | 14.0 |
|
Source: Euromonitor International, 2022 *CAGR: Compound annual growth rate |
|||
| Category | 2022 | 2023 | 2024 | 2025 | 2026 |
|---|---|---|---|---|---|
| Organic packaged food total | 401.0 | 418.1 | 437.0 | 457.2 | 479.5 |
| Baby food | 7.8 | 8.5 | 9.3 | 10.3 | 11.6 |
| Bread | 83 | 85.4 | 88.1 | 90.9 | 93.9 |
| Breakfast cereals | 2.7 | 2.9 | 3.1 | 3.2 | 3.4 |
| Confectionery | 10.7 | 11.1 | 11.5 | 12.1 | 12.8 |
| Dairy | 220.2 | 229.8 | 240.4 | 251.9 | 264 |
| Edible oil | 7.2 | 7.6 | 8 | 8.3 | 8.7 |
| Frozen meat, seafood, fruit and vegetables | 7.8 | 8.1 | 8.3 | 8.6 | 8.9 |
| Ice cream | 2 | 2.1 | 2.3 | 2.4 | 2.6 |
| Ready meals | 10.3 | 11.4 | 12.6 | 13.8 | 15.1 |
| Rice, pasta and noodles | 7 | 7.3 | 7.6 | 8 | 8.5 |
| Sauces, dressings and condiments | 4.1 | 4.2 | 4.3 | 4.4 | 4.5 |
| Savoury snacks | 2 | 2 | 2.1 | 2.2 | 2.3 |
| Shelf stable meat, seafood, fruit and Vegetables | 6.9 | 7.1 | 7.3 | 7.5 | 7.8 |
| Soup | 2.1 | 2.2 | 2.2 | 2.3 | 2.4 |
| Spreads | 15.4 | 16.2 | 17.1 | 17.9 | 18.9 |
| Sweet biscuits, snack bars and fruit snacks | 11.8 | 12.2 | 12.8 | 13.4 | 14.1 |
| Source: Euromonitor International, 2022 | |||||
| Category | Annual growth (%) 2021-2022 | CAGR* (%) 2021-2026 | Total growth (%) 2021-2026 |
|---|---|---|---|
| Organic packaged food total | 4.7 | 4.5 | 24.4 |
| Baby food | 11.2 | 10.0 | 61.1 |
| Bread | 3.2 | 3.0 | 15.9 |
| Breakfast cereals | 5.9 | 5.5 | 30.8 |
| Confectionery | 5.5 | 4.0 | 21.9 |
| Dairy | 4.6 | 4.6 | 24.9 |
| Edible oil | 4.6 | 4.7 | 26.1 |
| Frozen meat, seafood, fruit and vegetables | 3.4 | 3.2 | 17.1 |
| Ice cream | 7.7 | 7.6 | 44.4 |
| Ready meals | 8.6 | 10.2 | 62.4 |
| rRce, pasta and noodles | 5.9 | 4.9 | 26.9 |
| Sauces, dressings and condiments | 2.2 | 2.9 | 15.4 |
| Savoury snacks | 4.3 | 3.9 | 21.1 |
| Shelf stable meat, seafood, fruit and Vegetablbs | 3.8 | 3.1 | 16.4 |
| Soup | 4.2 | 3.7 | 20.0 |
| Spreads | 5.3 | 5.2 | 28.6 |
| Sweet biscuits, snack bars and fruit snacks | 5.0 | 4.3 | 23.7 |
|
Source: Euromonitor International, 2022 *CAGR: Compound annual growth rate |
|||
Competition
The Belgian organic packaged food market is dominated by private labels and small, other, and artisanal brands with total market share of 78.4% in 2021, which has been steady since 2016.. Pur Natur is the largest brand and company, in terms of retails sales, followed by Zuiver Zuivel and Céréal Bio.
| Company | Retail sales (US$ millions) | Market share (%) |
|---|---|---|
| Private label | 209.2 | 54.2 |
| Others | 61.2 | 15.9 |
| Artisanal | 32.1 | 8.3 |
| Pur Natur (Pur Natur NV) | 23.9 | 6.2 |
| Zuiver Zuivel (Weerribben Zuivel BV) | 22.6 | 5.8 |
| Céréal Bio (Otsuka Holdings Co Ltd) | 9.8 | 2.5 |
| Côte d'Or (Mondelez International Inc) | 3.2 | 0.8 |
| Hipp (Hipp GmbH & Co Vertrieb KG) | 3.0 | 0.8 |
| Danone (Danone, Groupe) | 2.1 | 0.5 |
| Bonneterre (Ecotone) | 2.0 | 0.5 |
| EFarmz (EFarmz SA) | 1.8 | 0.5 |
| Oxfam (Oxfam International) | 1.8 | 0.5 |
| Ethiquable (Oxfam International) | 1.7 | 0.4 |
| Source: Euromonitor International, 2022 | ||
Distribution
Traditional retailers and supermarkets are the main outlets for organic packaged food sales. Ecommerce sales have grown steadily over 2016-2021 as Belgians have come to rely on online retailers as a result of the pandemic. However, according to a Euromonitor survey, only 9% of respondents (compared to 24% globally) say they buy items via social media platforms. Similarly, only 20% (compared to 37% globally) say they trust the information they get from their social media network while shopping. Over half (56%) reported that they did not interact with brands via their social media platforms, compared with a global average of 31%.
| Outlet Type | 2016 | 2021 | ||
|---|---|---|---|---|
| Actual | Share (%) | Actual | Share (%) | |
| Total | 482.2 | 581 | ||
| Convenience stores | 14.9 | 3.8 | 20.9 | 4.4 |
| Discounters | 20.7 | 5.4 | 28.4 | 6.0 |
| Forecourt retailers | 0.1 | 0.0 | 0.2 | 0.1 |
| Hypermarkets | 31.6 | 8.2 | 37.7 | 7.9 |
| Supermarkets | 215.8 | 55.8 | 262.8 | 55.4 |
| Traditional grocery retailers | 95.8 | 24.8 | 106.8 | 22.5 |
| Food/drink/tobacco specialists | 20.0 | 5.2 | 20.9 | 4.4 |
| Independent small grocers | 57.4 | 14.9 | 68.9 | 14.5 |
| Other grocery retailers | 18.4 | 4.7 | 17.1 | 3.6 |
| E-commerce | 7.5 | 2.0 | 17.3 | 3.8 |
| Source: Euromonitor International, 2022 | ||||
Subsector analysis
Organic baby food
The organic baby food market in Belgium expanded by a CAGR of 4.4% over 2016-2021, recording total retail sales of US$ 7.2 million in 2021. By absolute value terms, prepared baby food was the largest sub-category, accounting for 48.6% of the total organic baby food retail sales (US$3.5 million) in 2021. Organic other baby food saw the highest growth at a CAGR of 8.4% between 2016 and 2021. Organic baby food is set to experience gradual growth at a CAGR of 10.0% over 2021-2026, with total retail sales of US$11.6 million by 2026.
With respect to competition, Hipp GmbH & Co Vertrieb KG maintained its leadership in organic baby food throughout 2016 and 2021. In 2021, Hipp GmbH & Co Vertrieb KG accounted for 41.7% of the total organic baby food market in Belgium. Other major players were Inex NV SA with a market share of 11.0% and Hero Group GmbH with a market share of 8.7% in 2021.
| Category | 2016 | 2017 | 2018 | 2019 | 2020 | 2021 |
|---|---|---|---|---|---|---|
| Organic Baby Food Total | 5.8 | 6.0 | 6.5 | 7.1 | 6.8 | 7.2 |
| Milk Formula | 1.8 | 1.9 | 2.3 | 2.6 | 2.3 | 2.6 |
| Prepared Baby Food | 3.0 | 3.1 | 3.2 | 3.3 | 3.4 | 3.5 |
| Dried Baby Food | 0.7 | 0.7 | 0.8 | 0.8 | 0.8 | 0.8 |
| Other Baby Food | 0.2 | 0.3 | 0.3 | 0.3 | 0.3 | 0.3 |
| Source: Euromonitor International, 2022 | ||||||
| Category | Annual growth (%) 2020-2021 | CAGR* (%) 2016-2021 | Total growth (%) 2016-2021 |
|---|---|---|---|
| Organic Baby Food Total | 5.6 | 4.4 | 24.1 |
| Milk Formula | 11.5 | 7.6 | 44.4 |
| Prepared Baby Food | 2.9 | 3.1 | 16.7 |
| Dried Baby Food | 0.0 | 2.7 | 14.3 |
| Other Baby Food | 0.0 | 8.4 | 50.0 |
|
Source: Euromonitor International, 2022 *CAGR: Compound annual growth rate |
|||
| Company | Retail sales (US$ millions) | Market share (%) |
|---|---|---|
| Hipp GmbH & Co Vertrieb KG | 3.0 | 41.7 |
| Inex NV SA | 0.8 | 11.0 |
| Hero Group GmbH | 0.6 | 8.7 |
| Holle Baby Food GmbH | 0.4 | 5.4 |
| Joannusmolen BV | 0.2 | 3.0 |
| Source: Euromonitor International, 2022 | ||
| Category | 2022 | 2023 | 2024 | 2025 | 2026 |
|---|---|---|---|---|---|
| Organic Baby Food Total | 7.8 | 8.5 | 9.3 | 10.3 | 11.6 |
| Milk Formula | 2.9 | 3.4 | 3.9 | 4.7 | 5.7 |
| Prepared Baby Food | 3.7 | 3.9 | 4.1 | 4.3 | 4.5 |
| Dried Baby Food | 0.9 | 0.9 | 0.9 | 1.0 | 1.0 |
| Other Baby Food | 0.3 | 0.3 | 0.3 | 0.4 | 0.4 |
| Source: Euromonitor International, 2022 | |||||
| Category | Annual growth (%) 2021-2022 | CAGR* (%) 2021-2026 | Total growth (%) 2021-2026 |
|---|---|---|---|
| Organic Baby Food Total | 11.2 | 10.0 | 61.1 |
| Milk Formula | 17.5 | 17.0 | 119.2 |
| Prepared Baby Food | 4.4 | 5.2 | 28.6 |
| Dried Baby Food | 0.0 | 4.6 | 25.0 |
| Other Baby Food | 0.0 | 5.9 | 33.3 |
|
Source: Euromonitor International, 2022 *CAGR: Compound annual growth rate |
|||
Organic bread, spreads and breakfast cereals
The Belgian organic bread market is highly fragmented, with sales led by private label and artisanal producers, which accounted for 87.8% of the total organic bread sales in 2021. From 2016 to 2021, this market saw slow growth at a CAGR of 3.5%, with total retail sales of US$81.0 million in 2021. It is expected to see slower growth over 2021-2026, at a CAGR of 3.0%, with total retail sales of US$93.9 million in 2026.
Belgian organic spreads is dominated by private labels and Pur Natur, with sales accounted for 48.3% and 38.3% of the total organic spreads respectively in 2021. From 2016 to 2021, this market saw growth at a CAGR of 4.3%, with total retail sales of US$14.7 million in 2021. It is expected to see similar growth during the forecast period (2021-2026), at a CAGR of 4.0%, with total retail sales of US$18.9 million by 2026.
The retail value sales of the organic breakfast cereals increased fast by a CAGR of 5.4% during the 2016-2021 period, with total retail sales of US$2.6 million in 2021. This market is forecast to see growth between 2021 and 2026, at a CAGR of 4.7% and to be valued at US$3.4 million by 2026. Private labels dominate the category, accounting for 86.3% of the total retail value sales in 2021, followed by ViadeliceBio (3.1%) and Nestle (2.1%).
| Category | 2016 | 2017 | 2018 | 2019 | 2020 | 2021 |
|---|---|---|---|---|---|---|
| Breads | 68.2 | 71.0 | 73.6 | 76.0 | 79.9 | 81.0 |
| Breakfast cereals | 2.0 | 2.1 | 2.2 | 2.3 | 2.5 | 2.6 |
| Spreads total | 11.9 | 12.4 | 13.0 | 14.0 | 14.8 | 14.7 |
| Spreads | 7.1 | 7.4 | 7.8 | 8.4 | 9.1 | 8.8 |
| Honey | 4.8 | 5.0 | 5.2 | 5.6 | 5.7 | 5.9 |
| Source: Euromonitor International, 2022 | ||||||
| Category | Annual growth (%) 2020-2021 | CAGR* (%) 2016-2021 | Total growth (%) 2016-2021 |
|---|---|---|---|
| Breads | 1.4 | 3.5 | 18.8 |
| Breakfast cereals | 3.8 | 5.4 | 30.0 |
| Spreads total | −0.7 | 4.3 | 23.5 |
| Spreads | −3.4 | 4.4 | 23.9 |
| Honey | 3.4 | 4.2 | 22.9 |
|
Source: Euromonitor International, 2022 *CAGR: Compound annual growth rate |
|||
| Company | Retail sales (US$ million) | Market share (%) |
|---|---|---|
| Otsuka Holdings Co Ltd | 8.8 | 10.9 |
| Private Label | 39.7 | 49.0 |
| Artisanal | 31.4 | 38.8 |
| Others | 1.0 | 1.3 |
| Source: Euromonitor International, 2022 | ||
| Brand (company) | Retail sales (US$ millions) | Market share (%) |
|---|---|---|
| Private label | 2.2 | 86.3 |
| ViadéliceBio (ABCD Nutrition SA) | 0.1 | 3.1 |
| Nestlé (Cereal Partners Worldwide SA) | 0.1 | 2.1 |
| Others | 0.1 | 5.8 |
| Source: Euromonitor International, 2022 | ||
| Brand (company) | Retail sales (US$ million) | Market share (%) |
|---|---|---|
| Private label | 4.3 | 48.3 |
| Pur Natur (Pur Natur NV) | 3.4 | 38.3 |
| NewTree (Newtree SA) | 0.7 | 7.5 |
| Penotti (Peeters Produkten BV) | 0.3 | 3.0 |
| Others | 0.3 | 2.8 |
| Source: Euromonitor International, 2022 | ||
| Category | 2022 | 2023 | 2024 | 2025 | 2026 |
|---|---|---|---|---|---|
| Bread | 83.0 | 85.4 | 88.1 | 90.9 | 93.9 |
| Organic breakfast cereals | 2.7 | 2.9 | 3.1 | 3.2 | 3.4 |
| Organic spreads total | 15.5 | 16.3 | 17 | 17.9 | 18.9 |
| Spreads | 9.3 | 9.8 | 10.3 | 10.9 | 11.6 |
| Honey | 6.2 | 6.5 | 6.7 | 7.0 | 7.3 |
| Source: Euromonitor International, 2022 | |||||
| Category | Annual growth (%) 2021-2022 | CAGR* (%) 2021-2026 | Total growth (%) 2021-2026 |
|---|---|---|---|
| Bread | 3.2 | 3.0 | 15.9 |
| Organic breakfast cereals | 5.9 | 4.7 | 25.9 |
| Organic spreads total | 5.3 | 4.0 | 21.9 |
| Spreads | 6.0 | 4.5 | 24.7 |
| Honey | 4.1 | 3.3 | 17.7 |
|
Source: Euromonitor International, 2022 *CAGR: Compound annual growth rate |
|||
Organic ready meals and cooking ingredients
Organic ready meals have grown steadily since 2016. Consumers who did not have the skills or the time to cook from scratch due to home seclusion during the pandemic turned to ready meals. In particular, consumers turned to meal kits if they did not feel confident in the kitchen. These products contain all the necessary ingredients to make specific meals and are easy to prepare.
The organic ready meals saw continued growth at a CAGR of 8.4% over 2016-2021 with total retail sales of US$9.3 million in 2021. This market is expected to expand at a CAGR of 10.2% between 2021 and 2026, reaching total retail sales of US$15.1 million by 2026. Private labels lead Belgium's organic ready meal company, accounting for 55.4% of the organic ready meal sales in 2021. EFarmz is the leading brand or ready meals with 19.1% of this market in 2021.
The organic sauce, dressing and condiment market grew at a CAGR of 2.8% during the 2016-2021 period, with total retail sales valued at US$3.9 million in 2021. This sector is expected to see a moderate growth at a CAGR of 2.9% over 2021-2026 with sales of US$4.5 million by 2026. Private labels and other brands dominate the market with 62.4% share combined. Leading brands include Biofood (13.4%), Lima (13.2%) and Heinz (6.6%).
Retail sales of organic soup increased by a CAGR of 4.6% between 2016 and 2021, with total retail sales of US$2.0 million in 2021. The organic soup market is expected to see slow growth at a CAGR of 3.7% from 2021 to 2026, reaching total retail sales of US$2.4 million by 2026. Lima and Vetara lead the market with 29.8% and 15.3% market shares. Private labels and others combine for 29.9% Market share.
| Category | 2016 | 2017 | 2018 | 2019 | 2020 | 2021 |
|---|---|---|---|---|---|---|
| Organic vegetable and seed oil | 2.1 | 2.1 | 2.2 | 2.5 | 2.7 | 2.8 |
| Organic ready meals | 6.2 | 6.6 | 7.1 | 7.6 | 8.5 | 9.3 |
| Organic sauces, dressings and condiments | 3.4 | 3.5 | 3.6 | 3.7 | 3.9 | 3.9 |
| Organic soup | 1.6 | 1.6 | 1.7 | 1.8 | 1.9 | 2.0 |
| Source: Euromonitor International, 2022 | ||||||
| Category | Annual growth (%) 2020-2021 | CAGR* (%) 2016-2021 | Total growth (%) 2016-2021 |
|---|---|---|---|
| Organic vegetable and seed oil | 3.6 | 5.9 | 33.3 |
| Organic ready meals | 8.6 | 8.4 | 50.0 |
| Organic sauces, dressings and condiments | 0.0 | 2.8 | 14.7 |
| Organic soup | 5.0 | 4.6 | 25.0 |
|
Source: Euromonitor International, 2022 *CAGR: Compound annual growth rate |
|||
| Brand (company) | Retail sales (US$ millions) | Market share (%) |
|---|---|---|
| Private label | 5.1 | 55.4 |
| EFarmz (EFarmz SA) | 1.8 | 19.1 |
| Others | 1.7 | 18.1 |
| Foodmaker (Foodmaker NV) | 0.5 | 5.6 |
| Bioline (Bioline Europe NV) | 0.1 | 1.0 |
| Source: Euromonitor International, 2022 | ||
| Brand (company) | Retail sales (US$ millions) | Market share (%) |
|---|---|---|
| Private label | 1.6 | 41.8 |
| Others | 0.8 | 20.6 |
| Biofood (Damhert NV SA) | 0.5 | 13.4 |
| Lima (Hain Celestial Group Inc, The) | 0.5 | 13.2 |
| Heinz (Kraft Heinz Co) | 0.3 | 6.6 |
| Source: Euromonitor International, 2022 | ||
| Brand (company) | Retail sales (US$ millions) | Market share (%) |
|---|---|---|
| Lima (Hain Celestial Group Inc, The) | 0.6 | 29.8 |
| Vetara (Udea BV) | 0.3 | 15.3 |
| Others | 0.3 | 15.3 |
| Private label | 0.3 | 14.6 |
| La Ferme d'Anchin (Destombes SARL) | 0.3 | 14.5 |
| Source: Euromonitor International, 2022 | ||
| Category | 2022 | 2023 | 2024 | 2025 | 2026 |
|---|---|---|---|---|---|
| Organic vegetable and seed oil | 3.0 | 3.1 | 3.3 | 3.5 | 3.6 |
| Organic ready meals | 10.3 | 11.4 | 12.6 | 13.8 | 15.1 |
| Organic sauces, dressings and condiments | 4.1 | 4.2 | 4.3 | 4.4 | 4.5 |
| Organic soup | 2.1 | 2.2 | 2.2 | 2.3 | 2.4 |
| Source: Euromonitor International, 2022 | |||||
| Category | Annual growth (%) 2021-2022 | CAGR* (%) 2021-2026 | Total growth (%) 2021-2026 |
|---|---|---|---|
| Organic vegetable and seed oil | 2.8 | 5.2 | 28.6 |
| Organic ready meals | 8.6 | 10.2 | 62.4 |
| Organic sauces, dressings and condiments | 2.2 | 2.9 | 15.4 |
| Organic soup | 4.2 | 3.7 | 20.0 |
|
Source: Euromonitor International, 2022 *CAGR: Compound annual growth rate |
|||
Organic dairy
The Belgian organic dairy market grew at a CAGR of 12.7% over 2016 to 2021, recording total retail sales of US$211.3 million in 2021. In absolute value terms, organic milk was the largest sub-category, accounting for 54.8% of the total organic dairy retail sales (US$211.3 million) in 2021. Flavoured milk drinks sub saw the fastest growth at a CAGR of 25.0% between 2016 and 2021. Organic dairy sector is forecast to see slower growth at a CAGR of 4.6% over 2021 to 2026, reaching total retail sales of US$264.0 million by 2026.
The Belgian organic dairy market is dominated by private labels and other brands, which accounted for 78.0% of the total organic dairy sales in 2021. Weerribben Zuivel BV was the only company with double digit market share, with a market share of 10.7% in 2021.
| Category | 2016 | 2017 | 2018 | 2019 | 2020 | 2021 |
|---|---|---|---|---|---|---|
| Organic Dairy Total | 187.5 | 193.1 | 198.4 | 202.4 | 206.4 | 211.3 |
| Butter and Spreads | 4.9 | 5.0 | 5.1 | 5.4 | 5.5 | 5.6 |
| Cheese | 60.7 | 62.8 | 64.8 | 66.1 | 68.5 | 70.7 |
| Cream | 1.9 | 2.0 | 2.0 | 2.1 | 2.2 | 2.2 |
| Flavoured Milk Drinks | 0.8 | 0.9 | 0.9 | 0.9 | 0.9 | 1.0 |
| Fromage Frais and Quark | 3.5 | 3.5 | 3.6 | 3.7 | 3.7 | 3.8 |
| Yoghurt | 30.0 | 31.3 | 32.5 | 34.4 | 33.7 | 34.4 |
| Source: Euromonitor International, 2022 | ||||||
| Category | Annual growth (%) 2020-2021 | CAGR* (%) 2016-2021 | Total growth (%) 2016-2021 |
|---|---|---|---|
| Organic Dairy Total | 2.3 | 2.4 | 12.7 |
| Butter and Spreads | 1.8 | 2.7 | 14.3 |
| Cheese | 3.1 | 3.1 | 16.5 |
| Cream | 0.0 | 3.0 | 15.8 |
| Flavoured Milk Drinks | 10.0 | 4.6 | 25.0 |
| Fresh Cheese and Quark | 2.6 | 1.7 | 8.6 |
| Yoghurt | 2.0 | 2.8 | 14.7 |
|
Source: Euromonitor International, 2022 *CAGR: Compound annual growth rate |
|||
| Company | Retail sales (US$ millions) | Market share (%) |
|---|---|---|
| Private Label | 130.1 | 61.6 |
| Others | 34.7 | 16.4 |
| Weerribben Zuivel BV | 22.6 | 10.7 |
| Pur Natur NV | 20.4 | 9.6 |
| Danone, Groupe | 2.1 | 1.0 |
| Rapunzel Naturkost GmbH | 0.6 | 0.3 |
| Lactalis, Groupe | 0.6 | 0.3 |
| Source: Euromonitor International, 2022 | ||
| Category | 2022 | 2023 | 2024 | 2025 | 2026 |
|---|---|---|---|---|---|
| Organic Dairy Total | 220.2 | 229.8 | 240.4 | 251.9 | 264.0 |
| Butter and Spreads | 5.9 | 6.1 | 6.5 | 6.8 | 7.3 |
| Cheese | 74.0 | 77.4 | 81.2 | 85.2 | 89.6 |
| Cream | 2.3 | 2.4 | 2.5 | 2.6 | 2.7 |
| Flavoured Milk Drinks | 1.0 | 1.1 | 1.1 | 1.2 | 1.3 |
| Fresh Cheese and Quark | 4.0 | 4.1 | 4.2 | 4.4 | 4.5 |
| Yoghurt | 36.0 | 37.8 | 39.8 | 42.1 | 44.5 |
| Source: Euromonitor International, 2022 | |||||
| Category | Annual growth (%) 2021-2022 | CAGR* (%) 2021-2026 | Total growth (%) 2021-2026 |
|---|---|---|---|
| Organic Dairy Total | 4.6 | 4.6 | 24.9 |
| Butter and Spreads | 6.8 | 5.4 | 30.4 |
| Cheese | 4.9 | 4.9 | 26.7 |
| Cream | 3.7 | 4.2 | 22.7 |
| Flavoured Milk Drinks | 7.7 | 5.4 | 30.0 |
| Fresh Cheese and Quark | 2.2 | 3.4 | 18.4 |
| Yoghurt | 5.4 | 5.3 | 29.4 |
|
Source: Euromonitor International, 2022 *CAGR: Compound annual growth rate |
|||
Organic processed meat, seafood, fruits and vegetable
Retail sales of organic frozen meat, seafood, fruits and vegetable segment increased by a CAGR of 3.2% during the 2016 to 2021 period, with total retail sales of US$7.6 million in 2021. This market contracted by 2.6% between 2020 and 2021. However, it is forecast to recover in 2022 and expand by a CAGR of 3.2% over 2022 to 2026, reaching total retail sales of US$8.6 million by 2026.
The organic shelf stable meat, seafood, fruits and vegetable sector grew at a CAGR of 2.2% during the 2016 to 2021 period, with total retail sales valued at US$6.7 million in 2021. This category contracted by 3.0% between 2020 and 2021, but is expected to see a moderate growth at a CAGR of 3.1% during the forecast period and to be valued at US$7.5 million by 2026.
According to Euromonitor, environmental concerns and the focus on animal welfare could positively impact sales of frozen meat and seafood during the forecast period. In addition, more consumers may opt for organic or higher-quality frozen meat and seafood for health and sustainability, even if this means paying a price premium and moderating the quantity they consume.
| Category | 2016 | 2017 | 2018 | 2019 | 2020 | 2021 |
|---|---|---|---|---|---|---|
| Organic frozen meat, seafood, fruit and vegetables | 6.5 | 6.7 | 7.0 | 7.3 | 7.8 | 7.6 |
| Organic shelf stable meat, seafood, fruit and vegetables | 6.0 | 6.1 | 6.3 | 6.5 | 6.9 | 6.7 |
| Source: Euromonitor International, 2022 | ||||||
| Category | Annual growth (%) 2020-2021 | CAGR* (%) 2016-2021 | Total growth (%) 2016-2021 |
|---|---|---|---|
| Organic frozen meat, seafood, fruit and vegetables | −2.6 | 3.2 | 16.9 |
| Organic shelf stable meat, seafood, fruit and segetables | −3.0 | 2.2 | 11.7 |
|
Source: Euromonitor International, 2022 *CAGR: Compound annual growth rate |
|||
| Company | Retail sales (US$ millions) | Market share (%) |
|---|---|---|
| Others | 4.3 | 56.6 |
| Private label | 3.3 | 43.4 |
| Source: Euromonitor International, 2022 | ||
| Company | Retail sales (US$ millions) | Market share (%) |
|---|---|---|
| Others | 5.4 | 80.0 |
| Private label | 1.3 | 20.0 |
| Source: Euromonitor International, 2022 | ||
| Category | 2022 | 2023 | 2024 | 2025 | 2026 |
|---|---|---|---|---|---|
| Organic frozen meat, seafood, fruit and vegetables | 7.6 | 7.8 | 8.1 | 8.3 | 8.6 |
| Organic shelf stable meat, seafood, fruit and vegetables | 6.7 | 6.9 | 7.1 | 7.3 | 7.5 |
| Source: Euromonitor International, 2022 | |||||
| Category | Annual growth (%) 2021-2022 | CAGR* (%) 2021-2026 | Total growth (%) 2021-2026 |
|---|---|---|---|
| Organic frozen meat, seafood, fruit and vegetables | 3.4 | 3.2 | 17.1 |
| Organic shelf stable meat, seafood, fruit and vegetables | 3.8 | 3.1 | 16.4 |
|
Source: Euromonitor International, 2022 *CAGR: Compound annual growth rate |
|||
Organic rice and pasta
During the 2016 to 2021 period, the Belgian organic rice and pasta market saw growth at a CAGR of 4.0% and was valued at US$36.7 million in 2021. Compared to other organic packaged food categories, organic rice and pasta category underperformed and contracted by 7.5% between 2020 and 2021. According to Euromonitor (2022), the decline in sales could have been due to the stockpiling effect during the 2020 panic-buying period, which limited new purchases in 2021. This market is forecast to grow at a CAGR of 4.9%, reaching total retail sales of US$8.5 million by 2026.
In 2021, the retail value sales of the Belgium organic rice and past sector are led by Private labels with a market share of 64.9%, followed by Oxfam international (14.3%) and Hain Celestial Group (7.3%).
| Category | 2016 | 2017 | 2018 | 2019 | 2020 | 2021 |
|---|---|---|---|---|---|---|
| Organic Rice and Pasta Total | 5.5 | 5.7 | 5.9 | 6.2 | 7.2 | 6.7 |
| Rice | 1.5 | 1.6 | 1.7 | 1.8 | 2.0 | 1.9 |
| Pasta | 4.0 | 4.1 | 4.2 | 4.5 | 5.2 | 4.8 |
| Source: Euromonitor International, 2022 | ||||||
| Category | Annual growth (%) 2020-2021 | CAGR* (%) 2016-2021 | Total growth (%) 2016-2021 |
|---|---|---|---|
| Organic Rice and Pasta Total | −7.5 | 4.0 | 21.8 |
| Organic Rice | −5.3 | 4.8 | 26.7 |
| Organic Pasta | −8.3 | 3.7 | 20.0 |
|
Source: Euromonitor International, 2022 *CAGR: Compound annual growth rate |
|||
| Company | Retail sales (US$ millions) | Market share (%) |
|---|---|---|
| Private Label | 3.7 | 64.9 |
| Oxfam International | 0.8 | 14.3 |
| Hain Celestial Group Inc, The | 0.4 | 7.3 |
| Others | 0.4 | 7.3 |
| Barilla Holding SpA | 0.2 | 3.4 |
| Soubry Joseph NV | 0.2 | 2.7 |
| Source: Euromonitor International, 2022 | ||
| Category | 2022 | 2023 | 2024 | 2025 | 2026 |
|---|---|---|---|---|---|
| Organic Rice and Pasta Total | 7.0 | 7.3 | 7.6 | 8.0 | 8.5 |
| Organic Rice | 2.0 | 2.1 | 2.3 | 2.4 | 2.6 |
| Organic Pasta | 5.0 | 5.2 | 5.4 | 5.6 | 5.9 |
| Source: Euromonitor International, 2022 | |||||
| Category | Annual growth (%) 2021-2022 | CAGR* (%) 2021-2026 | Total growth (%) 2021-2026 |
|---|---|---|---|
| Organic Rice and Pasta Total | 5.9 | 4.9 | 26.9 |
| Organic Rice | 7.7 | 6.5 | 36.8 |
| Organic Pasta | 5.1 | 4.2 | 22.9 |
|
Source: Euromonitor International, 2022 *CAGR: Compound annual growth rate |
|||
Organic snacks
The Belgian organic confectionery market grew at a CAGR of 5.6% over 2016-2021, with total retail sales of US$10.5 million in 2021. This market is expected to expand by a CAGR of 4.0% over 2021-2026 and to be valued at US$12.8 million by 2026. Private label is the leading chocolate confectionery brand in Belgium, with a market share of 32.4% in 2021, followed by Mondelez (30.8% and other brands (17.3%).
The organic ice cream sector saw growth at a CAGR of 6.7% over 2016-2021, with total retail sale of US$1.8 million in 2021. This market is expected to expand at a CAGR of 7.6% over 2021-2026, reaching total retail sales of US$2.6 million by 2026. Private labels and artisanal brands are the leading organic ice cream brands with a combined market share of 76.7% in 2021, followed by Pur Natur and Glace Morane.
The retail value sales of the organic savoury snacks category increased by a CAGR of 3.5% over 2016-2021, with total retail sales valued at US$1.9 million in 2021. Organic savoury snacks are expected to recover and see moderate growth at a CAGR of 3.9% over 2021-2026, with total retail saled of US$2.2 million by 2026. The sales of this sector is dominated by nuts, seeds and trail mix by private labels and other brands, representing 66.6% of the market in 2021.
The organic sweet snack category saw growth at a CAGR of 2.7% over 2016-2021, with total retail sales of US$11.4 million in 2021. The retail sales of this market is expected to increase by a CAGR of 23.7% over 2021-2026, reaching total retail sales of US$13.4 million by 2026. The organic sweet snack market in Belgium is dominated by private labels and other brands, making up 68.1%, with other companies earning single digit market shares. Cereal Bio is the leading sweet snack company, followed by Oxfam, Biosoleil, and Bjorg.
According to Euromonitor, sales of organic snacks could benefit with more consumers returning to their pre-pandemic habits since organic snacks are not only a convenient option but also perceived as healthier. Consumers will also continue looking for options that are better for them as well as better for the environment.
| Category | 2016 | 2017 | 2018 | 2019 | 2020 | 2021 |
|---|---|---|---|---|---|---|
| Organic Confectionery | 8.0 | 9.0 | 9.9 | 10.6 | 10.4 | 10.5 |
| Organic Ice Cream | 1.3 | 1.4 | 1.5 | 1.5 | 1.7 | 1.8 |
| Organic sweet biscuits, snack bars and fruit snacks | 10.0 | 10.3 | 10.7 | 11.2 | 11.2 | 11.4 |
| Organic cereal bars | 2.3 | 2.3 | 2.4 | 2.6 | 2.4 | 2.4 |
| Organic fruit snacks | 0.9 | 0.9 | 0.9 | 1.0 | 1.0 | 1.0 |
| Organic sweet biscuits | 6.9 | 7.1 | 7.4 | 7.7 | 7.9 | 8.0 |
| Organic savoury snacks | 1.6 | 1.7 | 1.7 | 1.8 | 1.9 | 1.9 |
| Organic nuts, seeds and trail mixes | 1.6 | 1.7 | 1.7 | 1.8 | 1.9 | 1.9 |
| Source: Euromonitor International, 2022 | ||||||
| Category | Annual growth (%) 2020-2021 | CAGR* (%) 2016-2021 | Total growth (%) 2016-2021 |
|---|---|---|---|
| Organic Confectionery | 1.0 | 5.6 | 31.3 |
| Organic Ice Cream | 5.6 | 6.7 | 38.5 |
| Organic sweet biscuits, snack bars and fruit snacks | 1.8 | 2.7 | 14.0 |
| Organic cereal bars | 0.0 | 0.9 | 4.3 |
| Organic fruit snacks | 0.0 | 2.1 | 11.1 |
| Organic sweet biscuits | 1.3 | 3.0 | 15.9 |
| Organic savoury snacks | 0.0 | 3.5 | 18.8 |
| Organic nuts, seeds and trail mixes | 0.0 | 3.5 | 18.8 |
|
Source: Euromonitor International, 2022 *CAGR: Compound annual growth rate |
|||
| Company | Retail sales (US$ millions) | Market share (%) |
|---|---|---|
| Private Label | 3.4 | 32.4 |
| Mondelez International Inc | 3.2 | 30.8 |
| Others | 1.8 | 17.3 |
| Oxfam International | 1.7 | 16.5 |
| Libeert SA | 0.2 | 1.5 |
| Belvas SA | 0.1 | 1.4 |
| Source: Euromonitor International, 2022 | ||
| Company | Retail sales (US$ millions) | Market share (%) |
|---|---|---|
| Private Label | 0.7 | 39.3 |
| Artisanal | 0.7 | 37.4 |
| Pur Natur NV | 0.1 | 8.2 |
| Glaces Morane | 0.1 | 8.2 |
| Others | 0.1 | 6.9 |
| Source: Euromonitor International, 2022 | ||
| Company | Retail sales (US$ millions) | Market share (%) |
|---|---|---|
| Others | 0.8 | 42.1 |
| Private label | 0.5 | 24.5 |
| Markal (Markal SAS) | 0.4 | 20.5 |
| Ekoland (Udea BV) | 0.2 | 13.0 |
| Source: Euromonitor International, 2022 | ||
| Company | Retail sales (US$ millions) | Market share (%) |
|---|---|---|
| Private label | 6.3 | 55.3 |
| Others | 1.5 | 12.8 |
| Céréal Bio (Otsuka Holdings Co Ltd) | 1.0 | 8.8 |
| Oxfam (Oxfam International) | 0.8 | 7.0 |
| Biosoleil (Alpes Biscuits Sarl) | 0.8 | 6.8 |
| Bjorg (Ecotone) | 0.8 | 6.6 |
| Source: Euromonitor International, 2022 | ||
| Category | 2022 | 2023 | 2024 | 2025 | 2026 |
|---|---|---|---|---|---|
| Organic Confectionery | 10.7 | 11.1 | 11.5 | 12.1 | 12.8 |
| Organic Ice Cream | 2.0 | 2.1 | 2.3 | 2.4 | 2.6 |
| Organic sweet biscuits, snack bars and fruit snacks | 11.4 | 11.8 | 12.2 | 12.8 | 13.4 |
| Organic cereal bars | 2.4 | 2.5 | 2.5 | 2.6 | 2.7 |
| Organic fruit snacks | 1.0 | 1.0 | 1.0 | 1.0 | 1.1 |
| Organic sweet biscuits | 8.0 | 8.3 | 8.7 | 9.1 | 9.6 |
| Organic savoury snacks | 1.9 | 2.0 | 2.0 | 2.1 | 2.2 |
| Organic nuts, seeds and trail mixes | 1.9 | 2.0 | 2.0 | 2.1 | 2.2 |
| Source: Euromonitor International, 2022 | |||||
| Category | Annual growth (%) 2021-2022 | CAGR* (%) 2021-2026 | Total growth (%) 2021-2026 |
|---|---|---|---|
| Organic Confectionery | 5.5 | 4.0 | 21.9 |
| Organic Ice Cream | 7.7 | 7.6 | 44.4 |
| Organic sweet biscuits, snack bars and fruit snacks | 5.0 | 4.3 | 23.7 |
| Organic cereal bars | 3.6 | 3.1 | 16.7 |
| Organic fruit snacks | 0.0 | 1.9 | 10.0 |
| Organic sweet biscuits | 5.9 | 5.0 | 27.5 |
| Organic savoury snacks | 4.3 | 3.9 | 21.1 |
| Organic nuts, seeds and trail mixes | 4.3 | 3.9 | 21.1 |
|
Source: Euromonitor International, 2022 *CAGR: Compound annual growth rate |
|||
New product launch analysis
From 2017 to 2021, 1,955 organic packaged food products were introduced in Belgium, with the highest number of new products launched in 2021. The most popular product claim was for environmentally friendly packaging, followed by low/no/reduced allergen and vegan/no animal ingredients. Companies with the highest number of new product launches was Carrefour, followed by Colruy and Albert Heijn. Nearly half of product launches were new products. The top five packaging types were flexible packaging, bottle, jar, tub, and carton.
| Product attributes | Number of new products by year | Total | ||||
|---|---|---|---|---|---|---|
| 2017 | 2018 | 2019 | 2020 | 2021 | ||
| Yearly product launches | 273 | 364 | 433 | 396 | 489 | 1955 |
| Top 10 claims | ||||||
| Ethical - Environmentally Friendly Package | 48 | 87 | 136 | 150 | 176 | 597 |
| Low/No/Reduced Allergen | 84 | 97 | 121 | 105 | 111 | 518 |
| Vegan/No Animal Ingredients | 74 | 99 | 119 | 91 | 133 | 516 |
| Gluten Free | 79 | 80 | 105 | 87 | 102 | 453 |
| Ethical - Sustainable (Habitat/Resources) | 34 | 74 | 114 | 95 | 125 | 442 |
| Ethical - Recycling | 34 | 48 | 74 | 103 | 101 | 360 |
| Ethical - Environmentally Friendly Product | 26 | 63 | 101 | 69 | 98 | 357 |
| Ethical - Human | 25 | 70 | 96 | 58 | 99 | 348 |
| Social Media | 28 | 37 | 79 | 74 | 74 | 292 |
| No Additives/Preservatives | 31 | 38 | 44 | 46 | 71 | 230 |
| Top 10 companies | ||||||
| Carrefour | 2 | 5 | 20 | 12 | 9 | 48 |
| Colruyt | 4 | 2 | 9 | 21 | 9 | 45 |
| Albert Heijn | 0 | 0 | 8 | 34 | 2 | 44 |
| Rapunzel Naturkost | 8 | 6 | 0 | 0 | 24 | 38 |
| Nutrition & Santé | 8 | 2 | 5 | 5 | 0 | 20 |
| Pur Natur | 2 | 5 | 5 | 5 | 2 | 19 |
| Delhaize Group | 7 | 1 | 4 | 6 | 1 | 19 |
| Groupe Ekibio | 2 | 3 | 2 | 7 | 5 | 19 |
| De Smaakspecialist | 0 | 6 | 5 | 1 | 6 | 18 |
| EcoFinia | 1 | 5 | 12 | 0 | 0 | 18 |
| Top 5 flavours (including blend) | ||||||
| Unflavoured/Plain | 99 | 114 | 139 | 134 | 183 | 669 |
| Chocolate | 3 | 8 | 8 | 11 | 10 | 40 |
| Lemon | 0 | 6 | 8 | 4 | 4 | 22 |
| Hazelnut | 1 | 3 | 6 | 2 | 7 | 19 |
| Coconut | 5 | 4 | 3 | 2 | 5 | 19 |
| Top 5 ingredients | ||||||
| Waters (Food) | 68 | 75 | 104 | 98 | 74 | 419 |
| Cane Sugar (Food) | 51 | 72 | 84 | 81 | 84 | 372 |
| Sea Salt (Food) | 61 | 77 | 71 | 63 | 72 | 344 |
| Sunflower Seed Oil (Food) | 43 | 61 | 63 | 72 | 83 | 322 |
| Salt (Food) | 41 | 50 | 64 | 81 | 71 | 307 |
| Launch types | ||||||
| New Product | 200 | 231 | 208 | 146 | 239 | 1,024 |
| New Variety/Range Extension | 65 | 107 | 189 | 199 | 207 | 767 |
| New Packaging | 4 | 20 | 31 | 45 | 34 | 134 |
| Relaunch | 2 | 3 | 4 | 3 | 7 | 19 |
| New Formulation | 2 | 3 | 1 | 3 | 2 | 11 |
| Top 5 package types | ||||||
| Flexible | 96 | 123 | 188 | 171 | 196 | 774 |
| Bottle | 42 | 49 | 35 | 27 | 80 | 233 |
| Jar | 26 | 38 | 26 | 49 | 78 | 217 |
| Tub | 34 | 42 | 38 | 41 | 33 | 188 |
| Carton | 20 | 37 | 54 | 25 | 22 | 158 |
| Product origin | ||||||
| Imported | 79 | 76 | 109 | 73 | 95 | 432 |
| Not imported | 9 | 47 | 61 | 48 | 54 | 219 |
| Source: Mintel GNPD, 2022 | ||||||
New product examples
Organic Clover Honey

| Manufacturer | Weyn's Honingbedrijf |
|---|---|
| Brand | Weyn's |
| Category | Sweet spreads |
| Sub-category | Honey |
| Market | Belgium |
| Store name | Het Natuurhuis |
| Store type | Natural / health food store |
| Price in US dollars | 10.10 |
Weyn's Miel de Trèfle Bio (Organic Clover Honey) has been added to the range. The artisan product from Argentina retails in a 450 gram pack bearing the EU Organic logo.
Dark Chocolate Rawnola

| Manufacturer | All Good |
|---|---|
| Brand | All Good by Julie's Lifestyle |
| Category | Breakfast cereals |
| Sub-category | Cold cereals |
| Market | Belgium |
| Store name | Het Natuurhuis |
| Store type | Natural / health food store |
| Price in US dollars | 12.48 |
All Good by Julie's Lifestyle Chocolat Pur Rawnola (Dark Chocolate Rawnola) comprises a crunchy raw granola with sprouted buckwheat, almonds, dates and the intense flavour of pure cacao. The vegan and keto friendly product is said to provide premium taste and maximum pleasure, and can be eaten for breakfast or as a snack on-the-go. It is high fibre, is sweetened with dates and maple syrup, and is free from gluten and lactose. The product retails in a 250 gram pack bearing the EU Organic logo.
Protein Bowl Soup

| Manufacturer | Allos Hof-Manufaktur |
|---|---|
| Brand | Allos Soup! |
| Category | Soup |
| Sub-category | Wet soup |
| Market | Belgium |
| Store name | Bio Planet |
| Store type | Natural / health food store |
| Price in US dollars | 3.42 |
Allos Soup! Soupe Biologique de Lentilles, Pois Chiches et Protéine de Soja (Protein Bowl Soup) is now available. This certified organic product comprises chickpeas and lentils and is suitable for vegans. It can be heated in a pot or in a microwave, and retails in a 350 gram pack sufficient for one serving, bearing the EU Organic logo.
Organic Spicy Nasi Balls
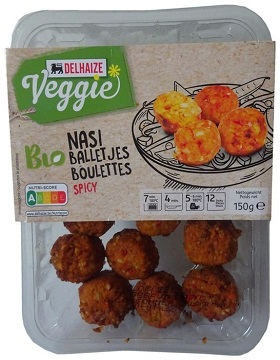
| Manufacturer | Delhaize Le Lion / De Leeuw |
|---|---|
| Brand | Delhaize Veggie |
| Category | Snacks |
| Sub-category | Hors d'oeuvres / Canape |
| Market | Belgium |
| Store name | Delhaize |
| Store type | Supermarket |
| Price in US dollars | 3.33 |
Delhaize Veggie Boulettes Nasi Bio Spicy (Organic Spicy Nasi Balls) have been added to the range. The vegetarian product is rich in proteins and a source of fibres. It scores an A on the Nutri-Score and retails in a 150 gram 100% recycled pack containing 12 units and featuring the EU Organic and FSC Mix logos.
Organic standards and labelling
Belgium follows EU regulations pertaining to organic products. Foods may only be marked as "organic" if at least 95% of their ingredients are organic. Organic ingredients in non-organic food may be listed as organic in the list of ingredients, as long as the ingredient have been produced in accordance with EU organic legislation.

Organic products sold in Belgium must display EU's organic farming logo. The distribution of organic products from non-EU countries in the EU market is only permitted when they are produced and controlled under equivalent conditions as those for EU organic producers, for example, the Canada-EU organic equivalency agreement.
The EU - Canada Organic Equivalency Arrangement (EUCOEA) allows for Canadian products to be exported and marketed as organic to Belgium, provided they are certified under the Canadian Food Inspection Agency (CFIA) Canada Organic Regime or EU organic system. Visit European Union - Canada Organic Equivalency Arrangement (EUCOEA) overview for an overview of the EUCOEA. A list of certification bodies accredited by the Canadian Food Inspection Agency can be found on the List of certification bodies under the Canada Organic Regime page.
For more information
The Canadian Trade Commissioner Service:
International Trade Commissioners can provide Canadian industry with on-the-ground expertise regarding market potential, current conditions and local business contacts, and are an excellent point of contact for export advice.
More agri-food market intelligence:
International agri-food market intelligence
Discover global agriculture and food opportunities, the complete library of Global Analysis reports, market trends and forecasts, and information on Canada's free trade agreements.
Agri-food market intelligence service
Canadian agri-food and seafood businesses can take advantage of a customized service of reports and analysis, and join our email subscription service to have the latest reports delivered directly to their inbox.
More on Canada's agriculture and agri-food sectors:
Canada's agriculture sectors
Information on the agriculture industry by sector. Data on international markets. Initiatives to support awareness of the industry in Canada. How the department engages with the industry.
Resources
- Canada Food Inspection Agency, European Union – Canada Organic Equivalency Arrangement (EUCOEA) Overview
- Euromonitor International:
- Organic Packaged Food in Belgium (2022)
- Mintel, 2022
- Global Trade Tracker, 2022
- U.S. International Trade Administration - Belgium – Country Commercial Guide
- CIA World fact book - Belgium
Health and Wellness Series – Organic packaged food trends in Belgium
Global Analysis Report
Prepared by: Kris Clipsham, Market Analyst
© His Majesty the King in Right of Canada, represented by the Minister of Agriculture and Agri-Food (2022).
Photo credits
All photographs reproduced in this publication are used by permission of the rights holders.
All images, unless otherwise noted, are copyright His Majesty the King in Right of Canada.
To join our distribution list or to suggest additional report topics or markets, please contact:
Agriculture and Agri-Food Canada, Global Analysis1341 Baseline Rd, Tower 5, 3rd floor
Ottawa ON K1A 0C5
Canada
Email: aafc.mas-sam.aac@agr.gc.ca
The Government of Canada has prepared this report based on primary and secondary sources of information. Although every effort has been made to ensure that the information is accurate, Agriculture and Agri-Food Canada (AAFC) assumes no liability for any actions taken based on the information contained herein.
Reproduction or redistribution of this document, in whole or in part, must include acknowledgement of agriculture and agri-food Canada as the owner of the copyright in the document, through a reference citing AAFC, the title of the document and the year. Where the reproduction or redistribution includes data from this document, it must also include an acknowledgement of the specific data source(s), as noted in this document.
Agriculture and Agri-Food Canada provides this document and other report services to agriculture and food industry clients free of charge.