

Note: This report includes forecasting data that is based on baseline historical data.
Executive summary
Denmark was the world's 9th largest organic packaged food market in 2021, based on retail value sales. Danes are among the world's top consumers of organic produce, and veganism is a growing trend among young people. Canadian organic packaged food exporters have preferential access to the Danish market under the Canada - European Union Comprehensive Economic and Trade Agreement (CETA).
The organic packaged food market in Denmark was valued at US$1.1 billion in 2021. During the 2016-2021 period, this market gradually grew at a compound annual growth rate (CAGR) of 10.4%. The top three organic packaged food categories, in terms of retail value sales, were organic dairy products, accounting for 47.0% of Denmark total organic packaged food market, with total retail sales of US$500.1 million in 2021, organic rice, pasta and noodles (7.4%, US$78.4 million) and organic bread (6.2%, US$65.8 million).
During the forecast period, Denmark organic packaged food market is expected to grow at a CAGR of 4.5% and to be valued at US$1.3 billion by 2026. Organic ice cream is expected to see the fastest growth at a CAGR of 7.3%, reaching total retail sales of US$44.2 million by 2026. Organic confectionery is also forecast to show relatively higher growth than other organic packaged food categories, at a CAGR of 7.2%, reaching total retail value sales of US$45.2 million by 2026.
In 2021, the top three organic packaged food companies accounted for 39.5% of total market share. Arla Foods Amba continues to be the largest company, in terms of retails value sales, followed by Thise Mejeri Amba, and Midsona AB. Private labels continued to show strong presence in the market, with total market share of 25.0% in 2021.
Key demographic indicators
Following an annual gross domestic product (GDP) growth at 4.7% in 2021, the Denmark's economy is expected to expand by 3.0% in 2022 and 1.4% in 2023 (The Word Bank & OECD 2022). The OECD recently indicated that "the resilience of the Danish economy is underpinned by its low reliance on fossil fuel imports and strong household, corporate and government balance sheets. However, consumer and business confidence have fallen considerably and inflation has increased to over 6%". Over 2022 to 2040, Denmark's economy is forecast to expand at a CAGR of 1.6%, in comparison to the average of 1.6% in Western Europe (Euromonitor International, 2022).
Over 2021 to 2040 forecast period, the number of households is expected to grow moderately in Denmark, with single person remaining the dominant household type. Disposable income per household in Denmark is forecast to increase by 25.5% in real terms over the same period, while the unemployment rate is set to shrink and account for 5.0% of total economically active population by 2040.Couples with children will retain the highest spending power among household types. And couples with children will stand for 34.5% of total spending by 2040 and constitute 17.1% of all households (Euromonitor International, 2022).
In terms of Danish consumer behaviour, when buying food and drink, low price is still the most influential factor (cited by 43.0% of respondents). However, when asked what they would pay a premium for, almost a quarter (24.0%) cited non-GMO ingredients, and 19.0% (versus 12.0% globally) said premium or gourmet products (Euromonitor International, 2021). Danes are among the world's top consumers of organic produce, and veganism is a growing trend among young people. Notably, 45.0% of Generation Z respondents (compared with just 26.0% of their global counterparts) say they are trying to reduce their overall meat consumption (Euromonitor International, 2021).
Denmark was Canada's 13th largest agri-food, fish and seafood market in Europe and 45th largest in the world, with total exports valued at US$75.0 million in 2021. Canadian organic packaged food exporters have preferential access to the Danish market under the Canada - European Union Comprehensive Economic and Trade Agreement (CETA). In addition, the European Union - Canada Organic Equivalence Agreement (EUCOEA) allows for Canadian products to be exported as organic products to Denmark, as long as such organic products are certified under the Canadian Food Inspection Agency (CFIA) Canada Organic Regime. For more information, please, visit: export requirements and documentation under the EUCOEA and list of the CFIA accredited certification body in Canada.
| Country | 2016 | 2021 | CAGR* % 2016-2021 | 2022 | 2026 | CAGR* % 2021-2026 |
|---|---|---|---|---|---|---|
| World | 34,933.6 | 50,815.4 | 7.8 | 54,475.1 | 70,304.2 | 6.7 |
| United States | 15,285.4 | 21,260.5 | 6.8 | 22,850.2 | 29,021.4 | 6.4 |
| Germany | 3,838.7 | 5,176.7 | 6.2 | 5,412.3 | 6,322.0 | 4.1 |
| China | 2,550.0 | 4,732.5 | 13.2 | 5,234.5 | 7,525.1 | 9.7 |
| France | 2,652.3 | 4,707.6 | 12.2 | 5,136.3 | 7,015.9 | 8.3 |
| Italy | 1,222.0 | 1,761.1 | 7.6 | 1,880.5 | 2,414.0 | 6.5 |
| United Kingdom | 1,392.1 | 1,749.2 | 4.7 | 1,810.7 | 2,124.1 | 4.0 |
| Canada | 867.5 | 1,237.7 | 7.4 | 1,360.7 | 1,857.9 | 8.5 |
| Netherlands | 760.4 | 1,100.3 | 7.7 | 1,159.7 | 1,501.7 | 6.4 |
| Denmark | 699.7 | 1,063.7 | 8.7 | 1,106.4 | 1,320.5 | 4.4 |
| Sweden | 673.3 | 905.0 | 6.1 | 943.8 | 1,168.0 | 5.2 |
|
Source: Euromonitor International, 2022 *CAGR: Compound annual growth rate Historic data: 2016-2021 Forecast data: 2022-2026 |
||||||
Consumer Characteristics
Health and wellness packaged food retail sales increased at a CAGR of 6.6% from 2016 to 2021 and is expected to show a slower growth during the forecast period (2021-2026), at a CAGR of 4.0%. Two health and wellness packaged food categories that better performed were 'free from" and organic categories. Especially, 'free from' category saw a strong increase in retail value sales at a CAGR of 17.3% between 2016 and 2021 and is expected to see more moderate growth at a CAGR of 8.8% during the forecast period. Organic packaged food sales increased by a CAGR of 10.4% during the 2016-2021 period and are expected to increase by a CAGR of 4.5% during the forecast period.
Before the Covid-19 pandemic, 80% of Danish consumer regularly purchased organic products, with over half buying organic food stuffs every week (USDA, 2020). And most Danes value the Danish organic label more than the EU organic logo (USDA 2020). According to Euromonitor International (2022), the pandemic has strengthened consumers' need to pursue a healthier lifestyle and this trend could continue at pace in the coming years. Through self-education, many Danes research what to eat and they willing to spend additional amounts of money to protect their health. However, a growing focus on carbon neutral products may hinder the future development of organic packaged food. Organic accreditation is no longer seen by many as the highest standard for sustainability, with consumers instead seeking out low carbon footprint products (Euromonitor International, 2022).
| Category | 2016 | 2021 | CAGR* % 2016-2021 | 2022 | 2026 | CAGR* % 2021-2026 |
|---|---|---|---|---|---|---|
| Health and Wellness Packaged Food Total | 2,411.5 | 3,322.9 | 6.6 | 3,430.7 | 4,041.7 | 4.0 |
| Better For You | 506.4 | 625.1 | 4.3 | 641.0 | 728.1 | 3.1 |
| Fortified/ Functional | 246.3 | 297.4 | 3.8 | 298.1 | 340.3 | 2.7 |
| Free From | 106.1 | 235.8 | 17.3 | 257.3 | 359.6 | 8.8 |
| Naturally Healthy | 904.9 | 1,100.9 | 4.0 | 1,127.5 | 1,286.8 | 3.2 |
| Organic | 647.8 | 1,063.7 | 10.4 | 1,106.9 | 1,326.9 | 4.5 |
|
Source: Euromonitor International, 2016 *CAGR: Compound Annual Growth Rate Historical data: 2016-2021 Forecast data: 2022-2026 |
||||||
Market size
The organic packaged food market in Denmark was valued at US$1.1 billion in 2021. During the 2016-2021 period, this market gradually grew at a CAGR of 10.4%. However, the double-digit current value growth seen in 2020 was not continued into 2021, which saw current value sales stagnate. This was partly linked to stockpiling in 2020, with consumers using up old stocks in 2021. This in particular impacted store cupboard ingredients such as organic rice, pasta and noodles, organic sweet biscuits and organic milk formula (Euromonitor International, 2022).
The top three organic packaged food categories, in terms of retail value sales, were organic dairy products, accounting for 47.0% of Denmark total organic packaged food market, with total retail sales of US$500.1 million in 2021, organic rice, pasta and noodles (7.4%, US$78.4 million) and organic bread (6.2%, US$65.8 million). Between 2016 and 2021, the top three fastest growing organic packaged food categories were organic ice cream, which expanded by a CAGR of 33.3% with total retail sales valued at US$31.1 million in 2021, organic bread (CAGR 19.5%, US$65.8 million) and organic rice, pasta and noodles (CAGR 14.4%, US$78.4million).
With respect to the share of organic packaged food for its corresponding packaged food category, organic baby food, organic rice, pasta and noodles, organic edible oil, organic soup, and organic breakfast cereals
accounted for a significantly higher share compared to other organic packaged food categories. For example, organic baby food represented 50.0% of the total baby food sales in Denmark in 2021, whereas other organic categories accounted for less than 6.0% of their corresponding packaged food category, except for organic dairy, organic shelf stable meat, seafood, fruit and vegetables, organic sweet biscuits, organic snack bars and fruit snacks, organic ice cream, and organic savoury snacks in 2021.
During the forecast period, Denmark organic packaged food market is expected to grow at a CAGR of 4.5% and to be valued at US$1.3 billion by 2026. Organic ice cream is expected to see the fastest growth at a CAGR of 7.3%, reaching total retail sales of US$44.2 million by 2026. Organic confectionery is also forecast to show relatively higher growth than other organic packaged food categories, at a CAGR of 7.2%, reaching total retail value sales of US$45.2 million by 2026.
| Category | 2016 | 2017 | 2018 | 2019 | 2020 | 2021 |
|---|---|---|---|---|---|---|
| Organic Packaged Food | 647.8 | 752.5 | 885.1 | 878.1 | 1,009.4 | 1,063.7 |
| Organic Baby Food | 23.7 | 39.5 | 41.1 | 38.5 | 39.5 | 43.3 |
| Organic Bread | 27.0 | 33.7 | 46.4 | 50.3 | 59.2 | 65.8 |
| Organic Breakfast Cereals | 32.4 | 36.0 | 40.0 | 39.6 | 44.6 | 48.6 |
| Organic Chilled Processed Meat and Seafood | 24.0 | 26.2 | 29.5 | 29.8 | 31.8 | 34.8 |
| Organic Confectionery | 18.9 | 20.3 | 24.9 | 25.1 | 29.8 | 31.9 |
| Organic Dairy | 322.1 | 369.9 | 428.7 | 418.9 | 489.3 | 500.1 |
| Organic Edible Oil | 23.4 | 24.8 | 32.0 | 28.4 | 30.8 | 32.9 |
| Organic Frozen Meat, Seafood, Fruit and Vegetables | 19.1 | 20.5 | 22.6 | 22.5 | 24.0 | 26.3 |
| Organic Ice Cream | 7.4 | 9.1 | 24.1 | 24.1 | 28.1 | 31.1 |
| Organic Ready Meals | 6.2 | 6.9 | 7.7 | 7.9 | 8.5 | 9.5 |
| Organic Rice, Pasta and Noodles | 40.1 | 46.0 | 53.4 | 57.5 | 74.0 | 78.4 |
| Organic Sauces, Dressings and Condiments | 14.8 | 18.5 | 21.5 | 22.0 | 25.0 | 27.8 |
| Organic Savoury Snacks | 23.5 | 26.2 | 28.7 | 29.0 | 33.5 | 35.5 |
| Organic Shelf Stable Meat, Seafood, Fruit and Vegetables | 22.7 | 24.7 | 27.2 | 26.7 | 28.3 | 30.7 |
| Organic Soup | 11.5 | 12.2 | 13.3 | 13.0 | 14.0 | 14.9 |
| Organic Spreads | 12.1 | 14.3 | 17.9 | 19.0 | 20.6 | 21.8 |
| Organic Sweet Biscuits, Snack Bars and Fruit Snacks | 18.9 | 23.7 | 26.1 | 26.0 | 28.5 | 30.4 |
| Source: Euromonitor International, 2022 | ||||||
| Category | Annual growth (%) 2020-2021 | CAGR* % 2016-2021 | Total growth (%) 2016-2021 |
|---|---|---|---|
| Organic Packaged Food | 5.4 | 10.4 | 64.2 |
| Organic Baby Food | 9.6 | 12.8 | 82.7 |
| Organic Bread | 11.2 | 19.5 | 143.7 |
| Organic Breakfast Cereals | 9.0 | 8.5 | 50.0 |
| Organic Chilled Processed Meat and Seafood | 9.4 | 7.7 | 45.0 |
| Organic Confectionery | 7.1 | 11.0 | 68.8 |
| Organic Dairy | 2.2 | 9.2 | 55.3 |
| Organic Edible Oil | 6.8 | 7.1 | 40.6 |
| Organic Frozen Meat, Seafood, Fruit and Vegetables | 9.6 | 6.6 | 37.7 |
| Organic Ice Cream | 10.7 | 33.3 | 320.3 |
| Organic Ready Meals | 11.8 | 8.9 | 53.2 |
| Organic Rice, Pasta and Noodles | 6.0 | 14.4 | 95.5 |
| Organic Sauces, Dressings and Condiments | 11.2 | 13.4 | 87.8 |
| Organic Savoury Snacks | 6.0 | 8.6 | 51.1 |
| Organic Shelf Stable Meat, Seafood, Fruit and Vegetables | 8.5 | 6.2 | 35.2 |
| Organic Soup | 6.4 | 5.3 | 29.6 |
| Organic Spreads | 5.8 | 12.5 | 80.2 |
| Organic Sweet Biscuits, Snack Bars and Fruit Snacks | 6.7 | 10.0 | 60.9 |
|
Source: Euromonitor International, 2022 *CAGR: Compound annual growth rate |
|||
| Category | Total packaged food | Organic packaged food | Share of organic packaged food (%) |
|---|---|---|---|
| Baby Food | 86.6 | 43.3 | 50.0 |
| Bread | 1,142.5 | 65.8 | 5.8 |
| Breakfast Cereals | 223.1 | 48.6 | 21.8 |
| Chilled Processed Meat and Seafood | 1,019.5 | 34.8 | 3.4 |
| Confectionery | 1798.4 | 31.9 | 1.8 |
| Dairy | 3006.9 | 500.1 | 16.6 |
| Edible Oil | 104.4 | 32.9 | 31.5 |
| Frozen Meat, Seafood, Fruit and Vegetables | 442.9 | 26.3 | 5.9 |
| Ice Cream | 459.2 | 31.1 | 6.8 |
| Ready Meals | 471.1 | 9.5 | 2.0 |
| Rice, Pasta and Noodles | 240.7 | 78.4 | 32.6 |
| Sauces, Dressings and Condiments | 493.2 | 27.8 | 5.6 |
| Savoury Snacks | 577.4 | 35.5 | 6.1 |
| Shelf Stable Meat, Seafood, Fruit and Vegetables | 327.4 | 30.7 | 9.4 |
| Soup | 67.6 | 14.9 | 22.0 |
| Sweet Biscuits, Snack Bars and Fruit Snacks | 397.6 | 30.4 | 7.6 |
| Source: Euromonitor International, 2022 | |||
| Category | 2022 | 2023 | 2024 | 2025 | 2026 |
|---|---|---|---|---|---|
| Organic Packaged Food | 1,106.9 | 1,153.9 | 1,208.9 | 1,270.6 | 1,326.9 |
| Organic Baby Food | 44.9 | 46.2 | 48.3 | 50.5 | 52.7 |
| Organic Bread | 68.3 | 70.5 | 73.8 | 77.2 | 80.5 |
| Organic Breakfast Cereals | 51.1 | 53.5 | 55.9 | 58.8 | 61.4 |
| Organic Chilled Processed Meat and Seafood | 36.3 | 37.9 | 39.4 | 41.3 | 43.0 |
| Organic Confectionery | 32.9 | 35.3 | 38.1 | 41.6 | 45.2 |
| Organic Dairy | 519.1 | 540.6 | 564.8 | 591.5 | 615.2 |
| Organic Edible Oil | 34.6 | 35.8 | 37.5 | 39.3 | 40.9 |
| Organic Frozen Meat, Seafood, Fruit and Vegetables | 27.6 | 28.9 | 31.2 | 33.4 | 35.6 |
| Organic Ice Cream | 32.9 | 35.4 | 38.2 | 41.4 | 44.2 |
| Organic Ready Meals | 10.1 | 10.7 | 11.4 | 12.2 | 13.0 |
| Organic Rice, Pasta and Noodles | 81.7 | 85.3 | 90.0 | 95.2 | 99.5 |
| Organic Sauces, Dressings and Condiments | 30.1 | 31.9 | 33.3 | 35.2 | 37.0 |
| Organic Savoury Snacks | 36.2 | 37.7 | 39.4 | 41.4 | 43.4 |
| Organic Shelf Stable Meat, Seafood, Fruit and Vegetables | 31.8 | 32.8 | 33.7 | 34.8 | 36.0 |
| Organic Soup | 15.3 | 15.6 | 16.1 | 16.6 | 17.1 |
| Organic Spreads | 22.3 | 22.8 | 23.5 | 24.2 | 24.9 |
| Organic Sweet Biscuits, Snack Bars and Fruit Snacks | 31.6 | 32.8 | 34.3 | 35.9 | 37.4 |
| Source: Euromonitor International, 2022 | |||||
| Category | Annual growth (%) 2021-2022 | CAGR* % 2021-2026 | Total growth (%) 2021-2026 |
|---|---|---|---|
| Organic Packaged Food | 4.1 | 4.5 | 24.7 |
| Organic Baby Food | 3.7 | 4.0 | 21.7 |
| Organic Bread | 3.8 | 4.1 | 22.3 |
| Organic Breakfast Cereals | 5.1 | 4.8 | 26.3 |
| Organic Chilled Processed Meat and Seafood | 4.3 | 4.3 | 23.6 |
| Organic Confectionery | 3.1 | 7.2 | 41.7 |
| Organic Dairy | 3.8 | 4.2 | 23.0 |
| Organic Edible Oil | 5.2 | 4.4 | 24.3 |
| Organic Frozen Meat, Seafood, Fruit and Vegetables | 4.9 | 6.2 | 35.4 |
| Organic Ice Cream | 5.8 | 7.3 | 42.1 |
| Organic Ready Meals | 6.3 | 6.5 | 36.8 |
| Organic Rice, Pasta and Noodles | 4.2 | 4.9 | 26.9 |
| Organic Sauces, Dressings and Condiments | 8.3 | 5.9 | 33.1 |
| Organic Savoury Snacks | 2.0 | 4.1 | 22.3 |
| Organic Shelf Stable Meat, Seafood, Fruit and Vegetables | 3.6 | 3.2 | 17.3 |
| Organic Soup | 2.7 | 2.8 | 14.8 |
| Organic Spreads | 2.3 | 2.7 | 14.2 |
| Organic Sweet Biscuits, Snack Bars and Fruit Snacks | 3.9 | 4.2 | 23.0 |
|
Source: Euromonitor International, 2022 *CAGR: Compound annual growth rate |
|||
Competition
In 2021, the top three organic packaged food companies accounted for 39.5% of total market share. Arla Foods Amba continues to be the largest company, in terms of retails value sales, followed by Thise Mejeri Amba, and Midsona AB. Private labels continued to show strong presence in the market, with total market share of 25.0% in 2021.
Private label is a strong competitor in the Danish organic packaged food market, with a widening range and affordable pricing resulting in strong share gains in recent years. Private label now has a presence and has a double-digit value share in many organic packaged food areas, being able to reach into areas where branded players are more hesitant to invest (Euromonitor International, 2022). Private label notably dominates organic frozen meat, seafood, fruit, and vegetables; organic rice; organic nuts, seeds, and trail mixes; and organic savoury snacks. Furthermore, many private label organic products are positioned as sustainable, which appeals to Danes (Euromonitor International, 2022).
| Company | Retail sales (US$ millions) | Market share (%) |
|---|---|---|
| Arla Foods Amba | 203.7 | 19.2 |
| Thise Mejeri Amba | 152.2 | 14.3 |
| Midsona AB | 64.5 | 6.1 |
| Lantmännen ek för | 52.3 | 4.9 |
| De Økologiske Mejerier | 33.1 | 3.1 |
| Orkla Group | 28.3 | 2.7 |
| Hanegal A/S | 26.1 | 2.5 |
| Hipp GmbH & Co Vertrieb KG | 17.2 | 1.6 |
| Scandic Food A/S | 17.0 | 1.6 |
| Koff A/S | 7.7 | 0.7 |
| Private Label | 196.2 | 18.4 |
| Others | 265.4 | 25.0 |
| Total | 1,063.7 | 100.0 |
| Source: Euromonitor International, 2022 | ||
Distribution
Store-based retail channels continue to be the main outlets for organic grocery sales, especially led by supermarkets and discounters. During the 2016-2021 period, sales by e-commerce grew at a CAGR of 22.3%. E-commerce significantly benefited from the Covid-19 pandemic as an increased number of Danish consumer began to shop online in order to avoid physical contact. E-commerce was also seen by many as more convenient when working from home (Euromonitor International, 2022).
| Outlet Type | 2016 | 2021 | ||
|---|---|---|---|---|
| Actual | Share | Actual | Share | |
| Store-Based Retailing | 638.7 | 98.6 | 1,038.8 | 97.7 |
| Grocery Retailers | 634.5 | 97.9 | 1,034.3 | 97.2 |
| Modern Grocery Retailers | 623.5 | 96.2 | 1,019.0 | 95.8 |
| Convenience Stores | 11.7 | 1.8 | 20.7 | 1.9 |
| Discounters | 198.5 | 30.6 | 328.2 | 30.9 |
| Forecourt Retailers | 9.1 | 1.4 | 13.8 | 1.3 |
| Hypermarkets | 182.7 | 28.2 | 302.8 | 28.5 |
| Supermarkets | 221.5 | 34.2 | 353.5 | 33.2 |
| Traditional Grocery Retailers | 11.0 | 1.7 | 15.3 | 1.4 |
| Independent Small Grocers | 8.4 | 1.3 | 11.1 | 1.0 |
| Other Grocery Retailers | 2.6 | 0.4 | 4.2 | 0.4 |
| Non-Grocery Specialists | 4.2 | 0.6 | 4.4 | 0.4 |
| Non-Store Retailing | 9.1 | 1.4 | 24.9 | 2.3 |
| E-Commerce | 9.1 | 1.4 | 24.9 | 2.3 |
| Total | 647.8 | 100.0 | 1,063.7 | 100.0 |
|
Source: Euromonitor International, 2022 Note: Actuals for some of sub-outlet types are unavailable. As such, the total of certain sub-categories may not equal to the total of their super-category. |
||||
Subsector Analysis
Organic Baby Food
The organic baby food market in Denmark expanded by a CAGR of 12.8% during the 2016-2021 period, recording total retail sales of US$43.3 million in 2021. By absolute value terms, prepared baby food was the largest sub-category, accounting for 81.3% of the total organic baby food retail sales (US$35.2 million) in 2021. Organic prepared baby food also saw the highest growth at a CAGR of 14.0% between 2016 and 2021. Organic baby food is set to grow at a CAGR of 4.0% during the forecast period, with total retail sales of US$52.7 million by 2026.
With respect to competition, Hipp GmbH & Co Vertrieb KG maintained its leadership in organic baby food throughout 2016 and 2021. In 2021, Hipp GmbH & Co Vertrieb KG accounted for 39.7% of the total organic baby food market in Denmark. Other major players were Hero Group GmbH with a market share of 16.9% and Arla Foods Amba with a market share of 16.6% in 2021.
According to Euromonitor International (2021), the trend for organic baby food products is expected to remain strong, although organic baby food has reached a level of saturation in Denmark, with brand Semper being one of the last major players which offers non-organic baby food in the country.
| Category | 2016 | 2017 | 2018 | 2019 | 2020 | 2021 |
|---|---|---|---|---|---|---|
| Organic Baby Food Total | 23.7 | 39.5 | 41.1 | 38.5 | 39.5 | 43.3 |
| Milk Formula | 1.6 | 1.7 | 1.8 | 1.7 | 1.8 | 1.9 |
| Dried Baby Food | 3.0 | 4.4 | 4.8 | 4.6 | 4.8 | 5.3 |
| Prepared Baby Food | 18.3 | 32.5 | 33.5 | 31.3 | 32.1 | 35.2 |
| Other Baby Food | 0.8 | 0.9 | 0.9 | 0.9 | 0.9 | 1.0 |
| Source: Euromonitor International, 2022 | ||||||
| Category | Annual growth (%) 2020-2021 | CAGR* % 2016-2021 | Total growth (%) 2016-2021 |
|---|---|---|---|
| Organic Baby Food Total | 9.6 | 12.8 | 82.7 |
| Milk Formula | 5.6 | 3.5 | 18.8 |
| Dried Baby Food | 10.4 | 12.1 | 76.7 |
| Prepared Baby Food | 9.7 | 14.0 | 92.3 |
| Other Baby Food | 11.1 | 4.6 | 25.0 |
|
Source: Euromonitor International, 2022 *CAGR: Compound annual growth rate |
|||
| Company | Retail sales (US$ millions) | Market share (%) |
|---|---|---|
| Hipp GmbH & Co Vertrieb KG | 17.2 | 39.7 |
| Hero Group GmbH | 7.3 | 16.9 |
| Arla Foods Amba | 7.2 | 16.6 |
| Hain Celestial Group Inc, The | 3.4 | 7.9 |
| Nestlé SA | 1.9 | 4.4 |
| Private Label | 3.5 | 8.1 |
| Others | 2.8 | 6.5 |
| Source: Euromonitor International, 2022 | ||
| Category | 2022 | 2023 | 2024 | 2025 | 2026 |
|---|---|---|---|---|---|
| Organic Baby Food Total | 44.9 | 46.2 | 48.3 | 50.5 | 52.7 |
| Milk Formula | 1.8 | 1.9 | 1.9 | 2.0 | 2.0 |
| Dried Baby Food | 5.5 | 5.7 | 5.9 | 6.2 | 6.4 |
| Prepared Baby Food | 36.6 | 37.6 | 39.3 | 41.1 | 42.9 |
| Other Baby Food | 1.0 | 1.1 | 1.2 | 1.2 | 1.3 |
| Source: Euromonitor International, 2022 | |||||
| Category | Annual growth (%) 2021-2022 | CAGR* % 2021-2026 | Total growth (%) 2021-2026 |
|---|---|---|---|
| Organic Baby Food Total | 4.0 | 4.0 | 21.7 |
| Milk Formula | 1.0 | 1.0 | 5.3 |
| Dried Baby Food | 3.8 | 3.8 | 20.8 |
| Prepared Baby Food | 4.0 | 4.0 | 21.9 |
| Other Baby Food | 5.4 | 5.4 | 30.0 |
|
Source: Euromonitor International, 2022 *CAGR: Compound annual growth rate |
|||
Organic bread and breakfast cereals
Denmark organic bread market is concentrated, the top-3 organic bread companies accounted for 65.4% of the total organic bread sales in 2021. From 2016 to 2021, this market increased at a CAGR of 19.5%, with total retail sales of US$65.8million in 2021. It is expected to see slower growth during the forecast period, at a CAGR of 4.1%, with total retail sales of US$80.5 million by 2026.
The retail value sales of the organic breakfast cereals increased by a CAGR of 8.4% during the 2016 to 2021 period, with total retail sales of US$48.6 million in 2021. This market is forecast grow between 2021 and 2026, at a CAGR of 4.8% and to be valued at US$61.4 million by 2026. Lantmännen ek för and Midsona AB were the two leading companies, accounting for 62.6% and 15.2% of the total retail value sales in 2021, respectively.
| Category | 2016 | 2017 | 2018 | 2019 | 2020 | 2021 |
|---|---|---|---|---|---|---|
| Organic Bread | 27.0 | 33.7 | 46.4 | 50.3 | 59.2 | 65.8 |
| Organic Breakfast Cereals | 32.4 | 36.0 | 40.0 | 39.6 | 44.6 | 48.6 |
| Source: Euromonitor International, 2022 | ||||||
| Category | Annual growth (%) 2020-2021 | CAGR* % 2016-2021 | Total growth (%) 2016-2021 |
|---|---|---|---|
| Organic Bread | 11.1 | 19.5 | 143.7 |
| Organic Breakfast Cereals | 9.0 | 8.4 | 50.0 |
|
Source: Euromonitor International, 2022 *CAGR: Compound annual growth rate |
|||
| Company | Retail sales (US$ million) | Market share (%) |
|---|---|---|
| Lantmännen ek för | 21.1 | 32.1 |
| Midsona AB | 14.2 | 21.6 |
| Koff A/S | 7.7 | 11.7 |
| Paulig Ab | 0.7 | 1.1 |
| Private Label | 1.8 | 2.7 |
| Others | 20.3 | 30.9 |
| Total | 65.8 | 100.0 |
| Source: Euromonitor International, 2022 | ||
| Company | Retail sales (US$ million) | Market share (%) |
|---|---|---|
| Lantmännen ek för | 30.4 | 62.6 |
| Midsona AB | 7.4 | 15.2 |
| PepsiCo Inc | 1.2 | 2.5 |
| Private Label | 7.6 | 15.6 |
| Others | 1.9 | 3.9 |
| Total | 48.6 | 100.0 |
| Source: Euromonitor International, 2022 | ||
| Category | 2022 | 2023 | 2024 | 2025 | 2026 |
|---|---|---|---|---|---|
| Organic Bread | 68.3 | 70.5 | 73.8 | 77.2 | 80.5 |
| Organic Breakfast Cereals | 51.1 | 53.5 | 55.9 | 58.8 | 61.4 |
| Source: Euromonitor International, 2022 | |||||
| Category | Annual growth (%) 2021-2022 | CAGR* % 2021-2026 | Total growth (%) 2021-2026 |
|---|---|---|---|
| Organic Bread | 3.8 | 4.1 | 22.3 |
| Organic Breakfast Cereals | 5.1 | 4.8 | 26.3 |
|
Source: Euromonitor International, 2022 *CAGR: Compound annual growth rate |
|||
Organic cooking ingredients and meals
Denmark organic edible oil market grew at a CAGR of 5.8% during the 2016-2021 period, with total retail sales of US$104.4 million in 2021. The market is expected to expand by a CAGR of 2.7% from 2021 to 2026, reaching total retail sales of US$119.2 million by 2026. Scandic Food A/S led the sales of Denmark organic edible oil, with a market share of 8.6%, followed by Monini SpA with a market share of 6.0% and Midsona AB with a market share of 5.9% in 2021.
The organic ready meals saw continued growth at a CAGR of 5.5% during the 2016 to 2021 period with total retail sales of US$471.1 million in 2021. This market is expected to expand at a CAGR of 4.6% between 2021 and 2026, reaching total retail sales of US$589.8 million by 2026. Danish Crown Amba is the leading organic ready meal company in Denmark, accounting for 12.3% of the organic ready meal sales in 2021. Private labels continued to play strong and represented 29.3% of this market in 2021.
The organic sauce, dressing and condiment market grew at a CAGR of 4.4% during the 2016 to 2021 period, with total retail sales valued at US$493.2 million in 2021. This sector is expected to grow at a CAGR of 2.7% during the forecast period and to be valued at US$562.2 million by 2026. Orkla Group, Paulig A, and Unilever Group were the three leading companies, representing 14.6%, 12.1%, and 10.8% of this market, respectively, in 2021.
The retail value sales of the organic soup category increased by a CAGR of 5.5% between 2016 and 2021, with total retail sales of US$67.6 million in 2021. The organic soup market is expected to see a slower growth at a CAGR of 4.0% from 2021 to 2026, reaching total retail sales of US$82.4 million by 2026. Danish Crown Amba accounted for 26.5% of the retail value sales, followed by Unilever Group, accounting for 23.2% in 2021.
The organic spreads increased at a CAGR of 4.4% from 2016 to 2021, with total retail sales valued at US$138.4 million in 2021. This market is expected to see slower growth at a CAGR of 1.5% during the forecast period and to be valued at US$149.2 million by 2026. Ferrero & related parties was the leading spread company in Denmark with a market share of 19.3%, followed by Orkla Group with a market share of 13.6% in 2021. Private labels represented 23.9% of the total organic spread sales.
According to Euromonitor (2021), sustained growth of organic cooking ingredients and meals was supported by changes in consumer behavior, such as cooking more at home and looking for convenient meal options, which were adopted during the pandemic due to lockdown restrictions. Even with a return to the workplace, Danes' have continued to adopt home cooking with this demonstrating a longer lasting trend.
| Category | 2016 | 2017 | 2018 | 2019 | 2020 | 2021 |
|---|---|---|---|---|---|---|
| Cooking Ingredients and Meals | 998.6 | 1,055.8 | 1,137.3 | 1,103.6 | 1,173.0 | 1,274.8 |
| Edible Oils | 78.6 | 83.8 | 91.1 | 88.7 | 96.0 | 104.4 |
| Ready Meals | 360.0 | 388.1 | 422.0 | 413.4 | 430.8 | 471.1 |
| Sauces, Dressings and Condiments | 396.9 | 412.3 | 440.6 | 424.5 | 456.6 | 493.2 |
| Soup | 51.8 | 54.7 | 59.2 | 57.8 | 62.0 | 67.6 |
| Sweet Spreads | 111.4 | 116.9 | 124.5 | 119.2 | 127.6 | 138.4 |
| Source: Euromonitor International, 2022 | ||||||
| Category | Annual Growth (%)2020-2021 | CAGR* % 2016-2021 | Total growth (%) 2016-2021 |
|---|---|---|---|
| Cooking Ingredients and Meals | 8.7 | 5.0 | 27.7 |
| Edible Oils | 8.8 | 5.8 | 32.8 |
| Ready Meals | 9.4 | 5.5 | 30.9 |
| Sauces, Dressings and Condiments | 8.0 | 4.4 | 24.3 |
| Soup | 9.0 | 5.5 | 30.5 |
| Sweet Spreads | 8.5 | 4.4 | 24.2 |
|
Source: Euromonitor International, 2022 *CAGR: Compound annual growth rate |
|||
| Company name | 2021 | Market share (%) |
|---|---|---|
| Scandic Food A/S | 9.0 | 8.6 |
| Monini SpA | 6.3 | 6.0 |
| Midsona AB | 6.2 | 5.9 |
| Santagata Luigi Srl | 6.1 | 5.8 |
| Lehnsgaard Rapsolie A/S | 4.1 | 3.9 |
| Private Label | 39.3 | 37.6 |
| Others | 33.4 | 32.0 |
| Total | 104.4 | 100.0 |
| Source: Euromonitor International, 2022 | ||
| Company name | 2021 | Market share (%) |
|---|---|---|
| Danish Crown Amba | 57.8 | 12.3 |
| Oetker-Gruppe | 45.3 | 9.6 |
| Aarstiderne A/S | 44.0 | 9.3 |
| Unilever Group | 39.7 | 8.4 |
| Jensen's Bøfhus A/S | 24.0 | 5.1 |
| Private Label | 137.9 | 29.3 |
| Others | 122.4 | 26.0 |
| Total | 471.1 | 100.0 |
| Source: Euromonitor International, 2022 | ||
| Company name | 2021 | Market share (%) |
|---|---|---|
| Orkla Group | 72.1 | 14.6 |
| Paulig Ab | 59.5 | 12.1 |
| Unilever Group | 53.2 | 10.8 |
| Kraft Heinz Co | 35.1 | 7.1 |
| Graasten Salater A/S | 17.2 |
3.5 |
| Private Label | 128 | 26.0 |
| Others | 256.1 | 51.9 |
| Total | 493.2 | 100.0 |
| Source: Euromonitor International, 2022 | ||
| Company name | 2021 | Market share (%) |
|---|---|---|
| Danish Crown Amba | 17.9 | 26.5 |
| Unilever Group | 15.7 | 23.2 |
| Arla Foods Amba | 11.8 | 17.5 |
| Ardo NV | 3.7 | 5.5 |
| Kokken og Køkkenhaven A/S | 2.8 | 4.1 |
| Private Label | 8.1 | 12.0 |
| Others | 7.6 | 11.2 |
| Total | 67.6 | 100.0 |
| Source: Euromonitor International, 2022 | ||
| Company name | 2021 | Market share (%) |
|---|---|---|
| Ferrero & related parties | 26.7 | 19.3 |
| Orkla Group | 18.8 | 13.6 |
| Scandic Food A/S | 17.2 | 12.4 |
| Jakobsen & Hvam A/S | 11.9 | 8.6 |
| Fynbo Foods A/S | 4.9 | 3.5 |
| Private Label | 33.1 | 23.9 |
| Others | 25.8 | 18.6 |
| Total | 138.4 | 100.0 |
| Source: Euromonitor International, 2022 | ||
| Category | 2022 | 2023 | 2024 | 2025 | 2026 |
|---|---|---|---|---|---|
| Cooking Ingredients and Meals | 1,293.8 | 1,343.3 | 1,396.2 | 1,450.8 | 1,502.8 |
| Edible Oils | 104.3 | 107.8 | 111.7 | 115.5 | 119.2 |
| Ready Meals | 492.9 | 515.6 | 540.2 | 566.2 | 589.8 |
| Sauces, Dressings and Condiments | 491.4 | 508.9 | 526.4 | 544.4 | 562.2 |
| Soup | 68.4 | 71.4 | 75.1 | 78.7 | 82.4 |
| Sweet Spreads | 136.7 | 139.6 | 142.8 | 146.0 | 149.2 |
| Source: Euromonitor International, 2022 | |||||
| Category | Annual growth (%) 2021-2022 | CAGR* % 2021-2026 | Total growth (%) 2021-2026 |
|---|---|---|---|
| Cooking Ingredients and Meals | 1.5 | 3.3 | 17.9 |
| Edible Oils | −0.1 | 2.7 | 14.2 |
| Ready Meals | 4.6 | 4.6 | 25.2 |
| Sauces, Dressings and Condiments | −0.4 | 2.7 | 14.0 |
| Soup | 1.2 | 4.0 | 21.9 |
| Sweet Spreads | −1.2 | 1.5 | 7.8 |
|
Source: Euromonitor International, 2022 *CAGR: Compound annual growth rate |
|||
Organic rice and pasta
During the 2016 to 2021 period, Denmark organic rice and pasta market increased at a CAGR of 14.3% and was valued at US$78.4 million in 2021. The market is forecast to grow at a CAGR of 4.9%, reaching total retail sales of US$99.5 million by 2026.
In 2021, the retail value sales of Denmark organic rice and past sector are led by Orkla Group with a market share of 27.6%, Midsona AB with a market share of 5.0% and Il Fornaio A/S with a market share of 2.2%. Private labels accounted for 25.8% of this market.
| Category | 2016 | 2017 | 2018 | 2019 | 2020 | 2021 |
|---|---|---|---|---|---|---|
| Organic Rice and Pasta Total | 40.1 | 46.0 | 53.4 | 57.5 | 74.0 | 78.4 |
| Rice | 13.9 | 16.8 | 18.6 | 21.8 | 28.9 | 30.6 |
| Pasta | 26.3 | 29.2 | 34.7 | 35.8 | 45.1 | 47.7 |
| Source: Euromonitor International, 2022 | ||||||
| Category | Annual growth (%) 2020-2021 | CAGR* % 2016-2021 | Total growth (%) 2016-2021 |
|---|---|---|---|
| Organic Rice and Pasta Total | 5.9 | 14.3 | 95.5 |
| Organic Rice | 5.9 | 17.1 | 120.1 |
| Organic Pasta | 5.8 | 12.6 | 81.4 |
|
Source: Euromonitor International, 2022 *CAGR: Compound annual growth rate |
|||
| Company name | 2021 | Market share (%) |
|---|---|---|
| Orkla Group | 21.6 | 27.6 |
| Midsona AB | 3.9 | 5.0 |
| Il Fornaio A/S | 1.7 | 2.2 |
| Private Label | 20.2 | 25.8 |
| Others | 31.0 | 39.5 |
| Total | 78.4 | 100.0 |
| Source: Euromonitor International, 2022 | ||
| Category | 2022 | 2023 | 2024 | 2025 | 2026 |
|---|---|---|---|---|---|
| Organic Rice and Pasta Total | 81.7 | 85.3 | 90.0 | 95.2 | 99.5 |
| Organic Rice | 32.0 | 33.3 | 34.6 | 36.1 | 37.2 |
| Organic Pasta | 49.7 | 52.0 | 55.4 | 59.1 | 62.2 |
| Source: Euromonitor International, 2022 | |||||
| Annual growth (%) 2021-2022 | CAGR* % 2021-2026 | Total growth (%) 2021-2026 | |
|---|---|---|---|
| Organic Rice and Pasta Total | 4.2 | 4.9 | 26.9 |
| Organic Rice | 4.6 | 4.0 | 21.6 |
| Organic Pasta | 4.2 | 5.5 | 30.4 |
|
Source: Euromonitor International, 2022 *CAGR: Compound annual growth rate |
|||
Organic snacks
The Denmark organic confectionery market grew at a CAGR of 11.0% during the 2016-2021 period, with total retail sales of US$31.9 million in 2021. This market is expected to expand by a CAGR of 7.2% from 2021 to 2026 and to be valued at US$45.2 million by 2026. Ritter GmbH & Co KG, Alfred is the leading organic confectionery company in Denmark, accounting for 5.3% of the organic confectionery sales in 2021. Private labels continued to play strong and represented 43.9% of this market in 2021.
The organic ice cream sector saw fast growth at a CAGR of 33.3% during the 2016-2021 period, with total retail sale of US$31.1 million in 2021. This market is expected to expand at a CAGR of 7.3% between 2021 and 2026, reaching total retail sales of US$44.2 million by 2026. Food Union Group is the leading organic ice cream company with a market share of 13.5% in 2021, followed by Hansens Flødeis Aps with a market share of 13.2%. Private labels continue to play strong, accounting for 36.0% of the total organic ice cream market in 2021.
The organic savoury snack market expanded by a CAGR of 8.6% during the 2016-2021 period, with total retail sales valued at US$35.5 million in 2021. This market is expected to grow at a CAGR of 4.1% during the forecast period, with total retail sales of US$43.4 million by 2026. Midsona AB is the leading organic savoury snack company in Denmark, accounting for 27.9% of the organic savoury snack sales in 2021. Private labels continued to play strong and represented 58.3% of this market in 2021.
The organic sweet snack category saw growth at a CAGR of 10.0% during the 2016-2021 period, with total retail sales of US$30.4 million in 2021. The retail sales of this market is expected to increase by a CAGR of 4.2% between 2021 and 2026, reaching total retail sales of US$37.4 million by 2026. Midsona AB is the leading organic sweet snack company in Denmark, accounting for 31.3% of the organic savoury snack sales in 2021. Private labels continued to play strong and represented 34.9% of this market in 2021.
| Category | 2016 | 2017 | 2018 | 2019 | 2020 | 2021 |
|---|---|---|---|---|---|---|
| Organic Confectionery | 18.9 | 20.3 | 24.9 | 25.1 | 29.8 | 31.9 |
| Organic Ice Cream | 7.4 | 9.1 | 24.1 | 24.1 | 28.1 | 31.1 |
| Organic Savoury Snacks | 23.5 | 26.2 | 28.7 | 29.0 | 33.5 | 35.5 |
| Organic Sweet Biscuits, Snack Bars and Fruit Snacks | 18.9 | 23.7 | 26.1 | 26.0 | 28.5 | 30.4 |
| Cereal Bars | 0.8 | 1.2 | 1.2 | 1.4 | 1.5 | |
| Fruit Snacks | 18.1 | 22.1 | 24.0 | 23.9 | 26.1 | 27.8 |
| Sweet Biscuits | 0.8 | 0.8 | 0.9 | 0.9 | 1.0 | 1.0 |
| Source: Euromonitor International, 2022 | ||||||
| Category | Annual growth (%) 2020-2021 | CAGR* % 2016-2021 | Total growth (%) 2016-2021 |
|---|---|---|---|
| Organic Confectionery | 7.0 | 11.0 | 68.8 |
| Organic Ice Cream | 10.7 | 33.3 | 320.3 |
| Organic Savoury Snacks | 6.0 | 8.6 | 51.1 |
| Organic Sweet Biscuits, Snack Bars and Fruit Snacks | 6.7 | 10.0 | 60.8 |
| Cereal Bars | 7.1 | N/C[1] | N/C[1] |
| Fruit Snacks | 6.5 | 9.0 | 53.6 |
| Sweet Biscuits | 0.0 | 4.6 | 25.0 |
|
Source: Euromonitor International, 2022 *CAGR: Compound annual growth rate 1: Not calculable |
|||
| Company | Retail sales (US$ millions) | Market share (%) |
|---|---|---|
| Ritter GmbH & Co KG, Alfred | 1.7 | 5.3 |
| Organic Seed & Bean Co Ltd | 0.9 | 2.8 |
| Private Label | 14.0 | 43.9 |
| Others | 15.2 | 47.6 |
| Total | 31.9 | 100.0 |
| Source: Euromonitor International, 2022 | ||
| Company | Retail sales (US$ millions) | Market share (%) |
|---|---|---|
| Food Union Group | 4.2 | 13.5 |
| Hansens Flødeis Aps | 4.1 | 13.2 |
| Vebbestrup Flødeis | 3.3 | 10.6 |
| Private Label | 11.2 | 36.0 |
| Others | 8.2 | 26.4 |
| Total | 31.1 | 100.0 |
| Source: Euromonitor International, 2022 | ||
| Company | Retail sales (US$ millions) | Market share (%) |
|---|---|---|
| Midsona AB | 9.9 | 27.9 |
| Max Krone Aps | 1.0 | 2.8 |
| Scandza AS | 1.0 | 2.8 |
| System Frugt A/S | 0.8 | 2.3 |
| Lantmännen ek för | 0.7 | 2.0 |
| Private Label | 20.7 | 58.3 |
| Others | 22.1 | 62.3 |
| Total | 35.5 | 100.0 |
| Source: Euromonitor International, 2022 | ||
| Company | Retail sales (US$ millions) | Market share (%) |
|---|---|---|
| Midsona AB | 9.5 | 31.3 |
| System Frugt A/S | 1.7 | 5.6 |
| Naturproducts BV | 0.1 | 0.3 |
| Private Label | 10.6 | 34.9 |
| Others | 8.6 | 28.3 |
| Total | 30.4 | 100.0 |
| Source: Euromonitor International, 2022 | ||
| Category | 2022 | 2023 | 2024 | 2025 | 2026 |
|---|---|---|---|---|---|
| Organic Confectionery | 32.9 | 35.3 | 38.1 | 41.6 | 45.2 |
| Organic Ice Cream | 32.9 | 35.4 | 38.2 | 41.4 | 44.2 |
| Organic Savoury Snacks | 36.2 | 37.7 | 39.4 | 41.4 | 43.4 |
| Organic Sweet Biscuits, Snack Bars and Fruit Snacks | 31.6 | 32.8 | 34.3 | 35.9 | 37.4 |
| Cereal Bars | 1.7 | 1.8 | 1.9 | 2.0 | 2.1 |
| Fruit Snacks | 28.9 | 30.0 | 31.3 | 32.7 | 34.1 |
| Sweet Biscuits | 1.1 | 1.1 | 1.1 | 1.2 | 1.2 |
| Source: Euromonitor International, 2022 | |||||
| Category | Annual growth (%) 2021-2022 | CAGR* % 2021-2026 | Total growth (%) 2021-2026 |
|---|---|---|---|
| Organic Confectionery | 3.1 | 7.2 | 41.7 |
| Organic Ice Cream | 5.8 | 7.3 | 42.1 |
| Organic Savoury Snacks | 2.0 | 4.1 | 22.3 |
| Organic Sweet Biscuits, Snack Bars and Fruit Snacks | 3.9 | 4.2 | 23.0 |
| Cereal Bars | 13.3 | 7.0 | 40.0 |
| Fruit Snacks | 4.0 | 4.2 | 22.7 |
| Sweet Biscuits | 10.0 | 3.7 | 20.0 |
|
Source: Euromonitor International, 2022 *CAGR: Compound annual growth rate |
|||
New product launch analysis
From 2017 to 2021, 3,104 organic packaged food products were introduced in Denmark, with the highest number of new products launched in 2017. In 2021, the top three categories of food products offered were sauces and seasonings, snacks, and bakery. Top brands were Coop Änglamark, Urtekram Always Organic, Øgo, Levevis, and Salling Øko.
| Product attributes | Yearly launch counts | ||||
|---|---|---|---|---|---|
| 2017 | 2018 | 2019 | 2020 | 2021 | |
| Yearly product launches | 747 | 616 | 578 | 637 | 526 |
| Top five categories | |||||
| Sauces and seasonings | 89 | 99 | 53 | 77 | 69 |
| Snacks | 100 | 97 | 75 | 78 | 33 |
| Bakery | 99 | 60 | 74 | 77 | 62 |
| Dairy | 90 | 59 | 71 | 76 | 60 |
| Processed fish, meat and egg products | 87 | 47 | 47 | 51 | 38 |
| Imported status | |||||
| Imported | 155 | 137 | 107 | 92 | 56 |
| Not imported | 84 | 85 | 69 | 86 | 70 |
| Top five brands | |||||
| Coop Änglamark | 28 | 41 | 23 | 48 | 35 |
| Urtekram Always Organic | 50 | 18 | 25 | 33 | 26 |
| Øgo | 30 | 24 | 18 | 12 | 15 |
| Levevis | 54 | 24 | 10 | 7 | 1 |
| Salling Øko | 0 | 0 | 0 | 34 | 25 |
| Top launch types | |||||
| New Product | 370 | 280 | 218 | 230 | 214 |
| New Variety/Range Extension | 251 | 240 | 297 | 296 | 189 |
| New Packaging | 78 | 72 | 50 | 72 | 98 |
| Relaunch | 40 | 24 | 11 | 39 | 25 |
| New Formulation | 8 | 0 | 2 | 0 | 0 |
| Top five flavours (including blend) | |||||
| Unflavoured/Plain | 364 | 247 | 206 | 266 | 183 |
| Vanilla/Vanilla Bourbon/Vanilla Madagascar | 3 | 6 | 9 | 14 | 14 |
| Cocoa/Cacao | 7 | 10 | 6 | 6 | 9 |
| Strawberry | 7 | 7 | 8 | 7 | 3 |
| Raspberry | 6 | 1 | 11 | 5 | 5 |
| Top five ingredients | |||||
| Waters | 134 | 114 | 160 | 212 | 194 |
| Salt | 154 | 121 | 145 | 170 | 194 |
| Cane Sugar | 103 | 101 | 118 | 120 | 122 |
| Sea Salt | 111 | 77 | 90 | 84 | 88 |
| Food Acids | 85 | 57 | 85 | 84 | 82 |
| Top five price groups (US dollars) | |||||
| 0.15 - 4.14 | 458 | 317 | 315 | 335 | 199 |
| 4.15 - 8.14 | 210 | 205 | 172 | 196 | 207 |
| 8.15 - 12.14 | 51 | 63 | 45 | 59 | 50 |
| 12.15 - 16.14 | 16 | 15 | 24 | 25 | 24 |
| 16.15 - 23.00 | 6 | 7 | 14 | 11 | 32 |
| Source: Mintel GNPD, 2022 | |||||
Examples of new products
Organic Plant Based Frikadellen

Source: Mintel GNPD, 2022
| Company | Nemlig.com |
|---|---|
| Manufacturer | Plante Kompagniet |
| Brand | Smag WH Wassim Hallal |
| Category | Processed fish, meat and egg products |
| Store name | nemlig.com |
| Store type | Internet / mail order |
| Date published | May 2022 |
| Launch type | New product |
| Price in local currency | DKK32.00 |
| Price in US dollars | 4.54 |
Smag WH Wassim Hallal Økologiske Plantedeller (Organic Plant Based Frikadellen) are suitable for vegans and made with penny bun mushrooms with a strong umami flavour, and chopped and roasted hazelnuts, and ginger. The locally produced product is microwavable, and retails in a 180 gram pack of four units and bearing the EU Organic and Statskontrolleret Økologisk (State Controlled Organic) logos and cooking instructions.
Maple Syrup
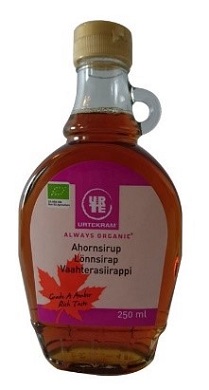
Source: Mintel GNPD, 2022
| Company | Urtekram |
|---|---|
| Manufacturer | Urtekram |
| Brand | Urtekram Always Organic |
| Category | Sweet spreads |
| Store name | SuperBrugsen |
| Store type | Supermarket |
| Date published | April 2017 |
| Launch type | New product |
| Price in local currency | DKK50.95 |
| Price in US dollars | 7.40 |
Urtekram Always Organic Ahornsirup (Maple Syrup) is a 100% organic real maple syrup from Canadian forests which can be used in desserts, on porridge or as a sweetener in hot drinks. This product retails in a 250 millilitre pack, featuring the EU Green Leaf logo.
Hemp Seed Oil
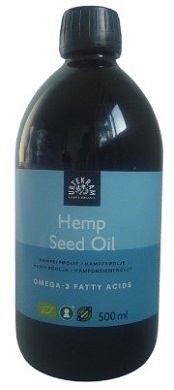
Source: Mintel GNPD, 2022
| Company | Midsona |
|---|---|
| Manufacturer | Midsona |
| Brand | Urtekram |
| Category | Sauces and seasonings |
| Store name | helsam.dk |
| Store type | Internet / mail order |
| Date published | October 2021 |
| Launch type | Relaunch |
| Price in local currency | DKK115.95 |
| Price in US dollars | 18.07 |
Urtekram Hampefrøolie (Hemp Seed Oil) has been relaunched under a new brand name, previously known as Urtekram, and with an updated packaging. The organic and cold-pressed product has a high content of omega 3 fatty acids, and retails in a new 500 millilitre pack featuring the EU Organic, Debio and Green Keyhole logos.
Organic Cold Pressed Rapeseed Oil
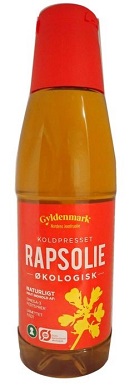
Source: Mintel GNPD, 2022
| Company | PureOil |
|---|---|
| Manufacturer | PureOil |
| Brand | Gyldenmark |
| Category | Sauces and seasonings |
| Store name | SuperBrugsen |
| Store type | Supermarket |
| Date published | March 2022 |
| Launch type | New variety / range extension |
| Price in local currency | DKK36.95 |
| Price in US dollars | 5.42 |
Gyldenmark Økologisk Koldpresset Rapsolie (Organic Cold Pressed Rapeseed Oil) is produced by gently cleaning organic rapeseed and pressing it at a low temperature, after which the oil is filtered. This simple process is carried out completely without use of chemicals, and is said to preserve the oil's naturally high content of unsaturated fats and omega-3 fatty acids, as well as vitamins. The product is often called the Nordic virgin oil, has a characteristic and slightly nutty taste, and can be used for all cooking. It retails in a 500 millilitre pack bearing the Statskontrolleret Økologisk (State Controlled Organic), Green Keyhole and EU Organic logos.
Organic Wild Blueberry
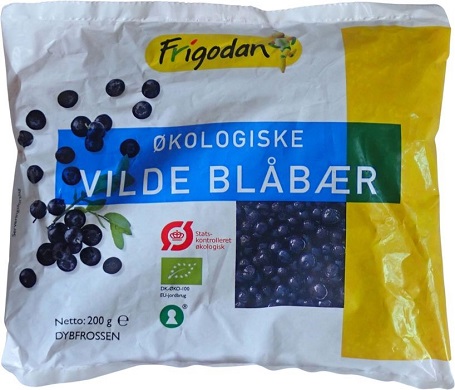
Source: Mintel GNPD, 2022
| Company | Ardo |
|---|---|
| Manufacturer | Ardo |
| Brand | Frigodan |
| Category | Fruit and vegetables |
| Store name | nemlig.com |
| Store type | Internet / mail order |
| Date published | May 2022 |
| Launch type | New variety / range extension |
| Price in local currency | DKK13.68 |
| Price in US dollars | 1.94 |
Frigodan Økologiske Vilde Blåbær (Organic Wild Blueberry) is now available. The product retails in a 200 gram pack bearing the Statskontrolleret Økologisk (State Controlled Organic), EU Organic and Green Keyhole logos.
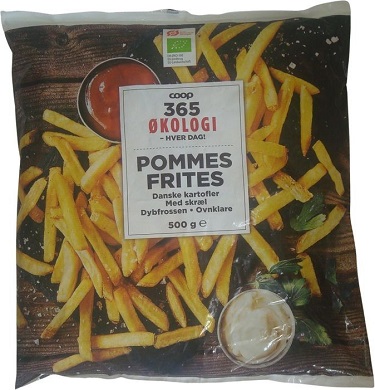
Organic French Fries with Peel
Source: Mintel GNPD, 2022
| Company | Coop Trading |
|---|---|
| Manufacturer | Flensted Food Group |
| Brand | Coop 365 Økologi |
| Category | Side dishes |
| Store name | Coop 365 |
| Store type | Supermarket |
| Date published | June 2022 |
| Launch type | New variety / range extension |
| Price in local currency | DKK14.15 |
| Price in US dollars | 2.01 |
Coop 365 Økologiske Pommes Frites med Skræl (Organic French Fries with Peel) are made with organic Danish potatoes with the peel. The oven-ready product contains oil from the pre-cooking and does not need extra oil to become crispy, can be prepared in oven or in deep fryer, and retails in a 500 gram pack made with 28% less plastic, featuring the EU Organic and Statskontrolleret Økologisk (State Controlled Organic) logos and cooking instructions.
Organic Durum Wheat Linguine

Source: Mintel GNPD, 2022
| Company | Alb-Gold Teigwaren |
|---|---|
| Manufacturer | Alb-Gold Teigwaren |
| Brand | Alb-Gold |
| Category | Side dishes |
| Location of manufacture | Germany |
| Import status | Imported product |
| Store name | Føtex |
| Store type | Supermarket |
| Date published | November 2021 |
| Launch type | New product |
| Price in local currency | DKK32.50 |
| Price in US dollars | 5.05 |
Alb-Gold Økologisk Premium Pasta (Organic Durum Wheat Linguine) is now available. The vegan and kosher certified product cooks in seven minutes and retails in a 500 gram recyclable paper pack bearing the EU Organic, FSC Mix and FSC logos.
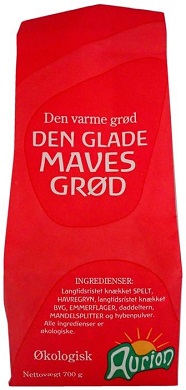
Happy Stomach Porridge
Source: Mintel GNPD, 2022
| Company | Aurion |
|---|---|
| Manufacturer | Aurion |
| Brand | Aurion |
| Category | Breakfast cereals |
| Store name | Helsam |
| Store type | Natural / health food store |
| Date published | November 2021 |
| Launch type | New variety / range extension |
| Price in local currency | DKK52.95 |
| Price in US dollars | 8.23 |
Aurion Den Glade Maves Grød (Happy Stomach Porridge) is an organic porridge mix that is said to give the feeling of fullness for a long time. It has a low fat content and is made without additives, added sugar or salt. The grains from biodynamic farming are slow-roasted and crushed and the flakes are steamed, rolled and roasted. This process is said to give it a nutty flavour and improve the structure of the porridge. The heat treatment is said to open up the flavours as well as scent when roasted and cooked. The porridge can be cooked in five minutes and can be sweetened with syrup, dried fruits during or after cooking, or served as a dessert with whipped cream and fresh fruit. The sustainable product retails in a 700 gram pack bearing the EU Organic, Statskontrolleret Økologisk (State Controlled Organic), FSC Mix and Vælg Fuldkorn Først (Choose Wholegrain First) logos.
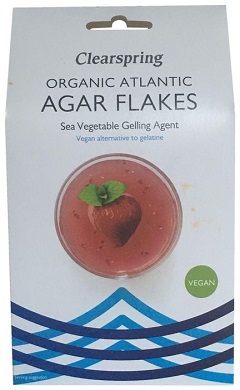
Organic Atlantic Agar Flakes
Source: Mintel GNPD, 2022
| Company | Clearspring |
|---|---|
| Manufacturer | Clearspring |
| Brand | Clearspring |
| Category | Bakery |
| Store name | Føtex |
| Store type | Supermarket |
| Date published | June 2021 |
| Launch type | New product |
| Price in local currency | DKK69.95 |
| Price in US dollars | 11.16 |
Clearspring Geleringsmiddel (Organic Atlantic Agar Flakes) are described as a high quality, vegan-friendly alternative to gelatine, and can be used for making desserts, jellies and aspics. The organic sea vegetable gelling agent from the Atlantic is free from chemicals and bleaching agents, and retails in a 30 gram pack bearing usage instructions and the CRAEGA, Vegan Society Approved Vegan Trademark, EU Organic and Organic Soil Association logos. The outer carton is recyclable and the inner bag is compostable.
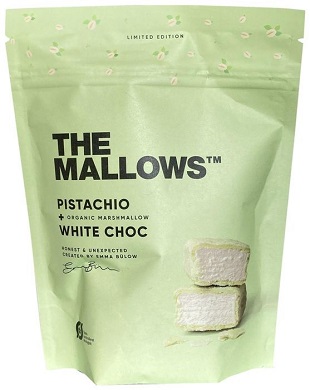
Pistachio + Organic Marshmallow with White Chocolate
Source: Mintel GNPD, 2022
| Company | The Mallows |
|---|---|
| Manufacturer | The Mallows |
| Brand | The Mallows |
| Category | Chocolate confectionery |
| Store name | Magasin |
| Store type | Department store |
| Date published | February 2022 |
| Launch type | New variety / range extension |
| Price in local currency | DKK60.00 |
| Price in US dollars | 9.23 |
The Mallows Chokoladeovertrukket Skumfiduser med Pistacie (Pistachio + Organic Marshmallow with White Chocolate) is now available in a limited edition. The crafted marshmallows are covered with white chocolate and sweet pistachio, created by Emma Bülow and said to have a distinctly chewy texture filled with caramel. The gourmet product retails in a 90 gram pack featuring the Statskontrolleret Økologisk (State Controlled) and EU Organic logos.
For more information
The Canadian Trade Commissioner Service:
International Trade Commissioners can provide Canadian industry with on-the-ground expertise regarding market potential, current conditions and local business contacts, and are an excellent point of contact for export advice.
More agri-food market intelligence:
International agri-food market intelligence
Discover global agriculture and food opportunities, the complete library of Global Analysis reports, market trends and forecasts, and information on Canada's free trade agreements.
Agri-food market intelligence service
Canadian agri-food and seafood businesses can take advantage of a customized service of reports and analysis, and join our email subscription service to have the latest reports delivered directly to their inbox.
More on Canada's agriculture and agri-food sectors:
Canada's agriculture sectors
Information on the agriculture industry by sector. Data on international markets. Initiatives to support awareness of the industry in Canada. How the department engages with the industry.
Resources
- The Word Bank,2022
- OECD (June 2022), Denmark Economic Snapshot
- Canadian Food Inspection Agency, United Kingdom - Canada Organic Equivalency Arrangement (UKCOEA) overview
- Euromonitor International (September 2021), Baby Food in Denmark
- Euromonitor International (October 2021), Megatrend in Denmark
- Euromonitor International (December 2021), Cooking Ingredients and Meals in Denmark
- Euromonitor International (January 2022), Health and Wellness in Denmark
- Euromonitor International (February 2022), Economy, Finance and Trade: Denmark
- Euromonitor International (June 2022), Households: Denmark
- Mintel, New Product Database (accessed on September 2022)
- USDA (January, 2020) The Organic Food Market in Denmark
Health and Wellness Series – Organic packaged food trends in Denmark
Global Analysis Report
Prepared by: Zhiduo Wang, Market Analyst
© His Majesty the King in Right of Canada, represented by the Minister of Agriculture and Agri-Food (2022).
Photo credits
All photographs reproduced in this publication are used by permission of the rights holders.
All images, unless otherwise noted, are copyright His Majesty the King in Right of Canada.
To join our distribution list or to suggest additional report topics or markets, please contact:
Agriculture and Agri-Food Canada, Global Analysis1341 Baseline Rd, Tower 5, 3rd floor
Ottawa ON K1A 0C5
Canada
Email: aafc.mas-sam.aac@agr.gc.ca
The Government of Canada has prepared this report based on primary and secondary sources of information. Although every effort has been made to ensure that the information is accurate, Agriculture and Agri-Food Canada (AAFC) assumes no liability for any actions taken based on the information contained herein.
Reproduction or redistribution of this document, in whole or in part, must include acknowledgement of agriculture and agri-food Canada as the owner of the copyright in the document, through a reference citing AAFC, the title of the document and the year. Where the reproduction or redistribution includes data from this document, it must also include an acknowledgement of the specific data source(s), as noted in this document.
Agriculture and Agri-Food Canada provides this document and other report services to agriculture and food industry clients free of charge.