

Note: This report includes forecasting data that is based on baseline historical data.
Executive summary
The German market for organic packaged food is the largest in Europe and second largest in the world, behind the United States. In 2021, the organic packaged food retail value sales in Germany accounted for one tenth of the total global organic packaged food retail sales.
German consumers increasingly value environmental claims and animal welfare. Although these are fueling the demand for organic products, including organic dairy, they are also driving some consumers away from the dairy market and towards other alternatives.
The total retail sales of organic packaged food was valued at US$5.2 billion in 2021. The largest category was dairy with US$1.3 billion in retail sales. Other organic packaged food categories with significant retail sales were bread, chilled and processed meat and seafood, as well as baby food.
The organic packaged food market in Germany is mature and well developed. However, it is also expected to experience slower growth than some other markets, such as China and France during the forecast period (2021-2026). Retail sales of the organic packaged food in Germany are forecast to grow at a compound annual growth rate (CAGR) of 4.1% between 2021 and 2026, faster than regular packaged food, but slower than that expected of global organic packaged food at a CAGR of 6.6%.
Overall the German organic packaged food market is relatively fragmented with a diverse array of suppliers, aside from the organic baby food category, which has sales mostly held by one company.
Market overview
In 2021, Germany was the largest European market for organic packaged food and the second largest market in the world, behind the United States. Retail sales of organic packaged food in Germany for 2021 totalled $US 5.2 billion, accounting for 10.2% of the total global organic packaged food sales. The total retail value sales of organic packaged food in Germany grew at a CAGR of 6.2% from 2016 to 2021, whereas overall packaged food retail sales grew at a CAGR of 2.9%. German organic packaged food saw a notable spike in sales, which increased by 14.6% in 2020 from 2019.
The growth of the German packaged food market is expected to slow to a CAGR of 4.1% between 2021 and 2026, but still faster than the growth of the total packaged food market, which is expected to grow at a CAGR of 2.1%. The total retail sales of the organic packaged food are expected to reach US$6.3 billion by 2026, by which time the German market will have slipped to the second largest in Europe, behind France and fourth largest in the world, behind the United States, China, and France.
The German economy grew at a CAGR of 2.2% from 2017 to 2021, suffering a contraction in 2020 and rebounding in 2021, as total exports rose by 17.0%. However, the German economy remains below its real pre-pandemic levels. The German economy is advanced, with strong productivity and the second largest trade surplus of any country in the world in 2021, behind China. In 2021, Germany's trade surplus totalled US$233.7 billion, down from US$274.0 billion in 2017 (Euromonitor, 2022).
Considerable uncertainty for the German economy exists and inflation has been rising faster than projected. There is ongoing concern that Germany may lose access to gas supplies from the Russian Federation, as a consequence of the ongoing conflict in Ukraine. Russia has previously stated that it would terminate all gas supplies to Germany if Germany does not start making payments in rubles, a move which would likely spark a recession in Germany. Germany faces concerns with rising prices, much like the rest of the world (Euro News, 2022).
| Country | 2016 | 2021 | CAGR % 2016-2021 | 2022 | 2026 | CAGR % 2021-2026 |
|---|---|---|---|---|---|---|
| World | 34,933.6 | 50,815.4 | 7.8 | 54,475.1 | 70,304.2 | 6.7 |
| United States | 15,285.4 | 21,260.5 | 6.8 | 22,850.2 | 29,021.4 | 6.4 |
| Germany | 3,838.7 | 5,176.7 | 6.2 | 5,412.3 | 6,322.0 | 4.1 |
| China | 2,550.0 | 4,732.5 | 13.2 | 5,234.5 | 7,525.1 | 9.7 |
| France | 2,652.3 | 4,707.6 | 12.2 | 5,136.3 | 7,015.9 | 8.3 |
| Italy | 1,222.0 | 1,761.1 | 7.6 | 1,880.5 | 2,414.0 | 6.5 |
| United Kingdom | 1,392.1 | 1,749.2 | 4.7 | 1,810.7 | 2,124.1 | 4.0 |
| Canada | 867.5 | 1,237.7 | 7.4 | 1,360.7 | 1,857.9 | 8.5 |
| Netherlands | 760.4 | 1,100.3 | 7.7 | 1,159.7 | 1,501.7 | 6.4 |
| Denmark | 699.7 | 1,063.7 | 8.7 | 1,106.4 | 1,320.5 | 4.4 |
| Sweden | 673.3 | 905.0 | 6.1 | 943.8 | 1,168.0 | 5.2 |
|
Source: Euromonitor International, 2022 *CAGR: Compound annual growth rate Historical data: 2016-2021 Forecast data: 2022-2026 |
||||||
Consumer characteristics
Many German consumers have a high degree of concern for issues such as sustainability and animal welfare. The pandemic has caused many consumers to revaluate their lifestyle choices and to increase their focus on individual health. German consumers are especially interested in products that they believe can boost immune function or improve the appearance of their skin. Products that aid in caring for wounds, the digestive system and managing weight have all seen sales gains over the course of the pandemic. Herbal remedies have also become more popular, due to a perception as being more natural. Finally, German consumers have also been spending increasing amounts of time cooking at home over the course of the pandemic (Euromonitor, 2022).
Germany has a relatively low fertility rate compared with the rest of Western Europe, with a rate of 1.5 births per woman in 2021. The median age of the population was set to rise and the dependency ratio is expected to rise from 55.6% in 2021 to 70.6% in 2040. Meanwhile, the share of the population, which is obese, is also rising, expected to climb from 27.8% in 2021 to 29.3% by 2026 (Euromonitor, 2022).
Organic packaged food is popular among German consumers due to being perceived as better than non-organic alternatives for the planet, individual and for animal welfare. A desire for animal welfare is a strong factor behind the sales of organic milk, as well as a desire for environmental sustainability and more natural ingredients. Staple food saw a spike in growth due to the pandemic; however growth is expected to slow as German consumption habits start to pivot away from cooking at home (Euromonitor, 2022).
Health and wellness packaged food grew at a CAGR of 4.7% and growth is forecast to slow slightly to 3.3% from 2021 to 2026. The 'free from' category, a category of products being free from an ingredient such as gluten, saw the fastest growth at a CAGR of 13.0% from 2016 to 2021. 'Free from' is forecast to continue rapid growth, growing at a CAGR of 10.0% from 2021 to 2026. Organic packaged food was the largest category of health and wellness and saw the second fastest growth between 2016 and 2021. Retail sales of organic packaged products are expected to grow at a CAGR of 4.1% from 2021 to 2026.
| Category | 2016 | 2021 | CAGR % 2016-2021 | 2022 | 2026 | CAGR % 2021-2026 |
|---|---|---|---|---|---|---|
| Health and wellness packaged Food Total | 15,416.5 | 19,396.0 | 4.7 | 20,012.0 | 23,542.2 | 3.3 |
| Better For You | 3,773.3 | 4,123.6 | 1.8 | 4,161.3 | 4,457.1 | 1.6 |
| Fortified / Functional | 2,682.4 | 2,842.0 | 1.2 | 2,819.8 | 3,009.2 | 1.1 |
| Free From | 1,239.3 | 2,278.4 | 13.0 | 2,506.7 | 3,677.0 | 10.0 |
| Naturally Healthy | 3,882.8 | 4,975.3 | 5.1 | 5,111.9 | 6,076.9 | 4.1 |
| Organic | 3,838.7 | 5,176.7 | 6.2 | 5,412.3 | 6,322.0 | 4.1 |
|
Source: Euromonitor International, 2016 *CAGR: Compound annual growth rate Historical data: 2016-2021 Forecast data: 2022-2026 |
||||||
Market size
In 2021, the total retail sales of organic packaged food in Germany were equal to US$5.2 billion, which corresponds to 4.7% of the total packaged food sales. The largest category was organic dairy, with US$1.3 billion in sales, or 25.5% of total organic packaged food sales. Bread was next with US$1.0 billion in sales, or 19.0% of total sales. Organic chilled processed meat and seafood was the third largest category, with US$0.8 billion in sales, or 15.2% of total organic packaged food sales. Organic baby food was the fourth largest category, with US$ 0.5 billion in sales, or 9.0% of total organic packaged food sales. In 2021, 42.2% of total baby food sales were organic, the largest percentage of any of the categories. The category which saw the fastest growth from 2016-2021 was organic edible oils, which saw growth at a CAGR of 12.4%.
From 2021 to 2026, organic packaged food are expected to grow at a CAGR of 4.1%, rising from US$5.2 billion in 2021 to US$6.3 billion in 2026. From 2021 to 2026 organic sauces, dressings and condiments are expected to see the fastest growth, rising at a CAGR of 12.2%, up from US$63.6 million in 2021 to US$112.9 million in 2026. Organic edible oil is expected to register the second fastest growth at a CAGR of 9.7%, rising from US$138.2 million to 219.2 million in 2026. Organic dairy is expected to register the greatest rise in absolute terms, with total sales rising by US$211.0 million from 2022-2026, followed by organic chilled processed meat at US$131.5 million, organic bread at US$106.9 million, and edible oils at US$67.3 million.
| Category | 2016 | 2017 | 2018 | 2019 | 2020 | 2021 |
|---|---|---|---|---|---|---|
| Organic Packaged Food Total | 3,838.7 | 4,029.2 | 4,094.8 | 4,193.3 | 4,805.9 | 5,176.7 |
| Baby Food | 451.2 | 447.9 | 440.5 | 439.3 | 449.3 | 463.6 |
| Bread | 813.6 | 832.7 | 807.4 | 787.3 | 900.4 | 985.3 |
| Breakfast Cereals | 61.9 | 64.6 | 66.2 | 68.6 | 79.8 | 86.1 |
| Chilled Processed Meat and Seafood | 528.4 | 551.7 | 563.0 | 572.7 | 725.9 | 788.4 |
| Confectionery | 314.8 | 329.4 | 341.0 | 351.1 | 368.0 | 384.1 |
| Dairy | 903.6 | 1,011.0 | 1,062.5 | 1,121.9 | 1,248.1 | 1,319.4 |
| Edible Oil | 77.0 | 81.8 | 86.8 | 94.5 | 115.8 | 138.2 |
| Frozen Meat, Seafood, Fruit and Vegetables | 149.9 | 154.6 | 156.9 | 160.4 | 209.3 | 225.1 |
| Ice Cream | 22.3 | 22.9 | 23.7 | 24.6 | 26.0 | 26.8 |
| Ready Meals | 56.7 | 58.5 | 60.7 | 63.6 | 74.4 | 85.7 |
| Rice, Pasta and Noodles | 30.0 | 30.8 | 31.5 | 33.1 | 37.7 | 41.3 |
| Sauces, Dressings and Condiments | 38.7 | 39.8 | 41.1 | 43.0 | 55.6 | 63.6 |
| Savoury Snacks | 27.8 | 29.9 | 32.0 | 34.3 | 38.6 | 40.5 |
| Shelf Stable Meat, Seafood, Fruit and Vegetables | 177.8 | 183.2 | 184.5 | 190.9 | 236.7 | 253.5 |
| Soup | 5.5 | 5.6 | 5.8 | 6.0 | 7.5 | 8.4 |
| Spreads | 147.7 | 150.8 | 154.9 | 164.2 | 193.2 | 224.5 |
| Sweet Biscuits, Snack Bars and Fruit Snacks | 31.9 | 34.1 | 36.0 | 37.8 | 39.7 | 41.9 |
| Source: Euromonitor International, 2022 | ||||||
| Category | Annual growth % 2020-2021 | CAGR* % 2016-2021 | Total growth % 2016-2021 |
|---|---|---|---|
| Organic Packaged Food Total | 7.7 | 6.2 | 34.9 |
| Baby Food | 3.2 | 0.5 | 2.7 |
| Bread | 9.4 | 3.9 | 21.1 |
| Breakfast Cereals | 7.9 | 6.8 | 39.1 |
| Chilled Processed Meat and Seafood | 8.6 | 8.3 | 49.2 |
| Confectionery | 4.4 | 4.1 | 22.0 |
| Dairy | 5.7 | 7.9 | 46.0 |
| Edible Oil | 19.3 | 12.4 | 79.5 |
| Frozen Meat, Seafood, Fruit and Vegetables | 7.5 | 8.5 | 50.2 |
| Ice Cream | 3.1 | 3.7 | 20.2 |
| Ready Meals | 15.2 | 8.6 | 51.1 |
| Rice, Pasta and Noodles | 9.5 | 6.6 | 37.7 |
| Sauces, Dressings and Condiments | 14.4 | 10.4 | 64.3 |
| Savoury Snacks | 4.9 | 7.8 | 45.7 |
| Shelf Stable Meat, Seafood, Fruit and Vegetables | 7.1 | 7.4 | 42.6 |
| Soup | 12.0 | 8.8 | 52.7 |
| Spreads | 16.2 | 8.7 | 52.0 |
| Sweet Biscuits, Snack Bars and Fruit Snacks | 5.5 | 5.6 | 31.3 |
|
Source: Euromonitor International, 2022 *CAGR: Compound annual growth rate |
|||
| Category | Total packaged food | Organic packaged food | Share of organic packaged food |
|---|---|---|---|
| Baby Food | 1,098.1 | 463.6 | 42.2 |
| Bread | 12,153.6 | 985.3 | 8.1 |
| Breakfast Cereals | 972.9 | 86.1 | 8.8 |
| Chilled Processed Meat and Seafood | 11,903.9 | 788.4 | 6.6 |
| Confectionery | 13,322.1 | 384.1 | 2.9 |
| Dairy | 25,342.7 | 1,319.4 | 5.2 |
| Edible Oil | 1,260.6 | 138.2 | 11.0 |
| Frozen Meat, Seafood, Fruit and Vegetables | 4,046.5 | 225.1 | 5.6 |
| Ice Cream | 3,404.0 | 26.8 | 0.8 |
| Ready Meals | 6,557.8 | 85.7 | 1.3 |
| Rice, Pasta and Noodles | 2,207.3 | 41.3 | 1.9 |
| Sauces, Dressings and Condiments | 5,754.7 | 63.6 | 1.1 |
| Savoury Snacks | 5,237.3 | 40.5 | 0.8 |
| Shelf Stable Meat, Seafood, Fruit and Vegetables | 4,119.4 | 253.5 | 6.2 |
| Soup | 602.4 | 8.4 | 1.4 |
| Spreads | 2,177.7 | 224.5 | 10.3 |
| Sweet Biscuits, Snack Bars and Fruit Snacks | 2,636.8 | 41.9 | 1.6 |
| Source: Euromonitor International, 2022 | |||
| Category | 2022 | 2023 | 2024 | 2025 | 2026 |
|---|---|---|---|---|---|
| Organic Packaged Food Total | 5,412.3 | 5,683.3 | 5,899.3 | 6,115.1 | 6,322.0 |
| Baby Food | 478.6 | 493.8 | 507.4 | 519.6 | 531.2 |
| Bread | 1,034.6 | 1,071.9 | 1,095.7 | 1,118.9 | 1,141.5 |
| Breakfast Cereals | 91.1 | 94.0 | 97.0 | 99.8 | 102.4 |
| Chilled Processed Meat and Seafood | 831.2 | 866.4 | 903.1 | 932.6 | 962.7 |
| Confectionery | 400.1 | 416.2 | 432.1 | 447.3 | 462.6 |
| Dairy | 1,351.2 | 1,404.8 | 1,454.7 | 1,507.8 | 1,562.2 |
| Edible Oil | 151.9 | 178.9 | 190.1 | 206.2 | 219.2 |
| Frozen Meat, Seafood, Fruit and Vegetables | 237.2 | 249.5 | 260.7 | 269.4 | 278.0 |
| Ice Cream | 27.3 | 28.3 | 29.3 | 30.3 | 31.2 |
| Ready Meals | 90.7 | 98.0 | 104.4 | 112.9 | 123.1 |
| Rice, Pasta and Noodles | 43.6 | 45.6 | 47.5 | 49.3 | 51.0 |
| Sauces, Dressings and Condiments | 71.3 | 80.2 | 89.3 | 100.8 | 112.9 |
| Savoury Snacks | 39.6 | 41.7 | 43.7 | 45.7 | 47.7 |
| Shelf Stable Meat, Seafood, Fruit and Vegetables | 273.0 | 290.3 | 305.7 | 318.9 | 329.5 |
| Soup | 8.6 | 9.5 | 10.0 | 10.8 | 11.7 |
| Spreads | 239.8 | 269.7 | 282.8 | 297.2 | 305.8 |
| Sweet Biscuits, Snack Bars and Fruit Snacks | 42.7 | 44.4 | 46.0 | 47.6 | 49.2 |
| Source: Euromonitor International, 2022 | |||||
| Category | Annual growth % 2021-2022 | CAGR* % 2021-2026 | Total growth % 2021-2026 |
|---|---|---|---|
| Organic Packaged Food Total | 4.6 | 4.1 | 22.1 |
| Baby Food | 3.2 | 2.8 | 14.6 |
| Bread | 5.0 | 3.0 | 15.9 |
| Breakfast Cereals | 5.8 | 3.5 | 18.9 |
| Chilled Processed Meat and Seafood | 5.4 | 4.1 | 22.1 |
| Confectionery | 4.2 | 3.8 | 20.4 |
| Dairy | 2.4 | 3.4 | 18.4 |
| Edible Oil | 9.9 | 9.7 | 58.6 |
| Frozen Meat, Seafood, Fruit and Vegetables | 5.4 | 4.3 | 23.55 |
| Ice Cream | 1.9 | 3.1 | 16.4 |
| Ready Meals | 5.8 | 7.5 | 43.6 |
| Rice, Pasta and Noodles | 5.6 | 4.3 | 23.5 |
| Sauces, Dressings and Condiments | 12.1 | 12.2 | 77.5 |
| Savoury Snacks | −2.2 | 3.3 | 17.8 |
| Shelf Stable Meat, Seafood, Fruit and Vegetables | 7.7 | 5.4 | 30.0 |
| Soup | 2.4 | 6.9 | 39.3 |
| Spreads | 6.8 | 6.4 | 36.2 |
| Sweet Biscuits, Snack Bars and Fruit Snacks | 1.9 | 3.3 | 17.4 |
|
Source: Euromonitor International, 2022 *CAGR: Compound annual growth rate |
|||
Competition and distribution
The German organic packaged food market has a diverse array of players and 39.1% of sales are held by private labels. The largest player in the market is Alnatura Produktions- & Handels GmbH, and its brand Alnatura, held a 7.1% share of the total market in 2021. This company is a dominant force in a number of relatively small organic categories, with a 60.0% market share in organic savoury snacks and a 41.7% share of organic ice cream. However, the company is not a player in the largest organic sector, organic dairy, and the company has a relatively modest 6.6% market share in the second largest category, organic bread.
The second largest player in the organic packaged food category was Hipp GmbH & Co Vertrieb KG and its brand Hipp, with a 59.4% share of the lucrative organic baby food market, however no significant presence in any other category of organic food. The third largest company, Andechser Molkerei Scheitz GmbH, had a relatively modest 1.8% share of the organic packaged food market, achieved through a 6.9% share of the organic dairy market.
In general, in 2021 larger organic food sectors such as dairy and bread tended to be relatively fragmented, with top players enjoying market shares below 7%, while smaller categories were dominated by a single player. Organic baby food was an exception, being dominated by a single player despite being the fourth largest category of organic packaged food in terms of total retail sales.
| Company | Retail sales (US$ millions) | Market Share % |
|---|---|---|
| Alnatura Produktions- & Handels GmbH | 368.7 | 7.1 |
| Hipp GmbH & Co Vertrieb KG | 275.3 | 5.3 |
| Andechser Molkerei Scheitz GmbH | 90.9 | 1.8 |
| Rapunzel Naturkost GmbH | 89.9 | 1.7 |
| DMK Deutsches Milchkontor GmbH | 66.8 | 1.3 |
| Gepa Fair Handelshaus | 58.9 | 1.1 |
| Fürsten-Reform Dr Med Hans Plümer Nachf GmbH & Co | 58.9 | 1.1 |
| Naturata AG | 57.6 | 1.1 |
| PHW Group | 52.6 | 1.0 |
| Frosta AG | 40.3 | 0.8 |
| Private Label | 2,025.4 | 39.1 |
| Artisanal | 476.4 | 9.2 |
| Others | 1,515.0 | 29.4 |
| Source: Euromonitor International, 2022 | ||
| Outlet Type | 2016 | 2021 | ||
|---|---|---|---|---|
| Actual | Share | Actual | Share | |
| Total | 3,838.7 | 100.0 | 5,176.7 | 100.0 |
| Store-Based Retailing | 3,735.2 | 97.3 | 4,890.5 | 94.5 |
| Grocery Retailers | 3,564.3 | 92.9 | 4,677.1 | 90.3 |
| Modern Grocery Retailers | 3,224.8 | 84.0 | 4,290.5 | 82.9 |
| Convenience Stores | 31.2 | 0.8 | 40.9 | 0.8 |
| Discounters | 1,555.8 | 40.5 | 2,099.4 | 40.6 |
| Forecourt Retailers | 36.4 | 0.9 | 45.8 | 0.9 |
| Hypermarkets | 522.1 | 13.6 | 607.7 | 11.7 |
| Supermarkets | 1,079.4 | 28.1 | 1,496.8 | 28.9 |
| Traditional Grocery Retailers | 339.4 | 8.8 | 386.6 | 7.5 |
| Food/drink/tobacco specialists | 60.8 | 1.6 | 68.5 | 1.3 |
| Independent Small Grocers | 36.4 | 0.9 | 42.5 | 0.8 |
| Other Grocery Retailers | 242.3 | 6.3 | 275.6 | 5.3 |
| Non-Grocery Specialists | 51.9 | 1.4 | 65.6 | 1.3 |
| Non-Store Retailing | 103.5 | 2.7 | 286.2 | 5.5 |
| Vending | 20.8 | 0.5 | 17.1 | 0.3 |
| Homeshopping | 31.2 | 0.8 | 31.6 | 0.6 |
| E-Commerce | 51.5 | 1.3 | 237.6 | 4.6 |
| Direct Selling | ||||
|
Source: Euromonitor International, 2022 Note: Actuals for some of sub-outlet types are unavailable. As such, the total of certain sub-categories may not equal to the total of their super-category. |
||||
Subsector Growth
Organic baby food
Organic Baby Food saw total retail sales of US$463.6 million in 2021, with 56.7% of organic baby food sales being prepared baby food. From 2016 to 2021, other baby food saw the fastest growth, while from 2021 to 2026, other baby food was once again expected to see the fastest growth. Other baby food is expected to rise at a CAGR of 3.6%, while prepared baby food grows at a CAGR of 3.3%.
| Category | 2016 | 2017 | 2018 | 2019 | 2020 | 2021 |
|---|---|---|---|---|---|---|
| Organic Baby Food Total | 451.2 | 447.9 | 440.5 | 439.3 | 449.3 | 463.6 |
| Milk Formula | 152.7 | 141.8 | 130.4 | 124.7 | 125.0 | 129.2 |
| Dried Baby Food | 15.4 | 15.5 | 15.5 | 15.6 | 16.3 | 16.7 |
| Prepared Baby Food | 237.5 | 242.0 | 244.2 | 247.8 | 254.8 | 262.8 |
| Other Baby Food | 45.6 | 48.5 | 50.4 | 51.2 | 53.2 | 54.9 |
| Source: Euromonitor International, 2022 | ||||||
| Category | Annual growth % 2020-2021 | CAGR* % 2016-2021 | Total growth % 2016-2021 |
|---|---|---|---|
| Organic Baby Food Total | 3.2 | 0.5 | 2.7 |
| Milk Formula | 3.4 | −3.3 | −15.4 |
| Dried Baby Food | 2.5 | 1.6 | 8.4 |
| Prepared Baby Food | 3.1 | 2.0 | 10.7 |
| Other Baby Food | 3.2 | 3.8 | 20.4 |
|
Source: Euromonitor International, 2022 *CAGR: Compound annual growth rate |
|||
| Company | Retail sales (US$ millions) | Market Share % |
|---|---|---|
| Hipp GmbH & Co Vertrieb KG | 275.3 | 59.4 |
| DMK Deutsches Milchkontor GmbH | 66.8 | 14.4 |
| Töpfer GmbH | 13.1 | 2.8 |
| Alnatura Produktions- & Handels GmbH | 11.2 | 2.4 |
| Hero Group GmbH | 5.6 | 1.2 |
| Private Label | 3.3 | 0.7 |
| Source: Euromonitor International, 2022 | ||
| Category | 2022 | 2023 | 2024 | 2025 | 2026 |
|---|---|---|---|---|---|
| Organic Baby Food Total | 478.6 | 493.8 | 507.4 | 519.6 | 531.2 |
| Milk Formula | 132.2 | 134.2 | 135.5 | 135.9 | 136.7 |
| Dried Baby Food | 17.2 | 17.8 | 18.4 | 18.9 | 19.4 |
| Prepared Baby Food | 272.2 | 282.4 | 292.0 | 301.2 | 309.7 |
| Other Baby Food | 57.0 | 59.3 | 61.5 | 63.5 | 65.5 |
| Source: Euromonitor International, 2022 | |||||
| Category | Annual growth % 2021-2022 | CAGR* % 2021-2026 | Total growth % 2021-2026 |
|---|---|---|---|
| Organic Baby Food Total | 3.2 | 2.8 | 14.6 |
| Milk Formula | 2.3 | 1.1 | 5.8 |
| Baby Food | 3.0 | 3.0 | 16.2 |
| Prepared Baby Food | 3.6 | 3.3 | 17.8 |
| Other Baby Food | 3.8 | 3.6 | 19.3 |
|
Source: Euromonitor International, 2022 *CAGR: Compound annual growth rate |
|||
Organic bread and breakfast cereals
In 2021, sales of organic bread totalled US$985.3 million, making it one of the largest categories of organic packaged food in Germany, and sales grew 9.4% from 2020 to 2021. However, year over year growth is expected to slow to 5.0% for the year 2021-2022, while growth from 2021 to 2026 is expected to slow further to a CAGR of 3.0%.
As a result of the Covid-19 pandemic, consumers have become increasingly concerned with the health and ingredients of their bread, with consumers paying special attention to sugar, fat, and salt. Hemp bread is popular in German organic markets. German consumers typically purchase fresh bread several times per week (Euromonitor, 2021). Germany has a large bread market, with sales of packaged bread in 2021 totalling US$12.2 billion, of which 8.1% was organic.
| Category | 2016 | 2017 | 2018 | 2019 | 2020 | 2021 |
|---|---|---|---|---|---|---|
| Organic Bread | 813.6 | 832.7 | 807.4 | 787.3 | 900.4 | 985.3 |
| Organic Breakfast Cereals | 61.9 | 64.6 | 66.2 | 68.6 | 79.8 | 86.1 |
| Source: Euromonitor International, 2022 | ||||||
| Category | Annual growth % 2020-2021 | CAGR* % 2016-2021 | Total growth % 2016-2021 |
|---|---|---|---|
| Organic Bread | 9.4 | 3.9 | 21.1 |
| Organic Breakfast Cereals | 7.9 | 6.8 | 39.1 |
|
Source: Euromonitor International, 2022 *CAGR: Compound annual growth rate |
|||
| Company | Retail sales (US$ millions) | Market Share % |
|---|---|---|
| Alnatura Produktions- & Handels GmbH | 64.9 | 6.6 |
| Naturata AG | 13.8 | 1.4 |
| Private Label | 395.8 | 40.2 |
| Artisanal | 476.4 | 48.3 |
| Others | 34.4 | 3.5 |
| Source: Euromonitor International, 2022 | ||
| Company | Retail sales (US$ millions) | Market Share % |
|---|---|---|
| mymuesli GmbH | 18.3 | 21.2 |
| Alnatura Produktions- & Handels GmbH | 15.8 | 18.4 |
| Rapunzel Naturkost GmbH | 9.1 | 10.6 |
| Ecotone | 7.1 | 8.2 |
| Schneekoppe GmbH | 6.8 | 7.9 |
| Private Label | 11.9 | 13.8 |
| Others | 17.1 | 19.9 |
| Source: Euromonitor International, 2022 | ||
| Category | 2022 | 2023 | 2024 | 2025 | 2026 |
|---|---|---|---|---|---|
| Organic Bread | 1,034.6 | 1,071.9 | 1,095.7 | 1,118.9 | 1,141.5 |
| Organic Breakfast Cereals | 91.1 | 94.0 | 97.0 | 99.8 | 102.4 |
| Source: Euromonitor International, 2022 | |||||
| Category | Annual growth % 2021-2022 | CAGR* % 2021-2026 | Total growth % 2021-2026 |
|---|---|---|---|
| Organic Bread | 5.0 | 3.0 | 15.9 |
| Organic Breakfast Cereals | 5.8 | 3.5 | 18.9 |
|
Source: Euromonitor International, 2022 *CAGR: Compound annual growth rate |
|||
Organic Cooking Ingredients and Meals
In 2021, spreads was the largest category of organic cooking ingredients and meals, with US$224.5 million in sales, of which US$146.8 million were honey while US$77.7 million were other spreads. From 2016 to 2021, edible oils saw the fastest growth, growing at a CAGR of 12.4%, lead by vegetable and seed oils, which grew at a CAGR of 13.1% and grew 25.0% in the 2020-2021 year. From 2021 to 2026, organic sauces dressings and condiments are expected to see the fastest growth, growing at a CAGR of 12.2%. In the 2021-2022 year spreads are expected to see the fastest year over year growth with an increase of 15.1%.
| Category | 2016 | 2017 | 2018 | 2019 | 2020 | 2021 |
|---|---|---|---|---|---|---|
| Organic Edible Oil Total | 77.0 | 81.8 | 86.8 | 94.5 | 115.8 | 138.2 |
| Olive Oil | 38.2 | 41.2 | 44.6 | 47.6 | 58.2 | 66.3 |
| Vegetable and Seed Oil | 38.8 | 40.6 | 42.3 | 46.9 | 57.5 | 71.9 |
| Organic Ready Meals | 56.7 | 58.5 | 60.7 | 63.6 | 74.4 | 85.7 |
| Organic Sauces, Dressings and Condiments | 38.7 | 39.8 | 41.1 | 43.0 | 55.6 | 63.6 |
| Organic Soup | 5.5 | 5.6 | 5.8 | 6.0 | 7.5 | 8.4 |
| Organic Spreads Total | 147.7 | 150.8 | 154.9 | 164.2 | 193.2 | 224.5 |
| Spreads | 51.7 | 53.3 | 55.3 | 59.0 | 68.0 | 77.7 |
| Honey | 96.0 | 97.5 | 99.7 | 105.2 | 125.3 | 146.8 |
| Source: Euromonitor International, 2022 | ||||||
| Category | Annual growth % 2020-2021 | CAGR* % 2016-2021 | Total growth % 2016-2021 |
|---|---|---|---|
| Organic Edible Oil Total | 19.3 | 12.4 | 79.5 |
| Olive Oil | 13.9 | 11.7 | 73.6 |
| Vegetable and Seed Oil | 25.0 | 13.1 | 85.3 |
| Organic Ready Meals | 15.2 | 8.6 | 51.1 |
| Organic Sauces, Dressings and Condiments | 14.4 | 10.4 | 64.3 |
| Organic Soup | 12.0 | 8.8 | 52.7 |
| Organic Spreads Total | 16.2 | 8.7 | 52.0 |
| Spreads | 14.3 | 8.5 | 50.3 |
| Honey | 17.2 | 8.9 | 52.9 |
|
Source: Euromonitor International, 2022 *CAGR: Compound annual growth rate |
|||
| Company | Retail sales (US$ millions) | Market Share % |
|---|---|---|
| Alnatura Produktions- & Handels GmbH | 49.8 | 36.1 |
| Bio Planète FJ Moog SAS | 25.3 | 18.3 |
| Naturata AG | 12.8 | 9.2 |
| Rapunzel Naturkost GmbH | 8.1 | 5.9 |
| Fauser Vitaquellwerk KG GmbH & Co | 4.1 | 3.0 |
| Others | 38.2 | 27.6 |
| Source: Euromonitor International, 2022 | ||
| Company | Retail sales (US$ millions) | Market Share % |
|---|---|---|
| Alnatura Produktions- & Handels GmbH | 20.8 | 24.3 |
| Nestlé SA | 8.6 | 10.0 |
| Ökoland GmbH Nord | 4.1 | 4.7 |
| Kurhessische Fleischwaren GmbH | 3.1 | 3.6 |
| Demeter Felderzeugnisse GmbH | 1.1 | 1.3 |
| Private Label | 20.8 | 24.3 |
| Others | 27.3 | 31.8 |
| Source: Euromonitor International, 2022 | ||
| Company | Retail sales (US$ millions) | Market Share % |
|---|---|---|
| Alnatura Produktions- & Handels GmbH | 11.1 | 17.5 |
| Rapunzel Naturkost GmbH | 9.5 | 15.0 |
| Zwergenwiese Naturkost GmbH | 6.1 | 9.6 |
| Private Label | 10.8 | 17.0 |
| Others | 26.1 | 40.9 |
| Source: Euromonitor International, 2022 | ||
| Company | Retail sales (US$ millions) | Market Share % |
|---|---|---|
| Ecotone | 2.5 | 29.9 |
| Alnatura Produktions- & Handels GmbH | 2.3 | 27.7 |
| Ökoland GmbH Nord | 0.5 | 5.8 |
| Hügli Nahrungsmittel GmbH | 0.2 | 2.8 |
| Others | 2.8 | 33.8 |
| Source: Euromonitor International, 2022 | ||
| Company | Retail sales (US$ millions) | Market Share % |
|---|---|---|
| Fürsten-Reform Dr Med Hans Plümer Nachf GmbH & Co | 58.9 | 26.2 |
| Schneekoppe GmbH | 4.7 | 2.1 |
| Campo Verde GmbH | 3.8 | 1.7 |
| Ethiquable Deutschland e. G. | 2.3 | 1.0 |
| Private Label | 35.1 | 15.7 |
| Others | 119.7 | 53.3 |
| Source: Euromonitor International, 2022 | ||
| Category | 2022 | 2023 | 2024 | 2025 | 2026 |
|---|---|---|---|---|---|
| Organic Edible Oil Total | 151.9 | 178.9 | 190.1 | 206.2 | 219.2 |
| Olive Oil | 73.2 | 81.2 | 84.4 | 90.6 | 95.4 |
| Vegetable and Seed Oil | 78.6 | 97.8 | 105.7 | 115.5 | 123.7 |
| Organic Ready Meals | 90.7 | 98.0 | 104.4 | 112.9 | 123.1 |
| Organic Sauces, Dressings and Condiments | 71.3 | 80.2 | 89.3 | 100.8 | 112.9 |
| Organic Soup | 8.6 | 9.5 | 10.0 | 10.8 | 11.7 |
| Organic Spreads Total | 239.8 | 269.7 | 282.8 | 297.2 | 305.8 |
| Spreads | 89.4 | 102.7 | 113.2 | 123.0 | 128.5 |
| Honey | 150.3 | 166.9 | 169.5 | 174.3 | 177.3 |
| Source: Euromonitor International, 2022 | |||||
| Category | Annual growth % 2021-2022 | CAGR* % 2021-2026 | Total growth % 2021-2026 |
|---|---|---|---|
| Organic Edible Oil Total | 9.9 | 9.7 | 58.6 |
| Olive Oil | 10.4 | 7.5 | 43.9 |
| Vegetable and Seed Oil | 9.3 | 11.5 | 72.0 |
| Organic Ready Meals | 5.8 | 7.5 | 43.6 |
| Organic Sauces, Dressings and Condiments | 12.1 | 12.2 | 77.5 |
| Organic Soup | 2.4 | 6.9 | 39.3 |
| Organic Spreads Total | 6.8 | 6.4 | 36.2 |
| Spreads | 15.1 | 10.6 | 65.4 |
| Honey | 2.4 | 3.8 | 20.8 |
|
Source: Euromonitor International, 2022 *CAGR: Compound annual growth rate |
|||
Organic Dairy
In 2021, organic dairy saw total retail sales of US$1.3 billion, accounting for 5.2% of total dairy sales and having grown at a CAGR of 7.9% from 2016 to 2021. Within the dairy subsector, organic milk was the largest subcategory, as well as the subcategory which saw the fastest growth from 2016 to 2021. Organic milk sales were US$495.4 million in 2021 and grew at a CAGR of 10.6% from 2016 to 2021. Organic cheese and organic yoghurt were also popular, with 2021 sales of US$302.9 million and US$167.0 million respectively.
From 2021 to 2026, organic cheese is the subcategory expected to see the fastest growth. Organic cheese sales are forecast to expand at a CAGR of 4.3% from 2021 to 2026, reaching US$374.0 million in 2026. Organic milk is also expected to see relatively fast growth, rising at a CAGR of 3.8% and reaching US$596.9 million in 2026.
Demand for organic dairy products is driven in large part by consumer desire for greater sustainability and animal welfare. However, this also comes at a time of increasing interest in alternatives to dairy products, with many consumers viewing dairy as harmful whether organic or not. Many consumers in Germany are opting to reduce their consumption of dairy, and dairy sales are expected to fall in 2022 (Euromonitor, 2021).
The market for organic dairy was relatively fragmented in 2021, with the largest player holding a 6.9% market share. The second largest player held 2.6% of the market in 2021, while private labels accounted for 58.5% of the market.
| Category | 2016 | 2017 | 2018 | 2019 | 2020 | 2021 |
|---|---|---|---|---|---|---|
| Organic Dairy Total | 903.6 | 1,011.0 | 1,062.5 | 1,121.9 | 1,248.1 | 1,319.4 |
| Butter and Spreads | 84.2 | 104.7 | 106.5 | 109.8 | 120.0 | 125.2 |
| Cheese | 206.0 | 235.5 | 242.9 | 252.4 | 285.0 | 302.9 |
| Cream | 87.3 | 91.1 | 94.4 | 100.8 | 106.9 | 111.9 |
| Flavoured Milk Drinks | 2.5 | 2.7 | 2.9 | 3.0 | 3.5 | 3.6 |
| Fresh Cheese and Quark | 71.1 | 76.1 | 79.6 | 85.1 | 90.6 | 93.3 |
| Milk | 299.2 | 338.2 | 369.8 | 403.1 | 463.1 | 495.4 |
| Sour Milk Products | 15.7 | 16.6 | 17.6 | 17.9 | 19.2 | 20.1 |
| Yoghurt | 137.5 | 146.2 | 148.8 | 149.8 | 159.7 | 167.0 |
| Source: Euromonitor International, 2022 | ||||||
| Category | Annual growth % 2020-2021 | CAGR* % 2016-2021 | Total growth % 2016-2021 |
|---|---|---|---|
| Organic Dairy Total | 5.7 | 7.9 | 46.0 |
| Butter and Spreads | 4.3 | 8.3 | 48.7 |
| Cheese | 6.3 |
8.0 |
47.0 |
| Cream | 4.7 | 5.1 | 28.2 |
| Flavoured Milk Drinks | 2.9 | 7.6 | 44.0 |
| Fresh Cheese and Quark | 3.0 | 5.6 | 31.2 |
| Milk | 7.0 | 10.6 | 65.6 |
| Sour Milk Products | 4.7 | 5.1 | 28.0 |
| Yoghurt | 4.6 | 4.0 | 21.5 |
|
Source: Euromonitor International, 2022 *CAGR: Compound annual growth rate |
|||
| Company | Retail sales (US$ millions) | Market Share % |
|---|---|---|
| Andechser Molkerei Scheitz GmbH | 90.9 | 6.9 |
| Unternehmensgruppe Theo Müller S.e.c.s. | 34.2 | 2.6 |
| Hügli Holding AG | 32.0 | 2.4 |
| Hochwald Foods GmbH | 24.5 | 1.9 |
| Milchwerke Berchtesgadener Land e. G. | 19.1 | 1.4 |
| Private Label | 772.2 | 558.5 |
| Others | 346.5 | 26.3 |
| Source: Euromonitor International, 2022 | ||
| Category | 2022 | 2023 | 2024 | 2025 | 2026 |
|---|---|---|---|---|---|
| Organic Dairy Total | 1,351.2 | 1,404.8 | 1,454.7 | 1,507.8 | 1,562.2 |
| Butter and Spreads | 129.3 | 133.9 | 138.3 | 143.0 | 147.8 |
| Cheese | 313.2 | 327.7 | 342.2 | 357.8 | 374.0 |
| Cream | 113.5 | 116.3 | 119.0 | 121.4 | 123.8 |
| Flavoured Milk Drinks | 3.9 | 4.0 | 4.1 | 4.2 | 4.3 |
| Fresh Cheese and Quark | 95.4 | 98.0 | 100.8 | 103.5 | 106.1 |
| Milk | 510.7 | 534.0 | 553.5 | 574.9 | 596.9 |
| Sour Milk Products | 20.1 | 20.7 | 21.3 | 22.0 | 22.7 |
| Yoghurt | 165.0 | 170.2 | 175.4 | 181.0 | 186.7 |
| Source: Euromonitor International, 2022 | |||||
| Category | Annual growth % 2021-2022 | CAGR* % 2021-2026 | Total growth % 2021-2026 |
|---|---|---|---|
| Organic Dairy Total | 2.4 | 3.4 | 18.4 |
| Butter and Spreads | 3.3 | 3.4 | 18.1 |
| Cheese | 3.4 | 4.3 | 23.5 |
| Cream | 1.4 | 2.0 | 10.6 |
| Flavoured Milk Drinks | 8.3 | 3.6 | 19.4 |
| Fresh Cheese and Quark | 2.3 | 2.6 | 13.7 |
| Milk | 3.1 | 3.8 | 20.5 |
| Sour Milk Products | 0.0 | 2.5 | 12.9 |
| Yoghurt | 4.6 | 4.0 | 21.5 |
|
Source: Euromonitor International, 2022 *CAGR: Compound annual growth rate |
|||
Organic processed meat, seafood, fruits and vegetable
In 2021, organic chilled meat and seafood had the largest retail sales, with sales totalling US$788.4 million, compared with US$225.1 million for organic frozen meat, seafood, fruit and vegetables, and US$253.5 million for organic shelf stable meat, seafood, fruit and vegetables.
The German processed meat market is suffering from an increasing number of Germans seeking to cut back on meat consumption or give it up entirely. German consumers are concerned with both the environmental and health impacts of excessive meat consumption, and pork is perceived as the least healthy type of meat, with demand expected to fall, while poultry enjoys perceptions of health. Nevertheless, sales growth of organic processed meat is expected to remain strong in coming years.
From 2016 to 2021, organic frozen meat, seafood, fruit and vegetables saw the fastest growth, growing at a CAGR of 8.5%, followed closely by organic chilled processed meat and seafood at a CAGR of 8.3%. Organic chilled processed meat and seafood saw the fastest growth in the 2020-2021 year, however organic shelf stable meat, seafood, fruit and vegetables is expected to see the fastest growth during the 2021-2022 period, as well as from 2021 to 2026.
| Category | 2016 | 2017 | 2018 | 2019 | 2020 | 2021 |
|---|---|---|---|---|---|---|
| Organic Chilled Processed Meat and Seafood | 528.4 | 551.7 | 563.0 | 572.7 | 725.9 | 788.4 |
| Organic Frozen Meat, Seafood, Fruit and Vegetables | 149.9 | 154.6 | 156.9 | 160.4 | 209.3 | 225.1 |
| Organic Shelf Stable Meat, Seafood, Fruit and Vegetables | 177.8 | 183.2 | 184.5 | 190.9 | 236.7 | 253.5 |
| Source: Euromonitor International, 2022 | ||||||
| Category | Annual growth % 2020-2021 | CAGR* % 2016-2021 | Total growth % 2016-2021 |
|---|---|---|---|
| Organic Chilled Processed Meat and Seafood | 8.6 | 8.3 | 49.2 |
| Organic Frozen Meat, Seafood, Fruit and Vegetables | 7.5 | 8.5 | 50.2 |
| Organic Shelf Stable Meat, Seafood, Fruit and Vegetables | 7.1 | 7.4 | 42.6 |
|
Source: Euromonitor International, 2022 *CAGR: Compound annual growth rate |
|||
| Company | Retail sales (US$ millions) | Market Share % |
|---|---|---|
| PHW Group | 52.6 | 6.7 |
| Biofino GmbH | 26.7 | 3.4 |
| Franz Wiltmann GmbH & Co KG | 19.7 | 2.5 |
| Private Label | 531.4 | 67.4 |
| Others | 158.0 | 20.0 |
| Source: Euromonitor International, 2022 | ||
| Company | Retail sales (US$ millions) | Market Share % |
|---|---|---|
| Frosta AG | 40.3 | 17.9 |
| Private Label | 85.3 | 37.9 |
| Others | 99.4 | 44.2 |
| Source: Euromonitor International, 2022 | ||
| Company | Retail sales (US$ millions) | Market Share % |
|---|---|---|
| Alnatura Produktions- & Handels GmbH | 71.7 | 28.3 |
| Private Label | 85.1 | 33.6 |
| Others | 96.7 | 38.1 |
| Source: Euromonitor International, 2022 | ||
| Category | 2022 | 2023 | 2024 | 2025 | 2026 |
|---|---|---|---|---|---|
| Organic Chilled Processed Meat and Seafood | 831.2 | 866.4 | 903.1 | 932.6 | 962.7 |
| Organic Frozen Meat, Seafood, Fruit and Vegetables | 237.2 | 249.5 | 260.7 | 269.4 | 278.0 |
| Organic Shelf Stable Meat, Seafood, Fruit and Vegetables | 273.0 | 290.3 | 305.7 | 318.9 | 329.5 |
| Source: Euromonitor International, 2022 | |||||
| Category | Annual growth % 2021-2022 | CAGR* % 2021-2026 | Total growth % 2021-2026 |
|---|---|---|---|
| Organic Chilled Processed Meat and Seafood | 5.4 | 4.1 | 22.1 |
| Organic Frozen Meat, Seafood, Fruit and Vegetables | 5.4 | 4.3 | 23.5 |
| Organic Shelf Stable Meat, Seafood, Fruit and Vegetables | 7.7 | 5.4 | 30.0 |
|
Source: Euromonitor International, 2022 *CAGR: Compound annual growth rate |
|||
Organic rice and pasta
Sales of organic pasta saw very strong growth of 9.8% in the 2020-2021, however growth is forecast to slow to 5.3% from 2021 to 2022 and continue at a CAGR of 4.3% over the 2021-2026 period. Sales of organic rice are forecast to grow 10.0% from 2021 to 2022, before slowing to a CAGR of 4.6% from 2021 to 2026.
| Category | 2016 | 2017 | 2018 | 2019 | 2020 | 2021 |
|---|---|---|---|---|---|---|
| Organic rice and pasta Total | 30.0 | 30.8 | 31.5 | 33.1 | 37.7 | 41.3 |
| Rice | 1.4 | 1.5 | 1.5 | 1.6 | 1.9 | 2.0 |
| Pasta | 28.5 | 29.3 | 30.0 | 31.5 | 35.8 | 39.3 |
| Source: Euromonitor International, 2022 | ||||||
| Category | Annual growth % 2020-2021 | CAGR* % 2016-2021 | Total growth % 2016-2021 |
|---|---|---|---|
| Organic rice and pasta Total | 9.5 | 6.6 | 37.7 |
| Organic Rice | 5.3 | 7.4 | 42.9 |
| Organic Pasta | 9.8 | 6.6 | 37.9 |
|
Source: Euromonitor International, 2022 *CAGR: Compound annual growth rate |
|||
| Company | Retail sales (US$ millions) | Market Share % |
|---|---|---|
| Alnatura Produktions- & Handels GmbH | 15.6 | 37.8 |
| Vita + Naturprodukte AG | 3.1 | 7.5 |
| Barilla Holding SpA | 2.2 | 5.4 |
| Rapunzel Naturkost GmbH | 0.8 | 2.0 |
| Private Label | 12.8 | 31.1 |
| Others | 6.7 | 16.2 |
| Source: Euromonitor International, 2022 | ||
| Category | 2022 | 2023 | 2024 | 2025 | 2026 |
|---|---|---|---|---|---|
| Organic rice and pasta Total | 43.6 | 45.6 | 47.5 | 49.3 | 51.0 |
| Organic Rice | 2.2 | 2.3 | 2.4 | 2.5 | 2.5 |
| Organic Pasta | 41.4 | 43.3 | 45.1 | 46.8 | 48.4 |
| Source: Euromonitor International, 2022 | |||||
| Category | Annual growth % 2021-2022 | CAGR* % 2021-2026 | Total growth % 2021-2026 |
|---|---|---|---|
| Organic rice and pasta Total | 5.6 | 4.3 | 23.5 |
| Organic Rice | 10.0 | 4.6 | 25.0 |
| Organic Pasta | 5.3 | 4.3 | 23.2 |
|
Source: Euromonitor International, 2022 *CAGR: Compound annual growth rate |
|||
Organic Snacks
The organic snacks category was dominated by organic confectionery in 2021, and especially organic chocolate confectionery. Organic chocolate confectionery recorded total retail sales of US$323.1 million in 2021, accounting for 65.5% of total snack sales.
Consumers of premium chocolate confectionery are becoming increasingly concerned with health, and sellers are responding by offering lower sugar options, while vegan chocolate is becoming more popular. Meanwhile, German consumers of chocolate confectionery often purchase less frequently, leading to a shift towards larger pack sizes (Euromonitor, 2021).
Growth from 2016 to 2021 was led by organic savoury snacks, which grew at a CAGR of 7.8%, however growth from 2021 to 2026 is expected to be led by organic confectionery. Organic confectionery is expected to grow at a CAGR of 3.0% from 2021 to 2026, while organic chocolate confectionery grows at a CAGR of 3.9%. Organic chocolate confectionery is expected to see the fastest growth in the 2021-2022 year, growing 4.4%.
| Category | 2016 | 2017 | 2018 | 2019 | 2020 | 2021 |
|---|---|---|---|---|---|---|
| Organic Confectionery | 314.8 | 329.4 | 341.0 | 351.1 | 368.0 | 384.1 |
| Chocolate Confectionery | 262.4 | 275.9 | 286.4 | 295.6 | 310.4 | 323.1 |
| Sugar Confectionery | 52.4 | 53.4 | 54.6 | 55.5 | 57.6 | 61.0 |
| Organic Ice Cream | 22.3 | 22.9 | 23.7 | 24.6 | 26.0 | 26.8 |
| Organic Savoury Snacks | 27.8 | 29.9 | 32.0 | 34.3 | 38.6 | 40.5 |
| Nuts, Seeds, Trail Mixes | 13.6 | 14.7 | 16.0 | 17.3 | 19.1 | 20.0 |
| Savoury Snacks | 14.2 | 15.2 | 16.1 | 17.0 | 19.5 | 20.5 |
| Organic Sweet Biscuits, Snack Bars and Fruit Snacks | 31.9 | 34.1 | 36.0 | 37.8 | 39.7 | 41.9 |
| Cereal Bars | 0.8 | 0.8 | 0.9 | 0.9 | 1.0 | 1.1 |
| Fruit Snacks | 10.8 | 11.8 | 12.6 | 13.5 | 14.4 | 15.3 |
| Sweet Biscuits | 20.3 | 21.5 | 22.5 | 23.4 | 24.4 | 25.5 |
| Source: Euromonitor International, 2022 | ||||||
| Category | Annual growth % 2020-2021 | CAGR* % 2016-2021 | Total growth % 2016-2021 |
|---|---|---|---|
| Organic Confectionery | 4.4 | 4.1 | 22.0 |
| Chocolate Confectionery | 4.1 | 4.2 | 23.1 |
| Sugar Confectionery | 5.9 | 3.1 | 16.4 |
| Organic Ice Cream | 3.1 | 3.7 | 20.2 |
| Organic Savoury Snacks | 4.9 | 7.8 | 45.7 |
| Nuts, Seeds, Trail Mixes | 4.7 | 8.0 | 47.1 |
| Savoury Snacks | 5.1 | 7.6 | 44.4 |
| Organic Sweet Biscuits, Snack Bars and Fruit Snacks | 5.5 | 5.6 | 31.3 |
| Cereal Bars | 10.0 | 6.6 | 37.5 |
| Fruit Snacks | 6.3 | 7.2 | 41.7 |
| Sweet Biscuits | 4.5 | 4.7 | 25.6 |
|
Source: Euromonitor International, 2022 *CAGR: Compound annual growth rate |
|||
| Company | Retail sales (US$ millions) | Market Share % |
|---|---|---|
| Alnatura Produktions- & Handels GmbH | 59.1 | 15.4 |
| Gepa Fair Handelshaus | 58.9 | 15.3 |
| Rapunzel Naturkost GmbH | 57.0 | 14.8 |
| Naturata AG | 31.0 | 8.1 |
| EcoFinia GmbH | 18.5 | 4.8 |
| Private Label | 46.8 | 12.2 |
| Others | 112.8 | 29.4 |
| Source: Euromonitor International, 2022 | ||
| Company | Retail sales (US$ millions) | Market Share % |
|---|---|---|
| Alnatura Produktions- & Handels GmbH | 11.2 | 41.7 |
| Brüder Ghisolfi | 8.1 | 30.2 |
| Others | 7.5 | 28.0 |
| Source: Euromonitor International, 2022 | ||
| Company | Retail sales (US$ millions) | Market Share % |
|---|---|---|
| Alnatura Produktions- & Handels GmbH | 24.3 | 60.0 |
| Vita + Naturprodukte AG | 3.7 | 9.1 |
| Private Label | 4.8 | 11.9 |
| Others | 7.7 | 19.0 |
| Source: Euromonitor International, 2022 | ||
| Company | Retail sales (US$ millions) | Market Share % |
|---|---|---|
| Alnatura Produktions- & Handels GmbH | 10.6 | 25.3 |
| Ecotone | 5.3 | 12.7 |
| Rapunzel Naturkost GmbH | 5.3 | 12.5 |
| Weiling GmbH | 3.9 | 9.3 |
| BioGourmet GmbH | 1.0 | 2.3 |
| Private Label | 9.1 | 21.6 |
| Others | 6.8 | 16.2 |
| Source: Euromonitor International, 2022 | ||
| Category | 2022 | 2023 | 2024 | 2025 | 2026 |
|---|---|---|---|---|---|
| Organic Confectionery | 400.1 | 416.2 | 432.1 | 447.3 | 462.6 |
| Organic Chocolate Confectionery | 337.3 | 351.5 | 365.0 | 378.4 | 392.0 |
| Organic Sugar Confectionery | 62.8 | 64.7 | 67.0 | 69.0 | 70.6 |
| Organic Ice Cream | 27.3 | 28.3 | 29.3 | 30.3 | 31.2 |
| Organic Savoury Snacks | 39.6 | 41.7 | 43.7 | 45.7 | 47.7 |
| Organic Nuts, Seeds, Trail Mixes | 20.4 | 21.6 | 22.8 | 24.1 | 25.4 |
| Organic Savoury Snacks | 19.3 | 20.1 | 20.9 | 21.6 | 22.3 |
| Organic Sweet Biscuits, Snack Bars and Fruit Snacks | 42.7 | 44.4 | 46.0 | 47.6 | 49.2 |
| Organic Cereal Bars | 1.0 | 1.1 | 1.1 | 1.1 | 1.1 |
| Organic Fruit Snacks | 15.8 | 16.5 | 17.2 | 17.9 | 18.7 |
| Organic Sweet Biscuits | 25.9 | 26.9 | 27.7 | 28.6 | 29.4 |
| Source: Euromonitor International, 2022 | |||||
| Category | Annual growth % 2021-2022 | CAGR* % 2021-2026 | Total growth % 2021-2026 |
|---|---|---|---|
| Organic Confectionery | 4.2 | 3.8 | 20.4 |
| Organic Chocolate Confectionery | 4.4 | 3.9 | 21.3 |
| Organic Sugar Confectionery | 3.0 | 3.0 | 15.7 |
| Organic Ice Cream | 1.9 | 3.1 | 16.4 |
| Organic Savoury Snacks | −2.2 | 3.3 | 17.8 |
| Organic Nuts, Seeds, Trail Mixes | 2.0 | 4.9 | 27.0 |
| Organic Savoury Snacks | −5.9 | 1.7 | 8.8 |
| Organic Sweet Biscuits, Snack Bars and Fruit Snacks | 1.9 | 3.3 | 17.4 |
| Organic Cereal Bars | −9.1 | 0.0 | 0.0 |
| Organic Fruit Snacks | 3.3 | 4.1 | 22.2 |
| Organic Sweet Biscuits | 1.6 | 2.9 | 15.3 |
|
Source: Euromonitor International, 2022 *CAGR: Compound annual growth rate |
|||
New product launch analysis
From 2017 to 2021, a total of 14,422 organic products were launched in the German market. The top claim on newly launched organic products from 2017 to 2021 was to be vegan or free of animal ingredients, with 5,922 total organic products bearing this claim, or 41.1% of all organic products. A claim of low/no/reduced allergen applied to 4,097 launches (28.4%), gluten free applied to 4,097 (28.4%), and claims of sustainability (habitat/resources) to 3,247 (22.5%). 2,753 products claimed to be environmentally friendly (19.1%) and 2,375 claimed to come in environmentally friendly packaging (16.5%).
Flexible packaging was the most popular type of packaging with 5,571 launches (38.6%), followed by jar with 2,507 (17.4%), and carton with 976 (6.8%). Unflavoured/Plain was by far the most popular flavour, with 5,046 launches (35.0%), followed by chocolate with 231 (1.6%). Top ingredients included sea salt with 3,938 launches (27.3%), waters with 3,163 (21.9%) and sunflower seed oil with 2,934 (20.3%).
| Product attributes | Number of new products by year | Total | ||||
|---|---|---|---|---|---|---|
| 2017 | 2018 | 2019 | 2020 | 2021 | ||
| Yearly product launches | 2,992 | 2,462 | 3,194 | 2,982 | 2,792 | 14,422 |
| Top 10 claims | ||||||
| Vegan/No Animal Ingredients | 1,248 | 968 | 1,340 | 1,295 | 1,071 | 5,922 |
| Low/No/Reduced Allergen | 920 | 751 | 956 | 843 | 627 | 4,097 |
| Gluten Free | 741 | 595 | 740 | 671 | 501 | 3,248 |
| Ethical - Sustainable (Habitat/Resources) | 508 | 450 | 703 | 708 | 878 | 3,247 |
| Ethical - Environmentally Friendly Product | 468 | 399 | 568 | 594 | 724 | 2,753 |
| Ethical - Environmentally Friendly Package | 265 | 295 | 453 | 592 | 770 | 2,375 |
| No Additives/Preservatives | 313 | 348 | 424 | 392 | 356 | 1,833 |
| Vegetarian | 317 | 276 | 390 | 349 | 312 | 1,644 |
| Ethical - Human | 311 | 260 | 282 | 309 | 312 | 1,474 |
| Low/No/Reduced Lactose | 358 | 244 | 364 | 227 | 185 | 1,378 |
| Top 10 companies | ||||||
| DM Drogerie Markt | 128 | 102 | 187 | 215 | 158 | 790 |
| Alnatura | 122 | 67 | 107 | 92 | 99 | 487 |
| Dirk Rossmann | 47 | 67 | 148 | 83 | 119 | 464 |
| Lidl | 103 | 85 | 99 | 61 | 68 | 416 |
| Penny Markt | 28 | 27 | 49 | 76 | 119 | 299 |
| Aldi Süd | 52 | 81 | 46 | 80 | 25 | 284 |
| Dennree | 87 | 51 | 41 | 46 | 18 | 243 |
| REWE Markt | 12 | 39 | 66 | 49 | 40 | 206 |
| Edeka Zentrale | 41 | 51 | 33 | 25 | 42 | 192 |
| Aldi Nord | 71 | 22 | 47 | 24 | 26 | 190 |
| Top 5 flavours (including blend) | ||||||
| Unflavoured/Plain | 1,055 | 871 | 1,046 | 1,069 | 1,005 | 5,046 |
| Chocolate | 49 | 33 | 56 | 53 | 40 | 231 |
| Coconut | 39 | 29 | 43 | 15 | 16 | 142 |
| Vegetable | 30 | 23 | 30 | 30 | 19 | 132 |
| Strawberry | 15 | 25 | 24 | 36 | 30 | 130 |
| Top 5 ingredients | ||||||
| Sea Salt (Food) | 867 | 694 | 848 | 802 | 727 | 3,938 |
| Waters (Food) | 641 | 539 | 714 | 637 | 632 | 3,163 |
| Sunflower Seed Oil (Food) | 601 | 485 | 656 | 649 | 543 | 2,934 |
| Salt (Food) | 444 | 378 | 509 | 480 | 461 | 2,272 |
| Unrefined Natural Sugar (Food) | 497 | 370 | 478 | 450 | 365 | 2,160 |
| Launch types | ||||||
| New Variety/Range Extension | 1,347 | 1,085 | 1,322 | 1,216 | 1,149 | 6,119 |
| New Product | 964 | 742 | 964 | 838 | 715 | 4,223 |
| New Packaging | 463 | 493 | 710 | 690 | 729 | 3,085 |
| Relaunch | 187 | 122 | 182 | 216 | 179 | 886 |
| New Formulation | 31 | 20 | 16 | 22 | 20 | 109 |
| Top 5 package types | ||||||
| Flexible | 1,211 | 973 | 1,230 | 1,176 | 981 | 5,571 |
| Jar | 408 | 375 | 504 | 539 | 681 | 2,507 |
| Carton | 197 | 155 | 240 | 196 | 188 | 976 |
| Tub | 211 | 175 | 218 | 163 | 124 | 891 |
| Bottle | 163 | 129 | 147 | 122 | 205 | 766 |
| Product origin | ||||||
| Imported | 391 | 342 | 462 | 372 | 362 | 1,929 |
| Not imported | 475 | 404 | 531 | 456 | 297 | 2,16 |
| Source: Mintel GNPD, 2022 | ||||||
| Category | Number of products | Average price (in US$) |
|---|---|---|
| Baking Ingredients & Mixes | 595 | 4.02 |
| Cold Cereals | 569 | 4.59 |
| Pasta | 568 | 2.92 |
| Sweet Biscuits/Cookies | 537 | 2.99 |
| Seasonings | 527 | 4.84 |
| Snack/Cereal/Energy Bars | 512 | 2.25 |
| Oils | 444 | 8.05 |
| Meat Products | 365 | 4.57 |
| Vegetables | 353 | 2.93 |
| Meat Substitutes | 324 | 3.26 |
| Bread & Bread Products | 312 | 2.99 |
| Chocolate Tablets | 310 | 3.04 |
| Savoury Vegetable Pastes/Spreads | 280 | 2.88 |
| Spoonable Yogurt | 251 | 1.55 |
| Jams & Fruit Spreads | 242 | 3.72 |
| Other | 8,233 | 3.69 |
| Source: Mintel GNPD, 2022 | ||
Examples of new products
Spinach-Ricotta Cappelletti

| Company | REWE Zentral |
|---|---|
| Brand | Rewe Bio (Private Label) |
| Category | Side dishes |
| Sub-category | Pasta |
| Store type | Supermarket |
| Date published | May 2022 |
| Launch type | New packaging |
| Location of manufacture | Not specified |
| Price in US dollars | 2.10 ($0.84 per 100 grams / millilitres) |
Rewe Bio Cappelletti Spinat-Ricotta (Spinach-Ricotta Cappelletti) is microwaveable product, scored a B on the Nutri-Score. The product package features BIO, EU Organic, Naturland, FSC Mix and Ohne Kükentöten (Without Killing Chicks) logos.
Positioning claims: Ethical (animal, environmentally friendly package, sustainable), microwaveable, time / speed
Organic Gourmet Prawns

| Company | Followfood |
|---|---|
| Brand | Followfish |
| Category | Processed fish products |
| Sub-category | Frozen fish products |
| Store type | Supermarket |
| Date published | May 2022 |
| Launch type | New packaging |
| Location of manufacture | Not specified |
| Price in US dollars | $10.54 ($4.12 per per 100 grams / millilitres) |
Followfish Bio Garnelen (Organic Gourmet Prawns) claims to be 100% sustainable and climate-neutral product. This organic product retails in a 256 gram pack, featuring cooking instructions, the Naturland and EU Organic logos, as well as a QR code.
Positioning claims: Carbon neutral, ethical (environmentally friendly, sustainable)
Virgin Coconut Oil
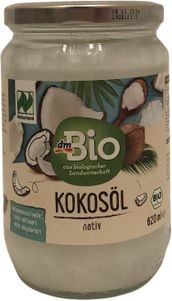
| Company | DM Drogerie Markt |
|---|---|
| Brand | DM Bio (Private Label) |
| Category | Sauces and seasonings |
| Sub-category | Oils |
| Store type | Drug store / pharmacy |
| Date published | May 2022 |
| Launch type | New packaging |
| Location of manufacture | Sri Lanka |
| Price in US dollars | $1.10 ($1.10 per 100 millilitres) |
DM Bio Kokosöl Nativ (Virgin Coconut Oil) is a cold-pressed, non-refined and deodorised coconut oil that claims to vegan friendly. The product retails in a 620 millilitre pack featuring the EU Organic, Naturland, V-Label seal from the European Vegetarian Union and Bio logos.
Positioning claims: Vegan / no animal ingredients, vegetarian
Organic Maple Syrup (Grade C)

| Company | DM Drogerie Markt |
|---|---|
| Brand | DM Bio (Private Label) |
| Category | Shelf stable |
| Sub-category | Syrups |
| Store type | Drug store / pharmacy |
| Date published | October 2018 |
| Launch type | New packaging |
| Location of manufacture | Not specified |
| Price in US dollars | 5.64 ($1.84 per 100 millilitres) |
DM Bio Ahornsirup Grad C (Organic Grade C Maple Syrup) is a Canadian product that is suitable for vegans, and retails in a 375 millilitre pack bearing the Bio, Vegan V-Label seal from the European Vegetarian Union and EU Organic logos.
Positioning claims: Not specified
Organic Pumpkin Seed Oil
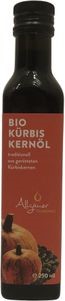
| Company | Allgäuer Ölmühle |
|---|---|
| Brand | Allgäuer Ölmühle |
| Category | Sauces and seasonings |
| Sub-category | Oils |
| Store type | Supermarket |
| Date published | May 2022 |
| Launch type | New variety / range extension |
| Location of manufacture | Not specified |
| Price in US dollars | 12.65 ($5.06 per 100 millilitres) |
Allgäuer Ölmühle Bio Kürbiskernol (Organic Pumpkin Seed Oil) is made from roasted shelled pumpkin seeds, and retails in a 250 millilitre pack featuring EU Organic logo.
Positioning claims: Not specified
Fresh Organic Eggs

| Company | Lidl |
|---|---|
| Brand | Bio (Private Label) |
| Category | Processed fish, meat and egg products |
| Sub-category | Eggs and egg products |
| Store type | Supermarket |
| Date published | May 2022 |
| Launch type | New packaging |
| Price in US dollars | 5.54 |
Bio Frische Bio Eier (Fresh Organic Eggs) is a class A product from controlled organic production retailing in an XXL pack containing 18 medium size units and featuring Bio, EU Organic and KAT Kontrollierte (Controlled Alternative Animal Husbandry) logos.
Positioning claims: Ethical (animal)
Organic Poultry Wieners

| Company | Edeka Zentrale |
|---|---|
| Brand | Unsere Heimat Echt & Gut Bio (Private Label) |
| Category | Processed fish, meat and egg products |
| Sub-category | Poultry products |
| Store type | Supermarket |
| Date published | May 2022 |
| Launch type | New variety / range extension |
| Location of manufacture | Not specified |
| Price in US dollars | 3.68 ($1.84 per 100 grams) |
Unsere Heimat Echt & Gut Bio Bio-Geflügelwiener (Organic Poultry Wieners) are made with 98% regional ingredients such as turkey and chicken from Baden-Württemberg, and retails in a 200 gram pack bearing the EU Organic and Naturland logos.
Positioning claims: Not specified
Crunchy Amaranth Berry Mix

| Company | Allos Hof-Manufaktur |
|---|---|
| Brand | Tartex |
| Category | Breakfast cereals |
| Sub-category | Cold cereals |
| Store type | Supermarket |
| Date published | May 2022 |
| Launch type | Relaunch |
| Location of manufacture | Germany |
| Price in US dollars | 4.21 ($1.12 per 100 grams) |
Tartex Crunchy Amaranth Beeren Mix (Crunchy Amaranth Berry Mix) is a muesli that retails in a 375 gram sustainable pack featuring the B Corporation, EU Organic and BIO logos. The pack claims to produce few carbon emissions be made with 48% renewable resources.
Positioning claims: Ethical (environmentally friendly package and product, human, sustainable, toxin free)
Organic Virgin Rapeseed Oil

| Company | JOE & Co., Italy |
|---|---|
| Brand | Crudolio |
| Category | Sauces and seasonings |
| Sub-category | Oils |
| Store type | Supermarket |
| Date published | May 2022 |
| Launch type | New variety / range extension |
| Location of manufacture | Not specified |
| Price in US dollars | 2.63 ($2.63 per 100 millilitres) |
Crudolio Bio Rapsöl Nativ (Organic Virgin Rapeseed Oil) is a vegan product thatretails in a 100 millilitre pack bearing the VeganOK, EU Organic, Facebook and Instagram logos.
Positioning claims: Social media, vegan/no animal ingredients
Peach, Banana & Coconut Milk Organic Fruit Preparation

| Company | HiPP |
|---|---|
| Brand | HiPP |
| Category | Baby food |
| Sub-category | Baby fruit products, desserts and yogurts |
| Store type | Internet / mail order |
| Date published | May 2022 |
| Launch type | New variety / range extension |
| Location of manufacture | Not specified |
| Price in US dollars | 3.47 ($0.96 per 100 grams) |
HiPP Pfirsich Banane Kokosmilch Bio Früchtezubereitung (Peach, Banana & Coconut Milk Organic Fruit Preparation) claims to be suitable for babies from six months of age and features a finely puréed recipe with coconut milk. This gluten-free product without added sugar retails in a 360 gram pack containing four 90 gram pouches with spoons at the top, and bearing the EU Organic logo.
Positioning claims: Babies andtoddlers (0-4), carbon neutral, ethical (environmentally friendly product, sustainable), gluten free, low/no/reduced allergen, no added sugar
Organic Labelling
In Germany, organic food that meet standards set by the European Union can display the Biosiegel label, including imported products. There are also other labels that have stricter requirements. Associations that offer such labels include Bioland, Biopark (in German only), Naturland and Demeter.
The European Union and Canada have an organic equivalency agreement which allows for Canadian products to be exported to Germany and certified as organic, provided they meet organic standards as defined by the Canadian Food Inspection Agency and bear a certificate from one if its accredited certification bodies. A list of certification bodies accredited by the Canadian Food Inspection Agency can be found on the List of certification bodies under the Canada Organic Regime page.
For more information
The Canadian Trade Commissioner Service:
International Trade Commissioners can provide Canadian industry with on-the-ground expertise regarding market potential, current conditions and local business contacts, and are an excellent point of contact for export advice.
More agri-food market intelligence:
International agri-food market intelligence
Discover global agriculture and food opportunities, the complete library of Global Analysis reports, market trends and forecasts, and information on Canada's free trade agreements.
Agri-food market intelligence service
Canadian agri-food and seafood businesses can take advantage of a customized service of reports and analysis, and join our email subscription service to have the latest reports delivered directly to their inbox.
More on Canada's agriculture and agri-food sectors:
Canada's agriculture sectors
Information on the agriculture industry by sector. Data on international markets. Initiatives to support awareness of the industry in Canada. How the department engages with the industry.
For additional information on ANUGA 2023, please contact:
Ben Berry, Deputy Director
Trade Show Strategy and Delivery
Agriculture and agri-food Canada
ben.berry@agr.gc.ca
Resources
- Canadian Food Inspection Agency, European Union - Canada Organic Equivalency Arrangement (EUCOEA) overview
- Euromonitor International
- Baked Goods in Germany (December 2021)
- Chocolate Confectionery in Germany (July 2021)
- Dairy Products and Alternatives in Germany (October 2021)
- Economy, Finance, and Trade: Germany (January 2022)
- Health and Wellness in Germany (June 2022)
- Organic Packaged Food in Germany (June 2022)
- Processed Meat, Seafood and Alternatives to Meat in Germany (December 2021)
- Euro News. Germany could cope with Russian oil embargo by end of year, says minister, accessed June 28, 2022.
- Tiergarten Nürnberg. Organic Label, accessed June 28, 2022.
- Research Institute of Organic Agriculture. Organic Export Info: Germany, accessed June 28, 2022.
Health and Wellness Series – Organic packaged food trends in Germany
Global Analysis Report
Prepared by: Brendan Dwyer, Student
© His Majesty the King in Right of Canada, represented by the Minister of Agriculture and Agri-Food (2022).
Photo credits
All photographs reproduced in this publication are used by permission of the rights holders.
All images, unless otherwise noted, are copyright His Majesty the King in Right of Canada.
To join our distribution list or to suggest additional report topics or markets, please contact:
Agriculture and Agri-Food Canada, Global Analysis1341 Baseline Rd, Tower 5, 3rd floor
Ottawa ON K1A 0C5
Canada
Email: aafc.mas-sam.aac@agr.gc.ca
The Government of Canada has prepared this report based on primary and secondary sources of information. Although every effort has been made to ensure that the information is accurate, Agriculture and Agri-Food Canada (AAFC) assumes no liability for any actions taken based on the information contained herein.
Reproduction or redistribution of this document, in whole or in part, must include acknowledgement of agriculture and agri-food Canada as the owner of the copyright in the document, through a reference citing AAFC, the title of the document and the year. Where the reproduction or redistribution includes data from this document, it must also include an acknowledgement of the specific data source(s), as noted in this document.
Agriculture and Agri-Food Canada provides this document and other report services to agriculture and food industry clients free of charge.