

Note: This report includes forecasting data that is based on baseline historical data.
Executive summary
The Dutch economy is currently going through an economic rebound from the coronavirus pandemic, and the market for organic packaged food is growing fast.
As a result of the pandemic, Dutch consumers have become increasingly concerned with health and wellness, a sector that was already gaining traction prior to the pandemic. Consumption of organic food in the Netherlands is generally motivated by a consumer perception of the organic products being healthier, more sustainable and better for the environment.
The organic packaged food market in the Netherlands was valued at US$1.1 billion in 2021, making it the fifth largest in Europe and eighth largest in the world. Retail value sales of the Dutch organic packaged food grew at a compound annual growth rate (CAGR) of 7.7% from 2016 to 2021 and are expected to expand at a CAGR of 6.4% between 2021 and 2026. The forecast growth rate (2021 to 2026) is slightly behind the global growth rate at a CAGR of 6.7%. This market is expected to reach the total retail sales of US$1.5 billion by 2026.
In 2021, the largest subcategory of organic packaged food was organic dairy, with US$ 420.8 million in sales, followed by organic bread with US$151.2 million in sales, and chilled processed meat and seafood with US$61.4 million in sales. From 2021 to 2026, dairy is expected to see the fastest growth, growing at a CAGR of 8.0%.
The Dutch market for organic packaged food had a diverse array of players in 2021, with the largest holding a 6.7% market share. The most important outlet for the distribution of organic packaged food in the Netherlands was supermarkets, which were responsible for approximately half of sales in 2021.
Market overview
The Dutch economy is advanced and highly developed, with the Netherlands boasting a gross domestic product (GDP) per capita of US$58,261.8 in 2021. The Dutch economy suffered a contraction in 2020, however it has since fully rebounded. The economy has benefitted from recovering global demand, with exports accounting for 67.0% of the GDP of the Netherlands in 2021, far above the regional average. (Euromonitor, 2022)
The economy continues to face uncertainty about the ongoing coronavirus pandemic. The Netherlands is also currently contending with unexpectedly strong inflation and is expected to see a slightly lower GDP growth rate than the regional average. (Euromonitor, 2022)
The Netherlands is crucial to European maritime trade, and the Dutch port of Rotterdam is the largest in Europe. In 2018, Rotterdam alone handled 441 million tonnes of freight, more than twice as much as the next largest European port and more than a tenth of all freight handled by ports in the European Union for that year. (Eurostat, April 2020). In 2020, the port saw 7.7 million tonnes of inbound agribulk goods. (Port of Rotterdam, accessed July 2022).
In 2021, the Netherlands had a population density of 519.0 persons per square kilometer. (Euromonitor, 2022) Despite this making the Netherlands one of the most densely populated countries in the world, the Netherlands has a strong agricultural sector and is the second largest food exporter in the world (The Netherlands and You, February 2021). In 2021, 4% of total arable land was used for the production of organic goods, lower than the EU average of 9%. Dutch organic production is primarily for exports rather than for domestic consumption. (USDA, 2021)
In 2021, the Netherlands was the eighth largest market for organic packaged food in the world and the fifth largest market in Europe. Retail sales of organic packaged food in the Netherlands totalled US$1.1 billion, accounting for 2.2% of global sales in 2021. Retail value sales of the organic packaged food grew at a CAGR of 7.7% from 2016 to 2021, which is slightly behind the global growth rate of 7.8%. The total retail sales are expected to reach US$1.5 billion by 2026, after growing at a CAGR of 6.4% from 2021 to 2026. In 2026, the Netherlands is expected to remain as the eighth largest market in the world.
The overall organic and non-organic packaged food market in the Netherlands has been affected by the pandemic, with consumers increasing their consumption of staple food and cooking ingredients. According to Euromonitor (2022), categories that benefitted strongly in this context included rice and pasta, processed meat, seafood, fruit, and vegetables, breakfast cereals, soup, edible oils and sauces, edible oils and sauces, dressings and condiments, butter and spreads, cheese and drinking milk products. The pandemic has also seen Dutch consumers shift more towards food perceived as healthy, with organic products gaining more traction, alongside vegetarian, vegan, reduced sugar or fat options.
| Country | 2016 | 2021 | CAGR % 2016-2021 | 2022 | 2026 | CAGR % 2021-2026 |
|---|---|---|---|---|---|---|
| World | 34,933.6 | 50,815.4 | 7.8 | 54,475.1 | 70,304.2 | 6.7 |
| United States | 15,285.4 | 21,260.5 | 6.8 | 22,850.2 | 29,021.4 | 6.4 |
| Germany | 3,838.7 | 5,176.7 | 6.2 | 5,412.3 | 6,322.0 | 4.1 |
| China | 2,550.0 | 4,732.5 | 13.2 | 5,234.5 | 7,525.1 | 9.7 |
| France | 2,652.3 | 4,707.6 | 12.2 | 5,136.3 | 7,015.9 | 8.3 |
| Italy | 1,222.0 | 1,761.1 | 7.6 | 1,880.5 | 2,414.0 | 6.5 |
| United Kingdom | 1,392.1 | 1,749.2 | 4.7 | 1,810.7 | 2,124.1 | 4.0 |
| Canada | 867.5 | 1,237.7 | 7.4 | 1,360.7 | 1,857.9 | 8.5 |
| Netherlands | 760.4 | 1,100.3 | 7.7 | 1,159.7 | 1,501.7 | 6.4 |
| Denmark | 699.7 | 1,063.7 | 8.7 | 1,106.4 | 1,320.5 | 4.4 |
| Sweden | 673.3 | 905.0 | 6.1 | 943.8 | 1,168.0 | 5.2 |
|
Source: Euromonitor International, 2022 *CAGR: Compound annual growth rate Historic data: 2016-2021 Forecast data: 2022-2026 |
||||||
Consumer characteristics
In 2021, total retail sales of health and wellness packaged sales in the Netherlands were US$6.5 billion. US$2.6 billion in sales were naturally healthy packaged food, or 39.9% of the total health and wellness packaged food market, and organic packaged food saw US$1.1 billion in sales, accounting for 16.9% of the health and wellness packaged food market. 'Free from' packaged food was the smallest category, however, saw by far the fastest growth from 2016 to 2021, and is forecast to see the fastest growth from 2021 to 2026. Organic packaged food saw the second fastest growth from 2016 to 2021 and are forecast to see the second fastest growth from 2021 to 2026.
In the Netherlands, consumption of organic food is largely motivated by concerns regarding health and the environment, concerns which are amplified among younger age brackets. Organic food is also relatively popular among those with higher incomes, as in the Netherlands organic food is on average 50% more expensive than non-organic food (USDA, 2021).
The pandemic has also increased consumer interest in products perceived as healthier, such as organic food. Supported by the increasing consumer interest on healthier food options, organic packaged food sales in the Netherlands saw higher growth at 9.6% from 2019 to 2020 and organic food has gained traction among younger consumers.
The Dutch consumers more reliant on organic food tend to be motivated mostly by the environment and health concerns, and although not very price sensitive, also tend to buy locally produced food. These consumers also seek out specialty organic shops rather than conventional retail outlets. More casual consumers of organic food, including people from affluent income brackets and younger age brackets, tend to be more motivated by taste and health claims, and are often more price sensitive. These consumers tend to purchase food through more conventional outlets. Although these consumers place less of a priority on locally produced food, the substantial overlap between those who buy organic and those who buy local is a significant obstacle to those seeking to export organic food to the Netherlands. (USDA, 2021).
| Category | 2016 | 2021 | CAGR % 2016-2021 | 2022 | 2026 | CAGR % 2021-2026 |
|---|---|---|---|---|---|---|
| Health and Wellness Packaged Food Total | 5,267.5 | 6,496.9 | 4.3 | 6,862.3 | 8,681.6 | 6.0 |
| Better For You | 1,032.8 | 1,092.7 | 1.1 | 1,123.0 | 1,292.6 | 3.4 |
| Fortified/ Functional | 1,029.2 | 982.4 | −0.9 | 1,011.1 | 1,131.9 | 2.9 |
| Free From | 337.1 | 728.7 | 16.7 | 860.4 | 1,496.4 | 15.5 |
| Naturally Healthy | 2,108.0 | 2,592.8 | 4.2 | 2,708.1 | 3,259.0 | 4.7 |
| Organic | 760.4 | 1,100.3 | 7.7 | 1,159.7 | 1,501.7 | 6.4 |
|
Source: Euromonitor International, 2016 *CAGR: Compound Annual Growth Rate Historical data: 2016-2021 Forecast data: 2022-2026 |
||||||
Market size
In 2021, the total retail sales of organic packaged food were US$1.1 billion, expanded by a CARG of 7.7% between 2016 and 2021. The largest subsector in 2021 was organic dairy, with US$420.8 million in retail sales and accounting for 38.2% of the total organic packaged food sales. Other large categories included organic bread (US$151.2 million, 13.7% of the total retail value sales), organic chilled processed meat and seafood (US$61.4 million, 5.6% of the total retail sales) and organic edible oil (US$53.5 million, 4.9% of the total retail sales).
Organic dairy saw the largest growth in absolute value terms and second fastest growth at a CAGR of 9.7% from 2016 to 2021, whereas organic baby food experienced the fastest growth at a CAGR of 13.3%. From 2016 to 2021, retail sales of organic dairy saw their value rise by US$155.9 million, accounting for 45.9% of the total retail value sales increase of the organic packaged food over the historic review period (2016-2021).
From 2021 to 2026, the retail sales of the organic packaged food are expected to grow at a CAGR of 6.4%, reaching US$1.5 billion by 2026. Organic dairy is forecast to have the fastest growth, at a CAGR of 8.0%, reaching the total retail sales of US$619.2 million by 2026. By 2026, organic dairy is expected to make up 41.2% of the organic packaged food market, and is expected to rise in value by US$198.4 million between 2021 and 2026. The expansion of the organic packaged food market in the Netherlands during the forecast period (2021-2026) will be mainly supported by an increase in the retail value sales of organic dairy. The sub-category expected to see the second fastest growth from 2021 to 2026 is edible oils, which is expected to grow at a CAGR of 7.0% and to be valued at US$75.1 million by 2026.
| Category | 2016 | 2017 | 2018 | 2019 | 2020 | 2021 |
|---|---|---|---|---|---|---|
| Organic Packaged Food Total | 760.4 | 825.4 | 892.2 | 967.4 | 1,060.7 | 1,100.3 |
| Baby Food | 26.3 | 32.2 | 36.8 | 40.5 | 45.2 | 49.2 |
| Bread | 104.7 | 112.5 | 122.4 | 136.9 | 152.9 | 151.2 |
| Breakfast Cereals | 28.7 | 29.9 | 31.0 | 32.3 | 34.8 | 34.9 |
| Chilled Processed Meat and Seafood | 50.8 | 53.2 | 55.5 | 58.1 | 60.7 | 61.4 |
| Confectionery | 34.9 | 37.7 | 40.5 | 43.1 | 46.6 | 49.7 |
| Dairy | 264.9 | 294.3 | 325.2 | 358.1 | 391.5 | 420.8 |
| Edible Oil | 40.9 | 42.0 | 42.9 | 46.7 | 52.4 | 53.5 |
| Frozen Meat, Seafood, Fruit and Vegetables | 15.0 | 16.5 | 18.2 | 19.7 | 21.9 | 22.1 |
| Ice Cream | 7.5 | 8.0 | 8.5 | 8.9 | 9.3 | 9.6 |
| Ready Meals | 9.3 | 9.6 | 10.0 | 10.5 | 11.2 | 11.2 |
| Rice, Pasta and Noodles | 34.0 | 35.5 | 37.0 | 38.4 | 44.0 | 41.8 |
| Sauces, Dressings and Condiments | 16.0 | 18.0 | 19.9 | 22.0 | 25.0 | 24.2 |
| Savoury Snacks | 39.7 | 41.5 | 43.3 | 45.1 | 48.7 | 51.7 |
| Shelf Stable Meat, Seafood, Fruit and Vegetables | 15.9 | 17.2 | 18.4 | 19.6 | 21.6 | 21.7 |
| Soup | 14.7 | 16.0 | 17.0 | 18.0 | 19.9 | 19.3 |
| Spreads | 22.1 | 23.4 | 24.7 | 25.9 | 27.7 | 27.5 |
| Sweet Biscuits, Snack Bars and Fruit Snacks | 35.0 | 37.9 | 40.9 | 43.6 | 47.3 | 50.5 |
| Source: Euromonitor International, 2022 | ||||||
| Category | Annual growth % 2020-2021 | CAGR* % 2016-2021 | Total growth % 2016-2021 |
|---|---|---|---|
| Organic Packaged Food Total | 3.7 | 7.7 | 44.7 |
| Baby Food | 8.8 | 13.3 | 87.1 |
| Bread | −1.1 | 7.6 | 44.4 |
| Breakfast Cereals | 0.3 | 4.0 | 21.6 |
| Chilled Processed Meat and Seafood | 1.2 | 3.9 | 20.9 |
| Confectionery | 6.7 | 7.3 | 42.4 |
| Dairy | 7.5 | 9.7 | 58.9 |
| Edible Oil | 2.1 | 5.5 | 30.8 |
| Frozen Meat, Seafood, Fruit and Vegetables | 0.9 | 8.1 | 47.3 |
| Ice Cream | 3.2 | 5.1 | 28.0 |
| Ready Meals | 0.0 | 3.8 | 20.4 |
| Rice, Pasta and Noodles | −5.0 | 4.2 | 22.9 |
| Sauces, Dressings and Condiments | −3.2 | 8.6 | 51.3 |
| Savoury Snacks | 6.2 | 5.4 | 30.2 |
| Shelf Stable Meat, Seafood, Fruit and Vegetables | 0.5 | 6.4 | 36.5 |
| Soup | −3.0 | 5.6 | 31.3 |
| Spreads | −0.7 | 4.5 | 24.4 |
| Sweet Biscuits, Snack Bars and Fruit Snacks | 6.8 | 7.6 | 44.3 |
|
Source: Euromonitor International, 2022 *CAGR: Compound annual growth rate |
|||
| Category | Total packaged food | Organic packaged food | Share of organic packaged food (%) |
|---|---|---|---|
| Baby Food | 280.3 | 49.2 | 17.6 |
| Bread | 2,572.5 | 151.2 | 5.9 |
| Breakfast Cereals | 270.0 | 34.9 | 12.9 |
| Chilled Processed Meat and Seafood | 1,965.8 | 61.4 | 3.1 |
| Confectionery | 2,113.6 | 49.7 | 2.4 |
| Dairy | 6,487.5 | 420.8 | 6.5 |
| Edible Oil | 278.1 | 53.5 | 19.2 |
| Frozen Meat, Seafood, Fruit and Vegetables | 325.6 | 22.1 | 6.8 |
| Ice Cream | 594.2 | 9.6 | 1.6 |
| Ready Meals | 1,698.1 | 11.2 | 0.7 |
| Rice, Pasta and Noodles | 593.6 | 41.8 | 7.0 |
| Sauces, Dressings and Condiments | 938.2 | 24.2 | 2.6 |
| Savoury Snacks | 1,376.0 | 51.7 | 3.8 |
| Shelf Stable Meat, Seafood, Fruit and Vegetables | 685.9 | 21.7 | 3.2 |
| Soup | 328.4 | 19.3 | 5.9 |
| Spreads | 300.1 | 27.5 | 9.2 |
| Sweet Biscuits, Snack Bars and Fruit Snacks | 956.9 | 50.5 | 5.3 |
|
Source: Euromonitor International, 2022 |
|||
| Category | 2022 | 2023 | 2024 | 2025 | 2026 |
|---|---|---|---|---|---|
| Organic Packaged Food Total | 1,159.8 | 1,224.4 | 1,305.2 | 1,399.1 | 1,502.0 |
| Baby Food | 52.9 | 56.4 | 59.5 | 63.6 | 68.1 |
| Bread | 152.7 | 156.1 | 167.1 | 180.7 | 195.0 |
| Breakfast Cereals | 35.8 | 37.0 | 39.1 | 41.8 | 44.6 |
| Chilled Processed Meat and Seafood | 63.4 | 65.7 | 69.1 | 72.9 | 76.8 |
| Confectionery | 53.0 | 56.3 | 59.5 | 62.6 | 66.1 |
| Dairy | 454.8 | 490.4 | 527.6 | 570.1 | 619.2 |
| Edible Oil | 56.7 | 60.3 | 64.6 | 69.8 | 75.1 |
| Frozen Meat, Seafood, Fruit and Vegetables | 22.8 | 23.5 | 25.2 | 27.4 | 29.8 |
| Ice Cream | 10.0 | 10.4 | 10.8 | 11.1 | 11.5 |
| Ready Meals | 11.4 | 11.8 | 12.3 | 12.9 | 13.5 |
| Rice, Pasta and Noodles | 42.9 | 44.4 | 46.3 | 48.5 | 50.9 |
| Sauces, Dressings and Condiments | 24.4 | 25.0 | 26.9 | 29.4 | 31.9 |
| Savoury Snacks | 55.0 | 57.5 | 59.6 | 61.3 | 63.1 |
| Shelf Stable Meat, Seafood, Fruit and Vegetables | 22.4 | 23.0 | 24.4 | 26.1 | 27.6 |
| Soup | 19.5 | 20.0 | 21.2 | 22.8 | 24.3 |
| Spreads | 28.0 | 28.8 | 30.4 | 32.5 | 34.6 |
| Sweet Biscuits, Snack Bars and Fruit Snacks | 54.1 | 57.8 | 61.6 | 65.6 | 69.9 |
| Source: Euromonitor International, 2022 | |||||
| Category | Annual growth % 2021-2022 | CAGR* % 2021-2026 | Total growth % 2021-2026 |
|---|---|---|---|
| Organic Packaged Food Total | 5.4 | 6.4 | 36.5 |
| Baby Food | 7.5 | 6.7 | 38.4 |
| Bread | 1.0 | 5.2 | 29.0 |
| Breakfast Cereals | 2.6 | 5.0 | 27.8 |
| Chilled Processed Meat and Seafood | 3.3 | 4.6 | 25.1 |
| Confectionery | 6.6 | 5.9 | 33.0 |
| Dairy | 8.1 | 8.0 | 47.1 |
| Edible Oil | 6.0 | 7.0 | 40.4 |
| Frozen Meat, Seafood, Fruit and Vegetables | 3.2 | 6.2 | 34.8 |
| Ice Cream | 4.2 | 3.7 | 19.8 |
| Ready Meals | 1.8 | 3.8 | 20.5 |
| Rice, Pasta and Noodles | 2.6 | 4.0 | 21.8 |
| Sauces, Dressings and Condiments | 0.8 | 5.7 | 31.8 |
| Savoury Snacks | 6.4 | 4.1 | 22.1 |
| Shelf Stable Meat, Seafood, Fruit and Vegetables | 3.2 | 4.9 | 27.2 |
| Soup | 1.0 | 4.7 | 25.9 |
| Spreads | 1.8 | 4.7 | 25.8 |
| Sweet Biscuits, Snack Bars and Fruit Snacks | 7.1 | 6.7 | 38.4 |
|
Source: Euromonitor International, 2022 *CAGR: Compound annual growth rate |
|||
Competition
The competitive landscape for organic packaged food in the Netherlands was relatively fragmented, with most sub-categories having a diverse array of players. For the total organic packaged food market, the company with the largest market share was Arla Foods Amba (Brand name: Arla) with a 6.7% market share in 2021. This status was achieved by being the largest player in the Netherlands' lucrative dairy market, in which they had a 16.8% market share, although they did also have a presence in the much smaller organic ice cream market. The second largest player, Stichting Merkarikel Bio+ (Brand name: Bio+), had a 5.0% market share in 2021, and a significant presence in a number of organic packaged food sub-categories, including dairy, chilled processed meat and seafood, and edible oils, among others. Udea BV (Brand name: Molenaartje) also had involvement in a diverse array of sub-sectors, while Weeribben Zuivel BV (Brand name: Zuiver Zuivel) was only a minor player in the organic dairy market, in which they were the second largest player and held an 8.8% market share. Royal FrieslandCampina NV (Brand name: Campina) also saw most of its sales in the organic dairy sector, although they also have a small presence in the market for organic savoury snacks.
Categories that were relatively consolidated included organic savoury snacks with the largest player, Udea BV (Brand name: Molenaartje) with a 30.3% market share, followed by FZ Organic Food BV (Brand name: Trafo) with a 28.5% market share. Organic baby food's largest player, Hain Celestial Group Inc (Brand Name: Ella's Kitchen) represented 29.9% of the organic baby food retail sales in 2021, followed by Joannusmolen BV (Brand Name: Biobim) with a 13.6% market share. The relatively small markets for organic soup and organic ice cream were also in the hands of relatively fewer players. Organic soup's largest player, Unilever Group (Brand Name: Unox), held a market share of 30.8%, while organic ice cream's largest player, Arla Foods Amba (Brand Name: Arla), held a market share of 33.1%.
| Company | Retail sales (US$ millions) | Market Share (%) |
|---|---|---|
| Arla Foods Amba | 73.7 | 6.7 |
| Stichting Merkartikel Bio+ | 54.8 | 5.0 |
| Udea BV | 37.7 | 3.4 |
| Weerribben Zuivel BV | 37.1 | 3.4 |
| Royal FrieslandCampina NV | 36.3 | 3.3 |
| Hain Celestial Group Inc, The | 17.9 | 1.6 |
| FZ Organic Food BV | 16.4 | 1.5 |
| Biorganic BV | 14.9 | 1.4 |
| Ecotone | 13.8 | 1.3 |
| Bio Kaas BV | 13.0 | 1.2 |
| Private Label | 516.8 | 47.0 |
| Artisanal | 16.2 | 1.5 |
| Others | 251.7 | 22.7 |
| Source: Euromonitor International, 2022 | ||
Distribution
In 2021, distribution of the organic packaged food in the Netherlands was dominated by store-based retailers, which accounted for 88.9% of the retail value sales. Supermarkets were the largest channel, with a 49.5% share of the organic packaged food market. Discounters were the next largest channel, accounting for 14.4% of the retail value sales and independent small grocers held 10.5% of the retail market.
E-commerce accounted for 10.7% of the retail sales of the organic packaged food in 2021. However, in contrast to peer countries in the European Union (EU), the share of sales held by e-commerce has not seen substantial growth over the last five years, with sales of the organic packaged food through e-commerce merely keeping pace with other distribution channels. This stagnation in the e-commerce channel occurred despite solid growth in e-commerce sales of food and drink during the 2016-2021 period.
| Outlet Type | 2016 | 2021 | ||
|---|---|---|---|---|
| Actual | Share % | Actual | Share % | |
| Total | 760.4 | 1,100.3 | ||
| Store-Based Retailing | 674.9 | 88.7 | 978.3 | 88.9 |
| Grocery Retailers | 655.1 | 86.1 | 947.5 | 86.1 |
| Modern Grocery Retailers | 552.3 | 72.6 | 817.0 | 74.3 |
| Convenience Stores | 46.4 | 6.1 | 69.8 | 6.3 |
| Discounters | 105.3 | 13.9 | 158.4 | 14.4 |
| Forecourt Retailers | ||||
| Hypermarkets | 28.0 | 3.7 | 44.0 | 4.0 |
| Supermarkets | 372.6 | 49.0 | 544.8 | 49.5 |
| Traditional Grocery Retailers | 102.8 | 13.5 | 130.5 | 11.9 |
| Food/drink/tobacco specialists | ||||
| Independent Small Grocers | 90.5 | 11.9 | 115.5 | 10.5 |
| Other Grocery Retailers | 12.3 | 1.6 | 14.9 | 1.4 |
| Non-Grocery Specialists | 19.8 | 2.6 | 30.8 | 2.8 |
| Non-Store Retailing | 85.5 | 11.3 | 122.0 | 11.1 |
| Vending | ||||
| Home Shopping | ||||
| E-Commerce | 80.2 | 10.6 | 117.7 | 10.7 |
| Direct Selling | 5.3 | 0.7 | 4.3 | 0.4 |
|
Source: Euromonitor International, 2022 Note: Actuals for some of sub-outlet types are unavailable. As such, the total of certain sub-categories may not equal to the total of their super-category. |
||||
Subsector growth
Organic baby food
The organic baby food market in the Netherlands had a value of US$49.2 million in 2021. From 2016 to 2021, growth was led by milk formula, which is also expected to see the fastest growth from 2021 to 2026, as well as in the 2021-2022 year. Prepared baby food is the largest subcategory and is expected to remain so in 2026. The largest player in the organic baby food market held a 29.9% market share.
| Category | 2016 | 2017 | 2018 | 2019 | 2020 | 2021 |
|---|---|---|---|---|---|---|
| Organic Baby Food Total | 26.4 | 32.1 | 36.8 | 40.5 | 45.2 | 49.2 |
| Milk Formula | 2.6 | 2.9 | 3.4 | 4.2 | 6.0 | 7.6 |
| Dried Baby Food | 2.3 | 2.5 | 2.8 | 3.1 | 3.4 | 3.7 |
| Prepared Baby Food | 15.7 | 18.7 | 20.5 | 21.5 | 22.8 | 23.9 |
| Other Baby Food | 5.8 | 8.0 | 10.1 | 11.7 | 13.0 | 14.0 |
| Source: Euromonitor International, 2022 | ||||||
| Category | Annual growth % 2020-2021 | CAGR* % 2016-2021 | Total growth % 2016-2021 |
|---|---|---|---|
| Organic Baby Food Total | 8.8 | 13.3 | 86.4 |
| Milk Formula | 26.7 | 23.9 | 192.3 |
| Dried Baby Food | 8.8 | 10.0 | 60.9 |
| Prepared Baby Food | 4.8 | 8.8 | 52.2 |
| Other Baby Food | 7.7 | 19.3 | 141.4 |
|
Source: Euromonitor International, 2022 *CAGR: Compound annual growth rate |
|||
| Company | Retail sales (US$ millions) | Market share (%) |
|---|---|---|
| Hain Celestial Group Inc, The | 14.7 | 29.9 |
| Joannusmolen BV | 6.7 | 13.6 |
| Hipp GmbH & Co Vertrieb KG | 4.9 | 9.9 |
| Ecotone | 4.3 | 8.7 |
| Love My Veggies BV | 1.9 | 3.9 |
| Private Label | 6.2 | 12.6 |
| Others | 10.5 | 21.3 |
| Source: Euromonitor International, 2022 | ||
| Category | 2022 | 2023 | 2024 | 2025 | 2026 |
|---|---|---|---|---|---|
| Organic Baby Food Total | 52.9 | 56.4 | 59.6 | 63.7 | 68.0 |
| Milk Formula | 8.6 | 9.5 | 10.4 | 11.8 | 13.2 |
| Dried Baby Food | 4.0 | 4.4 | 4.7 | 5.2 | 5.6 |
| Prepared Baby Food | 25.2 | 26.4 | 27.5 | 28.7 | 30.1 |
| Other Baby Food | 15.1 | 16.1 | 17.0 | 18.0 | 19.1 |
| Source: Euromonitor International, 2022 | |||||
| Category | Annual growth % 2021-2022 | CAGR* % 2021-2026 | Total growth % 2021-2026 |
|---|---|---|---|
| Organic Baby Food Total | 7.5 | 6.7 | 38.2 |
| Milk Formula | 13.2 | 11.7 | 73.7 |
| Baby Food | 8.1 | 8.6 | 51.4 |
| Prepared Baby Food | 5.4 | 4.7 | 25.9 |
| Other Baby Food | 7.9 | 6.4 | 36.4 |
|
Source: Euromonitor International, 2022 *CAGR: Compound annual growth rate |
|||
Organic bread and breakfast cereals
Organic bread and organic breakfast cereals are expected to grow at a CAGR of 5.2% and 5.0% respectively, from 2021 to 2026, although both will experience slower growth in the 2021-2022 year. The bread category was dominated by private labels, while organic breakfast cereals were held by a number of players, with the largest holding a 13.7% market share.
| Category | 2016 | 2017 | 2018 | 2019 | 2020 | 2021 |
|---|---|---|---|---|---|---|
| Organic Bread | 104.7 | 112.5 | 122.4 | 136.9 | 152.9 | 151.2 |
| Organic Breakfast Cereals | 28.7 | 29.9 | 31.0 | 32.3 | 34.8 | 34.9 |
| Source: Euromonitor International, 2022 | ||||||
| Category | Annual growth % 2020-2021 | CAGR* % 2016-2021 | Total growth % 2016-2021 |
|---|---|---|---|
| Organic Bread | −1.1 | 7.6 | 44.4 |
| Organic Breakfast Cereals | 0.3 | 4.0 | 21.6 |
|
Source: Euromonitor International, 2022 *CAGR: Compound annual growth rate |
|||
| Company | Retail sales (US$ millions) | Market share (%) |
|---|---|---|
| Private Label | 110.8 | 73.3 |
| Artisanal | 16.2 | 10.7 |
| Others | 24.2 | 16.0 |
| Source: Euromonitor International, 2022 | ||
| Company | Retail sales (US$ millions) | Market share (%) |
|---|---|---|
| Biorganic BV | 4.8 | 13.7 |
| Stichting Merkartikel Bio+ | 4.4 | 12.6 |
| Udea BV | 3.5 | 10.0 |
| de Smaakspecialist BV | 2.9 | 8.4 |
| Private Label | 5.6 | 16.1 |
| Others | 13.7 | 39.1 |
| Source: Euromonitor International, 2022 | ||
| Category | 2022 | 2023 | 2024 | 2025 | 2026 |
|---|---|---|---|---|---|
| Organic Bread | 152.7 | 156.1 | 167.1 | 180.7 | 195.0 |
| Organic Breakfast Cereals | 35.8 | 37.0 | 39.1 | 41.8 | 44.6 |
| Source: Euromonitor International, 2022 | |||||
| Category | Annual growth % 2021-2022 | CAGR* % 2021-2026 | Total growth % 2021-2026 |
|---|---|---|---|
| Organic Bread | 1.0 | 5.2 | 29.0 |
| Organic Breakfast Cereals | 2.6 | 5.0 | 27.8 |
|
Source: Euromonitor International, 2022 *CAGR: Compound annual growth rate |
|||
Organic cooking ingredients and meals
In the organic cooking ingredients and meals category, growth was led by organic edible oils from 2016 to 2021 and is expected to be lead by organic edible oils once again from 2021 to 2026. Growth in the 2021-2022 period is expected to be fastest for organic edible oils, with particularly strong growth for organic olive oil.
| Category | 2016 | 2017 | 2018 | 2019 | 2020 | 2021 |
|---|---|---|---|---|---|---|
| Organic Edible Oil Total | 40.9 | 42 | 42.9 | 46.8 | 52.4 | 53.5 |
| Olive Oil | 9.4 | 10.4 | 11.1 | 13.6 | 17.0 | 16.9 |
| Vegetable and Seed Oil | 31.5 | 31.6 | 31.8 | 33.2 | 35.4 | 36.6 |
| Organic Ready Meals | 9.3 | 9.6 | 10.0 | 10.5 | 11.2 | 11.2 |
| Organic Sauces, Dressings and Condiments | 16.0 | 18.0 | 19.9 | 22.0 | 25.0 | 24.2 |
| Organic Soup | 14.7 | 16.0 | 17.0 | 18.0 | 19.9 | 19.3 |
| Organic Spreads Total | 22.1 | 23.4 | 24.7 | 25.8 | 27.6 | 27.5 |
| Spreads | 17.3 | 18.2 | 18.9 | 19.6 | 20.7 | 20.8 |
| Honey | 4.8 | 5.2 | 5.8 | 6.2 | 6.9 | 6.7 |
| Source: Euromonitor International, 2022 | ||||||
| Category | Annual growth % 2020-2021 | CAGR* % 2016-2021 | Total growth % 2016-2021 |
|---|---|---|---|
| Organic Edible Oil Total | 2.1 | 5.5 | 30.8 |
| Olive Oil | −0.6 | 12.4 | 79.8 |
| Vegetable and Seed Oil | 3.4 | 3.0 | 16.2 |
| Organic Ready Meals | 0.0 | 3.8 | 20.4 |
| Organic Sauces, Dressings and Condiments | −3.0 | 5.6 | 31.3 |
| Organic Soup | −3.0 | 5.6 | 31.3 |
| Organic Spreads Total | −0.7 | 4.5 | 24.4 |
| Spreads | 0.5 | 3.8 | 20.2 |
| Honey | −2.9 | 6.9 | 39.6 |
|
Source: Euromonitor International, 2022 *CAGR: Compound annual growth rate |
|||
| Company | Retail sales (US$ millions) | Market share (%) |
|---|---|---|
| Biorganic BV | 4.8 | 9.0 |
| De Burg Groep BV | 1.9 | 3.6 |
| Stichting Merkartikel Bio+ | 1.4 | 2.5 |
| de Smaakspecialist BV | 1.0 | 1.8 |
| Deoleo SA | 0.9 | 1.6 |
| Private Label | 35.9 | 67.1 |
| Others | 7.6 | 14.4 |
| Source: Euromonitor International, 2022 | ||
| Company | Retail sales (US$ millions) | Market share (%) |
|---|---|---|
| Marqt BV | 2.1 | 18.5 |
| Bioline Europe NV | 0.7 | 5.8 |
| Stichting Merkartikel Bio+ | 0.5 | 4.7 |
| Private Label | 7.2 | 64.0 |
| Others | 0.8 | 7.0 |
| Source: Euromonitor International, 2022 | ||
| Company | Retail sales (US$ millions) | Market share (%) |
|---|---|---|
| KleinsteSoepFabriek BV | 3.7 | 15.4 |
| Biorganic BV | 2.0 | 8.3 |
| Stichting Merkartikel Bio+ | 1.7 | 7.2 |
| BioBandits BV | 0.7 | 3.0 |
| Hain Celestial Group Inc, The | 0.7 | 2.9 |
| Private Label | 13.3 | 55.0 |
| Others | 2.1 | 8.2 |
| Source: Euromonitor International, 2022 | ||
| Company | Retail sales (US$ millions) | Market share (%) |
|---|---|---|
| Unilever Group | 5.9 | 30.8 |
| Stichting Merkartikel Bio+ | 2.4 | 12.5 |
| KleinsteSoepFabriek BV | 1.3 | 6.7 |
| Hain Celestial Group Inc, The | 0.5 | 2.5 |
| Le Bonheur est dans le Pot SARL | 0.2 | 1.0 |
| Private Label | 8.5 | 43.9 |
| Others | 0.5 | 2.7 |
| Source: Euromonitor International, 2022 | ||
| Company | Retail sales (US$ millions) | Market share (%) |
|---|---|---|
| Stichting Merkartikel Bio+ | 3.5 | 12.6 |
| Rigoni di Asiago Srl | 3.1 | 11.4 |
| Udea BV | 2.1 | 7.6 |
| Biorganic BV | 2.1 | 7.6 |
| Ecotone | 0.7 | 2.5 |
| Private Label | 13.9 | 50.6 |
| Source: Euromonitor International, 2022 | ||
| Category | 2022 | 2023 | 2024 | 2025 | 2026 |
|---|---|---|---|---|---|
| Organic Edible Oil Total | 56.7 | 60.3 | 64.6 | 69.8 | 75.1 |
| Olive Oil | 18.1 | 19.6 | 21.3 | 23.6 | 26.0 |
| Vegetable and Seed Oil | 38.6 | 40.7 | 43.3 | 46.2 | 49.1 |
| Organic Ready Meals | 11.4 | 11.8 | 12.3 | 12.9 | 13.5 |
| Organic Sauces, Dressings and Condiments | 24.4 | 25.0 | 26.9 | 29.4 | 31.9 |
| Organic Soup | 19.5 | 20.0 | 21.2 | 22.8 | 24.3 |
| Organic Spreads Total | 28.0 | 28.8 | 30.4 | 32.5 | 34.6 |
| Spreads | 21.2 | 21.9 | 23.0 | 24.5 | 26.0 |
| Honey | 6.8 | 6.9 | 7.4 | 8.0 | 8.6 |
| Source: Euromonitor International, 2022 | |||||
| Category | Annual growth % 2021-2022 | CAGR* % 2021-2026 | Total growth % 2021-2026 |
|---|---|---|---|
| Organic Edible Oil Total | 6.0 | 7.0 | 40.4 |
| Olive Oil | 7.1 | 9.0 | 53.8 |
| Vegetable and Seed Oil | 5.5 | 6.1 | 34.2 |
| Organic Ready Meals | 1.8 | 3.8 | 20.5 |
| Organic Sauces, Dressings and Condiments | 0.8 | 5.7 | 31.8 |
| Organic Soup | 1.0 | 4.7 | 25.9 |
| Organic Spreads Total | 1.8 | 4.7 | 25.8 |
| Spreads | 1.9 | 4.6 | 25.0 |
| Honey | 1.5 | 5.1 | 28.4 |
|
Source: Euromonitor International, 2022 *CAGR: Compound annual growth rate |
|||
Organic dairy
The organic dairy market was the largest category of organic packaged food in the Netherlands in 2021, with US$ 420.8 million in total retail sales in 2021. The largest sub-category was cheese at US$130.1 million, followed closely by milk at US$126.5 million. Fromage Frais and Quark is expected to see the fastest growth from 2021 to 2026, as well as the fastest growth in 2021-2022. Cheese is expected to see the second fastest growth over both periods, reaching US$ 212.5 million in 2026.
| Category | 2016 | 2017 | 2018 | 2019 | 2020 | 2021 |
|---|---|---|---|---|---|---|
| Organic Dairy Total | 264.9 | 294.3 | 325.2 | 358.1 | 391.5 | 420.8 |
| Butter and Spreads | 23.5 | 31.7 | 36.9 | 41.6 | 44.9 | 47.2 |
| Cheese | 76.0 | 85.9 | 95.6 | 107.0 | 118.7 | 130.1 |
| Cream | 4.9 | 5.3 | 5.7 | 6.1 | 6.6 | 6.9 |
| Flavoured Milk Drinks | 3.5 | 3.5 | 3.6 | 3.6 | 3.8 | 3.9 |
| Fromage Frais and Quark | 3.6 | 4.4 | 5.5 | 6.6 | 7.9 | 9.0 |
| Milk | 97.4 | 99.7 | 105.4 | 110.4 | 118.7 | 126.5 |
| Sour Milk Products | 8.6 | 9.0 | 10.7 | 12.9 | 14.2 | 15.2 |
| Yoghurt | 47.4 | 54.7 | 61.8 | 69.7 | 76.6 | 81.9 |
| Source: Euromonitor International, 2022 | ||||||
| Category | Annual growth % 2020-2021 | CAGR* % 2016-2021 | Total growth % 2016-2021 |
|---|---|---|---|
| Organic Dairy Total | 7.5 | 9.7 | 58.9 |
| Butter and Spreads | 5.1 | 15.0 | 100.9 |
| Cheese | 9.6 | 11.4 | 71.2 |
| Cream | 4.5 | 7.1 | 40.8 |
| Flavoured Milk Drinks | 2.6 | 2.2 | 11.4 |
| Fromage Frais and Quark | 13.9 | 20.1 | 150.0 |
| Milk | 6.6 | 5.4 | 29.9 |
| Sour Milk Products | 7.0 | 12.1 | 76.7 |
| Yoghurt | 6.9 | 11.6 | 72.8 |
|
Source: Euromonitor International, 2022 *CAGR: Compound annual growth rate |
|||
| Company | Retail sales (US$ millions) | Market share (%) |
|---|---|---|
| Arla Foods Amba | 70.5 | 16.8 |
| Weerribben Zuivel BV | 37.1 | 8.8 |
| Royal FrieslandCampina NV | 35.3 | 8.4 |
| Stichting Merkartikel Bio+ | 16.2 | 3.9 |
| Bio Kaas BV | 13.0 | 3.1 |
| Private Label | 202.7 | 48.2 |
| Source: Euromonitor International, 2022 | ||
| Category | 2022 | 2023 | 2024 | 2025 | 2026 |
|---|---|---|---|---|---|
| Organic Dairy Total | 454.8 | 490.4 | 527.6 | 570.1 | 619.2 |
| Butter and Spreads | 50.0 | 52.6 | 55.2 | 58.0 | 61.3 |
| Cheese | 142.2 | 155.9 | 171.9 | 190.6 | 212.5 |
| Cream | 7.4 | 7.8 | 8.2 | 8.7 | 9.2 |
| Flavoured Milk Drinks | 4.0 | 4.2 | 4.3 | 4.5 | 4.7 |
| Fromage Frais and Quark | 10.3 | 11.8 | 13.2 | 14.8 | 16.6 |
| Milk | 135.6 | 144.6 | 152.9 | 162.4 | 173.2 |
| Sour Milk Products | 16.4 | 17.6 | 18.6 | 19.9 | 21.4 |
| Yoghurt | 88.8 | 96.0 | 103.1 | 111.2 | 120.3 |
| Source: Euromonitor International, 2022 | |||||
| Category | Annual growth % 2021-2022 | CAGR* % 2021-2026 | Total growth % 2021-2026 |
|---|---|---|---|
| Organic Dairy Total | 8.1 | 8.0 | 47.1 |
| Butter and Spreads | 5.9 | 5.4 | 29.9 |
| Cheese | 9.3 | 10.3 | 63.3 |
| Cream | 7.2 | 5.9 | 33.3 |
| Flavoured Milk Drinks | 2.6 | 3.8 | 20.5 |
| Fromage Frais and Quark | 14.4 | 13.0 | 84.4 |
| Milk | 7.2 | 6.5 | 36.9 |
| Sour Milk Products | 7.9 | 7.1 | 40.8 |
| Yoghurt | 8.4 | 8.0 | 46.9 |
|
Source: Euromonitor International, 2022 *CAGR: Compound annual growth rate |
|||
Organic processed meat, seafood, fruits and vegetable
In 2021, organic chilled and processed seafood was the largest category of processed meat, seafood, fruits and vegetables, at US$61.4 million. In 2022, all sub categories were expected to see similar growth at 3.3% for organic chilled processed meat and seafood, with the others growing 3.2% for that year. From 2021 to 2026, Organic frozen meat, seafood, fruit and vegetables is expected to see the fastest growth at a CAGR of 6.2%.
| Category | 2016 | 2017 | 2018 | 2019 | 2020 | 2021 |
|---|---|---|---|---|---|---|
| Organic Chilled Processed Meat and Seafood | 50.8 | 53.2 | 55.5 | 58.1 | 60.7 | 61.4 |
| Organic Frozen Meat, Seafood, Fruit and Vegetables | 15.0 | 16.5 | 18.2 | 19.7 | 21.9 | 22.1 |
| Organic Shelf Stable Meat, Seafood, Fruit and Vegetables | 15.9 | 17.2 | 18.4 | 19.6 | 21.6 | 21.7 |
| Source: Euromonitor International, 2022 | ||||||
| Category | Annual growth % 2020-2021 | CAGR* % 2016-2021 | Total growth % 2016-2021 |
|---|---|---|---|
| Organic Chilled Processed Meat and Seafood | 1.2 | 3.9 | 20.9 |
| Organic Frozen Meat, Seafood, Fruit and Vegetables | 0.9 | 8.1 | 47.3 |
| Organic Shelf Stable Meat, Seafood, Fruit and Vegetables | 0.5 | 6.4 | 36.5 |
|
Source: Euromonitor International, 2022 *CAGR: Compound annual growth rate |
|||
| Company | Retail sales (US$ millions) | Market share (%) |
|---|---|---|
| Stichting Merkartikel Bio+ | 8.8 | 14.3 |
| Private Label | 39.0 | 63.5 |
| Others | 13.6 | 22.2 |
| Source: Euromonitor International, 2022 | ||
| Company | Retail sales (US$ millions) | Market share (%) |
|---|---|---|
| Stichting Merkartikel Bio+ | 3.6 | 16.1 |
| Demeter Felderzeugnisse GmbH | 3.5 | 15.7 |
| Private Label | 7.3 | 32.9 |
| Others | 7.8 | 35.3 |
| Source: Euromonitor International, 2022 | ||
| Company | Retail sales (US$ millions) | Market share (%) |
|---|---|---|
| Chancerelle | 1.7 | 7.7 |
| Aarts Conserven BV | 1.2 | 5.5 |
| Conservas Antonio Peréz Lafuente SA | 0.8 | 3.9 |
| Private Label | 9.8 | 45.4 |
| Others | 8.1 | 37.5 |
| Source: Euromonitor International, 2022 | ||
| Category | 2022 | 2023 | 2024 | 2025 | 2026 |
|---|---|---|---|---|---|
| Organic Chilled Processed Meat and Seafood | 63.4 | 65.7 | 69.1 | 72.9 | 76.8 |
| Organic Frozen Meat, Seafood, Fruit and Vegetables | 22.8 | 23.5 | 25.2 | 27.4 | 29.8 |
| Organic Shelf Stable Meat, Seafood, Fruit and Vegetables | 22.4 | 23.0 | 24.4 | 26.1 | 27.6 |
| Source: Euromonitor International, 2022 | |||||
| Category | Annual growth % 2021-2022 | CAGR* % 2021-2026 | Total growth % 2021-2026 |
|---|---|---|---|
| Organic Chilled Processed Meat and Seafood | 3.3 | 4.6 | 25.1 |
| Organic Frozen Meat, Seafood, Fruit and Vegetables | 3.2 | 6.2 | 34.8 |
| Organic Shelf Stable Meat, Seafood, Fruit and Vegetables | 3.2 | 4.9 | 27.2 |
|
Source: Euromonitor International, 2022 *CAGR: Compound annual growth rate |
|||
Organic rice and pasta
Both rice and pasta saw negative annual growth in the 2020-21 year, with organic pasta being hit particularly hard. Both categories are expected to partially recover in 2021-2022, with organic pasta growing fastest at 5.2%, while organic rice grows slightly. From 2021 to 2026, growth of rice is expected to be more robust, occurring at a CAGR of 3.2%, while growth or organic pasta is expected to slow slightly to a CAGR of 4.9%.
| Category | 2016 | 2017 | 2018 | 2019 | 2020 | 2021 |
|---|---|---|---|---|---|---|
| Organic rice and pasta Total | 34.0 | 35.5 | 37.0 | 38.4 | 44.0 | 41.8 |
| Rice | 20.5 | 21.0 | 21.7 | 22.4 | 25.0 | 24.5 |
| Pasta | 13.5 | 14.5 | 15.3 | 16.0 | 19.0 | 17.4 |
| Source: Euromonitor International, 2022 | ||||||
| Category | Annual growth % 2020-2021 | CAGR* % 2016-2021 | Total growth % 2016-2021 |
|---|---|---|---|
| Organic rice and pasta Total | −5.0 | 4.2 | 22.9 |
| Organic Rice | −2.0 | 3.6 | 19.5 |
| Organic Pasta | −8.4 | 5.2 | 28.9 |
|
Source: Euromonitor International, 2022 *CAGR: Compound annual growth rate |
|||
| Company | Retail sales (US$ millions) | Market share (%) |
|---|---|---|
| Stichting Merkartikel Bio+ | 2.3 | 5.5 |
| Biorganic BV | 1.2 | 3.0 |
| Dalla Costa Alimentare SRL | 0.9 | 2.1 |
| Agrolimen SA | 0.8 | 1.9 |
| Udea BV | 0.7 | 1.6 |
| Private Label | 10.1 | 24.1 |
| Source: Euromonitor International, 2022 | ||
| Category | 2022 | 2023 | 2024 | 2025 | 2026 |
|---|---|---|---|---|---|
| Organic rice and pasta Total | 42.9 | 44.4 | 46.3 | 48.5 | 50.9 |
| Organic Rice | 24.6 | 25.1 | 26.2 | 27.5 | 28.7 |
| Organic Pasta | 18.3 | 19.3 | 20.1 | 21.1 | 22.1 |
| Source: Euromonitor International, 2022 | |||||
| Category | Annual growth % 2021-2022 | CAGR* % 2021-2026 | Total growth % 2021-2026 |
|---|---|---|---|
| Organic rice and pasta Total | 2.6 | 4.0 | 21.8 |
| Organic Rice | 0.4 | 3.2 | 17.1 |
| Organic Pasta | 5.2 | 4.9 | 27.0 |
|
Source: Euromonitor International, 2022 *CAGR: Compound annual growth rate |
|||
Organic snacks
In 2021, organic savoury snacks was the largest category of organic snacks, with sales of US$51.7 million, followed very closely by organic sweet biscuits, snack bars, and fruit snacks at US$50.5 million, and organic confectionary with US$49.7 million. In the 2021-22 year, growth is expected to be fastest for organic sweet biscuits, snack bars and fruit snacks, with the sub-category expected to expand 7.1% for the year. Growth is expected to be particularly strong for cereal bars, which are set to grow 9.5%. From 2021 to 2026, organic sweet biscuits, snack bars and fruit snacks are expected to once again be the fastest growing category.
Organic chocolate is also popular in the Netherlands, due to concerns about the environmental and humanitarian impact of chocolate production.
| Category | 2016 | 2017 | 2018 | 2019 | 2020 | 2021 |
|---|---|---|---|---|---|---|
| Organic Confectionery | 34.9 | 37.7 | 40.5 | 43.1 | 46.6 | 49.7 |
| Chocolate Confectionery | 34.9 | 37.7 | 40.5 | 43.1 | 46.6 | 49.7 |
| Sugar Confectionery | ||||||
| Organic Ice Cream | 7.5 | 8.0 | 8.5 | 8.9 | 9.3 | 9.6 |
| Organic Savoury Snacks | 39.7 | 41.5 | 43.3 | 45.1 | 48.7 | 51.7 |
| Nuts, Seeds, Trail Mixes | 3.4 | 3.5 | 3.8 | 4.0 | 4.4 | 4.7 |
| Savoury Snacks | 36.4 | 38.0 | 39.5 | 41.1 | 44.3 | 47.0 |
| Organic Sweet Biscuits, Snack Bars and Fruit Snacks | 35.0 | 37.9 | 40.9 | 43.6 | 47.3 | 50.5 |
| Cereal Bars | 3.1 | 3.3 | 3.5 | 3.6 | 3.9 | 4.2 |
| Fruit Snacks | 15.9 | 17.5 | 19.1 | 20.7 | 22.7 | 24.6 |
| Sweet Biscuits | 16.0 | 17.2 | 18.3 | 19.3 | 20.6 | 21.7 |
| Source: Euromonitor International, 2022 | ||||||
| Category | Annual growth % 2020-2021 | CAGR* % 2016-2021 | Total growth % 2016-2021 |
|---|---|---|---|
| Organic Confectionery | 6.7 | 7.3 | 42.4 |
| Chocolate Confectionery | 6.7 | 7.3 | 42.4 |
| Sugar Confectionery | |||
| Organic Ice Cream | 3.2 | 5.1 | 28.0 |
| Organic Savoury Snacks | 6.2 | 5.4 | 30.2 |
| Nuts, Seeds, Trail Mixes | 6.8 | 6.7 | 38.2 |
| Savoury Snacks | 6.1 | 5.2 | 29.1 |
| Organic Sweet Biscuits, Snack Bars and Fruit Snacks | 6.8 | 7.6 | 44.3 |
| Cereal Bars | 7.7 | 6.3 | 35.5 |
| Fruit Snacks | 8.4 | 9.1 | 54.7 |
| Sweet Biscuits | 5.3 | 6.3 | 35.6 |
|
Source: Euromonitor International, 2022 *CAGR: Compound annual growth rate |
|||
| Company | Retail sales (US$ millions) | Market share (%) |
|---|---|---|
| Stichting Merkartikel Bio+ | 7.1 | 14.2 |
| Udea BV | 5.0 | 10.1 |
| Private Label | 19.1 | 38.4 |
| Others | 18.5 | 37.3 |
| Source: Euromonitor International, 2022 | ||
| Company | Retail sales (US$ millions) | Market share (%) |
|---|---|---|
| Arla Foods Amba | 3.2 | 33.1 |
| Stichting Merkartikel Bio+ | 0.9 | 9.7 |
| Frozen Dutch Ice Cream & Sorbets BV | 0.3 | 2.7 |
| Green & White BV | 0.2 | 2.4 |
| Private Label | 1.5 | 15.8 |
| Others | 3.5 | 36.3 |
| Source: Euromonitor International, 2022 | ||
| Company | Retail sales (US$ millions) | Market share (%) |
|---|---|---|
| Udea BV | 15.7 | 30.3 |
| FZ Organic Food BV | 14.7 | 28.5 |
| de Smaakspecialist BV | 2.6 | 5.0 |
| Royal FrieslandCampina NV | 0.9 | 1.8 |
| Private Label | 4.8 | 9.3 |
| Others | 13.0 | 25.2 |
| Source: Euromonitor International, 2022 | ||
| Company | Retail sales (US$ millions) | Market share (%) |
|---|---|---|
| Udea BV | 8.6 | 17.0 |
| Ecotone | 8.2 | 16.2 |
| de Smaakspecialist BV | 4.3 | 8.4 |
| Hain Celestial Group Inc, The | 2.1 | 4.1 |
| Stichting Merkartikel Bio+ | 2.0 | 4.0 |
| Private Label | 21.1 | 41.8 |
| Others | 4.2 | 8.5 |
| Source: Euromonitor International, 2022 | ||
| Category | 2022 | 2023 | 2024 | 2025 | 2026 |
|---|---|---|---|---|---|
| Organic Confectionery | 53.0 | 56.3 | 59.5 | 62.6 | 66.1 |
| Organic Chocolate Confectionery | 53.0 | 56.3 | 59.5 | 62.6 | 66.1 |
| Organic Sugar Confectionery | |||||
| Organic Ice Cream | 10.0 | 10.4 | 10.8 | 11.1 | 11.5 |
| Organic Savoury Snacks | 55.0 | 57.5 | 59.6 | 61.3 | 63.1 |
| Organic Nuts, Seeds, Trail Mixes | 5.0 | 5.3 | 5.5 | 5.8 | 6.1 |
| Organic Savoury Snacks | 50.0 | 52.2 | 54.1 | 55.5 | 57.0 |
| Organic Sweet Biscuits, Snack Bars and Fruit Snacks | 54.1 | 57.8 | 61.6 | 65.6 | 69.9 |
| Organic Cereal Bars | 4.6 | 5.0 | 5.4 | 5.9 | 6.5 |
| Organic Fruit Snacks | 26.6 | 28.6 | 30.8 | 33.1 | 35.7 |
| Organic Sweet Biscuits | 23.0 | 24.2 | 25.4 | 26.6 | 27.6 |
| Source: Euromonitor International, 2022 | |||||
| Category | Annual growth % 2021-2022 | CAGR* % 2021-2026 | Total growth % 2021-2026 |
|---|---|---|---|
| Organic Confectionery | 6.6 | 5.9 | 33.0 |
| Organic Chocolate Confectionery | 6.6 | 5.9 | 33.0 |
| Organic Sugar Confectionery | |||
| Organic Ice Cream | 4.2 | 3.7 | 19.8 |
| Organic Savoury Snacks | 6.4 | 4.1 | 22.1 |
| Organic Nuts, Seeds, Trail Mixes | 6.4 | 5.4 | 29.8 |
| Organic Savoury Snacks | 6.4 | 3.9 | 21.3 |
| Organic Sweet Biscuits, Snack Bars and Fruit Snacks | 7.1 | 6.7 | 38.4 |
| Organic Cereal Bars | 9.5 | 9.1 | 54.8 |
| Organic Fruit Snacks | 8.1 | 7.7 | 45.1 |
| Organic Sweet Biscuits | 6.0 | 4.9 | 27.2 |
|
Source: Euromonitor International, 2022 *CAGR: Compound annual growth rate |
|||
New product launch analysis
From 2017 to 2021, there were a total of 4,301 product launches of organic packaged food in the Netherlands. Top claims included low or no allergen, environmentally friendly packaging, vegan, gluten free, and sustainable. Top packaging types included flexible, jar, bottle, carton, and tray, while top flavours included plain, coconut, apple, herbal, and spice. Top categories of products included baking ingredients and mixes, vegetables, oils, and sweet biscuits. The average price or organic products launched from 2017 to 2021 was US$4.91.
| Product attributes | Number of new products by year | Total | ||||
|---|---|---|---|---|---|---|
| 2017 | 2018 | 2019 | 2020 | 2021 | ||
| Yearly product launches | 731 | 880 | 740 | 896 | 1,054 | 4,301 |
| Top 10 claims | ||||||
| Low/No/Reduced Allergen | 215 | 257 | 280 | 307 | 326 | 1,385 |
| Ethical - Environmentally Friendly Package | 107 | 244 | 261 | 326 | 368 | 1,306 |
| Vegan/No Animal Ingredients | 160 | 210 | 249 | 275 | 379 | 1,273 |
| Gluten Free | 192 | 228 | 244 | 261 | 284 | 1,209 |
| Ethical - Recycling | 62 | 132 | 165 | 234 | 240 | 833 |
| Ethical - Sustainable (Habitat/Resources) | 85 | 152 | 142 | 159 | 239 | 777 |
| Ethical - Environmentally Friendly Product | 77 | 112 | 110 | 96 | 167 | 562 |
| Vegetarian | 62 | 104 | 91 | 116 | 96 | 469 |
| Social Media | 54 | 95 | 87 | 96 | 104 | 436 |
| No Additives/Preservatives | 69 | 86 | 79 | 69 | 73 | 376 |
| Top 10 companies | ||||||
| Albert Heijn | 26 | 94 | 87 | 88 | 48 | 343 |
| Udea | 12 | 15 | 26 | 67 | 57 | 177 |
| De Smaakspecialist | 40 | 21 | 32 | 22 | 37 | 152 |
| Jumbo Supermarkten | 3 | 42 | 25 | 32 | 29 | 131 |
| Ekoplaza | 18 | 31 | 9 | 37 | 30 | 125 |
| TerraSana | 13 | 14 | 16 | 27 | 24 | 94 |
| Marqt | 6 | 18 | 21 | 18 | 2 | 65 |
| Lidl | 14 | 19 | 13 | 5 | 6 | 57 |
| Leev | 11 | 15 | 9 | 4 | 10 | 49 |
| Groupe Ekibio | 4 | 9 | 7 | 12 | 13 | 45 |
| Top 5 flavours (including blend) | ||||||
| Unflavoured/Plain | 288 | 382 | 332 | 429 | 475 | 1,906 |
| Coconut | 12 | 14 | 14 | 2 | 10 | 52 |
| Apple | 9 | 7 | 7 | 8 | 5 | 36 |
| Salt (Sea)/Fleur de Sel | 7 | 5 | 11 | 3 | 6 | 32 |
| Tomato | 3 | 8 | 5 | 8 | 8 | 32 |
| Top 5 ingredients | ||||||
| Salt (Food) | 181 | 187 | 185 | 221 | 279 | 1,053 |
| Waters (Food) | 135 | 191 | 192 | 242 | 281 | 1,041 |
| Sea Salt (Food) | 174 | 203 | 148 | 219 | 274 | 1,018 |
| Sunflower Seed Oil (Food) | 144 | 179 | 134 | 192 | 251 | 900 |
| Food Acids | 79 | 94 | 76 | 103 | 127 | 479 |
| Launch types | ||||||
| New Variety/Range Extension | 280 | 386 | 330 | 424 | 496 | 1,916 |
| New Product | 384 | 335 | 296 | 291 | 329 | 1,635 |
| New Packaging | 51 | 128 | 68 | 112 | 163 | 522 |
| Relaunch | 12 | 25 | 36 | 59 | 60 | 192 |
| New Formulation | 4 | 6 | 10 | 10 | 6 | 36 |
| Top 5 package types | ||||||
| Flexible | 363 | 395 | 310 | 337 | 413 | 1,818 |
| Jar | 113 | 112 | 119 | 162 | 206 | 712 |
| Tray | 47 | 86 | 53 | 97 | 91 | 374 |
| Carton | 43 | 88 | 55 | 68 | 83 | 337 |
| Tub | 41 | 52 | 57 | 59 | 51 | 260 |
| Product origin | ||||||
| Imported | 107 | 124 | 145 | 150 | 167 | 693 |
| Not imported | 19 | 21 | 12 | 7 | 19 | 78 |
| Source: Mintel GNPD, 2022 | ||||||
| Sub-category | Number of products | Average price (in US$) |
|---|---|---|
| Baking Ingredients & Mixes | 173 | 5.85 |
| Vegetables | 159 | 3.38 |
| Oils | 168 | 10.40 |
| Sweet Biscuits/Cookies | 139 | 3.35 |
| Chocolate Tablets | 141 | 4.30 |
| Cold Cereals | 120 | 5.35 |
| Savoury Biscuits/Crackers | 156 | 2.81 |
| Meat Products | 149 | 5.76 |
| Hard Cheese & Semi-Hard Cheese | 164 | 7.86 |
| Pasta | 124 | 3.30 |
| Seasonings | 135 | 4.99 |
| Nuts | 131 | 8.75 |
| Bread & Bread Products | 105 | 3.46 |
| Fruit Snacks | 115 | 6.50 |
| Meat Substitutes | 124 | 4.13 |
| Other | 2,198 | 4.40 |
| Source: Mintel GNPD, 2022 | ||
Examples of new products
Maple Syrup
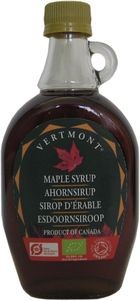
| Company | Cofradex |
|---|---|
| Brand | Vermont |
| Category | Sweet spreads |
| Sub-category | Syrups |
| Store type | Natural / health food store |
| Date published | March 2022 |
| Launch type | New product |
| Price in US dollars | 10.11 ($2.04 per 100 millilitres) |
| Location of manufacture | Canada |
Vermont Ahornsirup (Maple Syrup) is now available. The 100% pure organic Canadian maple syrup is kosher certified, and retails in a 495 gram pack bearing BIO, EU Organic and Organic Soil Association logos.
Positioning claims: Kosher
Organic Maple Syrup
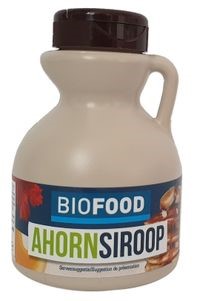
| Company | Damhert |
|---|---|
| Brand | Biofood |
| Category | Sweet spreads |
| Sub-category | Syrups |
| Store type | Supermarket |
| Date published | June 2021 |
| Launch type | New product |
| Price in US dollars | 7.11 ($3.01 per 100 millilitres) |
| Location of manufacture | Not specified |
Biofood Ahorn Siroop (Organic Maple Syrup) is now available. The vegan product is suitable to sweeten drinks, desserts, muesli, yogurt and any other product that needs sugar, and retails in a 236 millilitre pack bearing the EU Organic logo.
Positioning claims: Vegan/no animal ingredients
Organic Pancetta Dolce
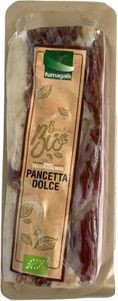
| Company | Fumagalli Industria Alimentari |
|---|---|
| Brand | Fumagalli |
| Category | Processed fish, meat and egg products |
| Sub-category | Meat products |
| Store type | Internet / mail order |
| Date published | May 2022 |
| Launch type | New packaging |
| Price in US dollars | 7.16 ($3.58 per 100 grams) |
| Location of manufacture | Not specified |
Fumagalli Organic Pancetta Dolce now retails in a newly designed 200 gram pack bearing the EU Organic logo.
Positioning claims: Not specified
Organic Butcher Ham

| Company | Streeckgenoten |
|---|---|
| Brand | Streeckgenoten |
| Category | Processed fish, meat and egg products |
| Sub-category | Meat products |
| Store type | Supermarket |
| Date published | March 2022 |
| Launch type | New packaging |
| Price in US dollars | 4.21 ($3.69 per 100 grams) |
| Location of manufacture | Not specified |
Streeckgenoten Biologische Slagers Achterham (Organic Butcher Ham) retails in a 114g pack bearing the EU Organic logo, Dierenbescherming Beter Leven (Animal Protection Better Life) logo with three stars and a QR code.
Positioning claims: Ethical (animal), convenient packaging
Organic Fresh Soaked Cranberries
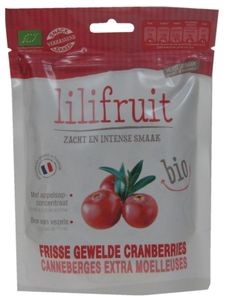
| Company | Fruit Gourmet |
|---|---|
| Brand | Lilifruit |
| Category | Snacks |
| Sub-category | Fruit snacks |
| Date published | October 2021 |
| Launch type | New variety / range extensions |
| Price in US dollars | 6.91 ($4.61 per 100 grams) |
| Location of manufacture | Not specified |
Lilifruit Bio Frisse Gewelde Cranberries (Organic Fresh Soaked Cranberries) are made with apple juice concentrate and are said to be a source of fibre. The product retails in a 150 gram resealable pack featuring the EU Organic logo and a QR code.
Positioning claims: Convenient packaging
Chocolate Raspberry Granola Bar
| Company | Riverside International |
|---|---|
| Brand | MadeGood |
| Category | Snacks |
| Sub-category | Snacks / Cereal / Energy Bars |
| Store type | Internet / mail order |
| Date published | December 2020 |
| Launch type | New variety / range extension |
| Price in US dollars | 0.88 ($2.44 per 100 grams) |
| Location of manufacture | Not specified |
MadeGood Granola Reep met Stukjes Chocolade en Framboos (Chocolate Raspberry Granola Bar) is high in fibre, certified organic and vegan, and allergy-friendly. It retails in a 36 gram recyclable paper pack that bears the EU Green Leaf logo.
Positioning claims: Ethical (environmentally friendly package, recycling), high/added fibre, vegan/no animal ingredients
Crunchy Corn & Pulses Triangles
| Company | TerraSana |
|---|---|
| Brand | TerraSana |
| Category | Snacks |
| Sub-category | Corn-based snacks |
| Store type | Natural / health food store |
| Date published | August 2021 |
| Launch type | New variety / range extension |
| Price in US dollars | 2.22 ($2.78 per 100 grams) |
| Location of manufacture | Not specified |
TerraSana Crunchy Triangles Maïs & Peulvruchten (Crunchy Corn & Pulses Triangles) are said to contain 50% less fat that regular tortilla chips, and have not been fried. This organic product is free from gluten, is said to be ideal with dips like hummus, guacamole, tzatziki or tomato dip, and retails in an 80 gram pack featuring the EU Organic logo.
Positioning claims: Gluten free, low/no/reduced (allergen, fat)
Organic Labelling
In the Netherlands, organic food that meets standards set by the EU can be sold and marketed as an organic product. The EU - Canada Organic Equivalency Arrangement (EUCOEA) allows for Canadian products to be exported as organic products to the Netherlands, provided that these products are certified under the Canadian Food Inspection Agency (CFIA) Canada Organic Regime or EU organic system. A list of certification bodies accredited by the Canadian Food Inspection Agency can be found on the List of certification bodies under the Canada Organic Regime page.
For more information
The Canadian Trade Commissioner Service:
International Trade Commissioners can provide Canadian industry with on-the-ground expertise regarding market potential, current conditions and local business contacts, and are an excellent point of contact for export advice.
More agri-food market intelligence:
International agri-food market intelligence
Discover global agriculture and food opportunities, the complete library of Global Analysis reports, market trends and forecasts, and information on Canada's free trade agreements.
Agri-food market intelligence service
Canadian agri-food and seafood businesses can take advantage of a customized service of reports and analysis, and join our email subscription service to have the latest reports delivered directly to their inbox.
More on Canada's agriculture and agri-food sectors:
Canada's agriculture sectors
Information on the agriculture industry by sector. Data on international markets. Initiatives to support awareness of the industry in Canada. How the department engages with the industry.
Resources
- Canada Food Inspection Agency, European Union – Canada Organic Equivalency Arrangement (EUCOEA) Overview (March 18, 2021)
- Euromonitor International
- Food and Drink E-Commerce in the Netherlands (March 1, 2022)
- Economy Finance and Trade: The Netherlands (February 17, 2022)
- Organic Packaged Food Database (accessed on June 28, 2022)
- Organic Packaged Food in the Netherlands (February 2022)
- Eurostat. Rotterdam: the largest freight port in the EU, April 2, 2020
- Mintel, New Product Database (accessed on June 28, 2022)
- Port of Rotterdam. Facts and Figures, accessed on July 6, 2022
- Research Institute of Organic Agriculture, Organic Export Info: Netherlands (Accessed on June 28, 2022)
- The Netherlands and You, Record-High Dutch Export of Agricultural Goods in 2020 (February 16, 2021)
- United States Department of Agriculture, The Organic Market in the Netherlands (December 7, 2021)
Health and Wellness Series – Organic packaged food trends in the Netherlands
Global Analysis Report
Prepared by: Brendan Dwyer, Student
© His Majesty the King in Right of Canada, represented by the Minister of Agriculture and Agri-Food (2022).
Photo credits
All photographs reproduced in this publication are used by permission of the rights holders.
All images, unless otherwise noted, are copyright His Majesty the King in Right of Canada.
To join our distribution list or to suggest additional report topics or markets, please contact:
Agriculture and Agri-Food Canada, Global Analysis1341 Baseline Rd, Tower 5, 3rd floor
Ottawa ON K1A 0C5
Canada
Email: aafc.mas-sam.aac@agr.gc.ca
The Government of Canada has prepared this report based on primary and secondary sources of information. Although every effort has been made to ensure that the information is accurate, Agriculture and Agri-Food Canada (AAFC) assumes no liability for any actions taken based on the information contained herein.
Reproduction or redistribution of this document, in whole or in part, must include acknowledgement of agriculture and agri-food Canada as the owner of the copyright in the document, through a reference citing AAFC, the title of the document and the year. Where the reproduction or redistribution includes data from this document, it must also include an acknowledgement of the specific data source(s), as noted in this document.
Agriculture and Agri-Food Canada provides this document and other report services to agriculture and food industry clients free of charge.