

Note: This report includes forecasting data that is based on baseline historical data.
Executive summary
Total retail sales of tea in the United States were US$2.9 billion in 2021, which are expected to reach US$3.4 billion by 2026. Retail sales of organic tea in the United States were US$0.4 billion in 2021, expected to reach US$0.5 billion in 2026. In 2021, 13.3% of tea retail sales in the United States were organic.
Tea sales in the United States grew at a categorized annual growth rate (CAGR) of 3.1% from 2016 to 2021 and are forecast to grow at a CAGR of 3.3% from 2021 to 2026. Organic tea sales in the United States grew at a CAGR of 5.8% from 2016 to 2021 and are forecast to grow at a CAGR of 6.6% from 2021 to 2026, both below the global average rates.
In 2021, the United States was the largest market globally for both organic and non-organic tea. Tea and especially organic tea saw a sharp spike in sales in 2020, as consumers spending more time at home increased their consumption of these products. Although some of these gains were reversed in 2021, retail sales of organic tea in the United States are expected to see strong growth in the years ahead.
Tea in the United States has benefitted from its perception as healthy, which is expected to be a continued driver of growth going forward. Organic fruit and herbal teas currently make up a majority of the United States organic tea market and are expected to see the strongest growth from 2021 to 2026.
Canada currently enjoys preferential access to the United States market due to the Canada United States Mexico Agreement. The United States-Canada Organic Equivalence Arrangement allows for Canadian products certified organic in Canada to be labelled as such in the United States.
Market overview
In 2021, the United States was both the largest global market for tea and organic tea. Total retail sales of tea in the United States were US$2.9 billion, equal to 6.0% of the global market. Retail sales of tea grew at a CAGR of 3.1% from 2016-2021, below the global average rate of 5.2%. Tea sales in the United States saw very slow growth from 2016 to 2019, and most of the growth over the historic period occurred in the year 2020. Tea sales rose 18.0%% in 2020, with the gains being spread unevenly. Tea sales in the service sector suffered, while outlets focussed on home consumption saw huge gains. Similar sales spikes occurred for other hot beverages such as coffee, however the spike in sales for tea was significantly larger, due to a perception that tea is beneficial to health.
Tea sales then saw a contraction of 4.7% in 2021, however are expected to see continued growth from 2022 onward. Sales of tea from 2021 to 2026 are expected to grow at a CAGR of 3.3%, reaching US$3.4 billion in 2026.
In 2020, tea sales in the United States rose Growth is expected to pick up slightly from 2021 to 2026, occurring at a CAGR of 3.3% over the forecast period. Total tea sales are expected to reach US$3.4 billion in 2026, accounting for 5.4% of the global market.
In 2021, organic tea sales in the United States were US$0.4 billion, accounting for 13.3% of the domestic tea market, and 22.3% of the global market for organic tea. Organic tea sales grew at a CAGR of 5.8% from 2016-2021. Growth is expected to pick up slightly after 2021, with sales growing at a CAGR of 6.6% from 2021 to 2026. Sales of organic tea are expected to reach US$0.5 billion in 2026, at which point they will account for 15.5% of the United States tea market and 20.4% of the global market for organic tea.
| Country | 2016 | 2021 | CAGR* % 2016-2021 | 2022 | 2026 | CAGR* % 2021-2026 |
|---|---|---|---|---|---|---|
| World Total | 36,746.0 | 47,315.8 | 5.2 | 49,800.0 | 61,918.4 | 5.5 |
| United States | 2,450.9 | 2,859.8 | 3.1 | 2,893.7 | 3,367.1 | 3.3 |
| Germany | 1,842.0 | 2,160.5 | 3.2 | 2,227.9 | 2,516.7 | 3.1 |
| Russia | 1,913.9 | 1,646.4 | −3.0 | 1,644.6 | 1,717.0 | 0.8 |
| Iran | 508.2 | 1,371.6 | 22.0 | 1,424.1 | 1,573.0 | 2.8 |
| United Kingdom | 1,141.3 | 1,239.4 | 1.7 | 1,280.5 | 1,499.3 | 3.9 |
| Turkey | 505.6 | 1,062.9 | 16.0 | 1,230.6 | 1,913.8 | 12.5 |
| France | 654.6 | 827.5 | 4.8 | 873.1 | 999.5 | 3.8 |
| Canada | 594.0 | 816.3 | 6.6 | 835.9 | 1,075.0 | 5.7 |
| Poland | 580.3 | 718.7 | 4.4 | 754.3 | 862.9 | 3.7 |
| Egypt | 272.9 | 618.6 | 17.8 | 689.7 | 1,099.2 | 12.2 |
|
Source: Euromonitor International, 2022 *CAGR: Compound annual growth rate Historic data: 2016-2021 Forecast data: 2022-2026 |
||||||
| Country | 2016 | 2021 | CAGR* % 2016-2021 | 2022 | 2026 | CAGR* % 2021-2026 |
|---|---|---|---|---|---|---|
| World Total | 1,128.4 | 1,707.9 | 8.6 | 1,852.1 | 2,566.5 | 8.5 |
| United States | 287.2 | 381.0 | 5.8 | 405.6 | 523.4 | 6.6 |
| France | 69.4 | 183.3 | 21.4 | 215.5 | 385.6 | 16.0 |
| United Kingdom | 78.1 | 157.4 | 15.0 | 169.6 | 230.9 | 8.0 |
| Germany | 117.1 | 154.1 | 5.6 | 161.0 | 196.2 | 4.9 |
| Japan | 129.3 | 126.4 | −0.5 | 123.6 | 128.8 | 0.4 |
| Netherlands | 48.2 | 87.6 | 12.7 | 92.7 | 109.3 | 4.5 |
| Canada | 63.6 | 75.0 | 3.4 | 88.0 | 110.9 | 8.1 |
| China | 37.2 | 68.4 | 13.0 | 75.2 | 102.1 | 8.3 |
| India | 29.9 | 66.4 | 17.3 | 77.7 | 145.1 | 16.9 |
| Australia | 15.9 | 48.8 | 25.1 | 56.8 | 91.7 | 13.4 |
|
Source: Euromonitor International, 2022 *CAGR: Compound annual growth rate Historic data: 2016-2021 Forecast data: 2022-2026 |
||||||
Organic tea in the United States saw growth occurring at a CAGR of 4.2% from 2016-2019, followed by growth of 22.9% from 2019-2020. 2020-2021 saw a contraction of 8.9%, as many consumers shifted back to pre-pandemic habits. In 2021, sales of fruit and herbal tea accounted for the majority of organic tea sales. Retail sales of organic fruit and herbal tea were US$208.3 million for 2021, accounting 54.7% of organic tea sales. Organic sales of black tea accounted for 24.2% of the market, while green tea made up the remaining 21.2%.
Sales of black tea saw the fastest growth from 2016-2021, however sales of fruit and herbal tea are expected to see the fastest growth from 2021-2026. From 2021-2026, organic fruit and herbal tea are expected to see sales growth occur at a CAGR of 7.2%. In 2026, fruit and herbal tea is expected to see total sales of US$294.8 million, accounting for 56.3% of the organic tea market.
As consumers shifted towards at home consumption of tea in 2020, some consumers began consuming more premium teas, such as those with organic certification. This was often a reaction to the increased affordability of consuming hot beverages at home. Furthermore, organic tea benefitted greatly in 2020 from its perception as good for immune function, as well as a perception of being beneficial for health in general. This perception applies more strongly to green and herbal teas, while black teas do not benefit from this perception in the same way. Continued growth in the organic tea sector is expected to be driven by continued consumer interest in health, as concerns pivot from immune support to sleep quality and relaxation. Organic black tea is forecast to see relatively slow growth in comparison.
The largest player in the organic tea market, not including herbal and fruit teas, was Numi Inc.Footnote 1 In 2021, Numi Inc had US$13.2 million in organic tea sales and a 16.4% market share. Numi Inc was also the second largest player in the organic black tea market, with US$9.9 million in sales and a 10.7% market share. Overall, Numi Inc's combined organic black tea and green tea sales totalled US$23.1 million, accounting for 6.1% of the total organic tea market and 13.4% of the combined organic black and green tea markets. The largest player in the organic black tea market was Associated British Foods Plc, with US$20.7 million in sales and a 22.5% market share. The company's organic black tea sales accounted for 5.4% of the organic tea market in the United States.
| Category | 2016 | 2017 | 2018 | 2019 | 2020 | 2021 |
|---|---|---|---|---|---|---|
| Organic tea Total | 287.2 | 306.8 | 324.9 | 340.0 | 418.0 | 381.0 |
| Black Tea | 67.1 | 74.6 | 80.3 | 82.9 | 101.0 | 92.1 |
| Fruit/ Herbal Tea | 158.2 | 166.7 | 175.8 | 185.7 | 227.2 | 208.3 |
| Green Tea | 61.9 | 65.5 | 68.8 | 71.5 | 89.9 | 80.7 |
| Source: Euromonitor International, 2022 | ||||||
| Category | Annual growth % 2020-2021 | CAGR* % 2016-2021 | Total growth % 2016-2021 |
|---|---|---|---|
| Organic tea Total | −8.9 | 5.8 | 32.7 |
| Black Tea | −8.8 | 6.5 | 37.3 |
| Fruit/ Herbal Tea | −8.3 | 5.7 | 31.7 |
| Green Tea | −10.2 | 5.4 | 30.4 |
|
Source: Euromonitor International, 2022 *CAGR: Compound annual growth rate |
|||
| Category | 2022 | 2023 | 2024 | 2025 | 2026 |
|---|---|---|---|---|---|
| Organic tea Total | 405.6 | 436.2 | 465.6 | 494.2 | 523.4 |
| Black Tea | 94.0 | 100.4 | 106.6 | 112.2 | 117.9 |
| Fruit/ Herbal Tea | 224.9 | 243.2 | 260.5 | 277.5 | 294.8 |
| Green Tea | 86.8 | 92.6 | 98.5 | 104.5 | 110.7 |
| Source: Euromonitor International, 2022 | |||||
| Category | Annual growth % 2021-2022 | CAGR* 2021-2026 | Total growth % 2021-2026 |
|---|---|---|---|
| Organic tea Total | 6.5 | 6.6 | 37.4 |
| Black Tea | 2.1 | 5.1 | 28.0 |
| Fruit/ Herbal Tea | 8.0 | 7.2 | 41.5 |
| Green Tea | 7.6 | 6.5 | 37.2 |
|
Source: Euromonitor International, 2022 *CAGR: Compound annual growth rate |
|||
| Company | Retail sales (US$ millions)[1] | Market share[2] % |
|---|---|---|
| Numi Inc | 23.1 | 13.4 |
| Associated British Foods Plc | 20.7 | 12.0 |
| RC Bigelow Inc | 6.6 | 3.8 |
| Others | 330.6 | 70.5 |
|
Source: Euromonitor International, 2022 1: Data for fruit and herbal tea is not available 2: Market share of the organic tea market excluding fruit and herbal tea |
||
| Company | Retail sales (US$ millions) | Market share % |
|---|---|---|
| Associated British Foods Plc | 20.7 | 22.5 |
| Numi Inc | 9.9 | 10.7 |
| Others | 61.5 | 66.8 |
| Source: Euromonitor International, 2022 | ||
| Company | Retail sales (US$ millions) | Market share % |
|---|---|---|
| Numi Inc | 13.2 | 16.4 |
| RC Bigelow Inc | 6.6 | 8.2 |
| Others | 60.9 | 75.5 |
| Source: Euromonitor International, 2022 | ||
New product launches
From 2017 to 2021, a total of 450 new organic tea products were introduced to the American market, with the greatest number of new products introduced in 2018. The most popular product claim over that period was kosher, with 304 new products bearing this claim, 67.6% of products launched over the period. Other popular claims included environmentally friendly packaging (242 claims, 53.8% of total), environmentally friendly product (217 claims, 48.2% of total), GMO free (217 claims, 48.2% of total). Traditional medicinal products launched the greatest number of products (39 launches, 8.7% of total), followed by Numi (27 launches, 6.0% of total). In 2021, the average price per product launched was US$10.65, and the average price per 100 millilitres / grams of a product launched was $19.92.
| Product attributes | Number of new products by year | Total | ||||
|---|---|---|---|---|---|---|
| 2017 | 2018 | 2019 | 2020 | 2021 | ||
| Yearly product launches | 97 | 99 | 97 | 80 | 77 | 450 |
| Top 5 claims | ||||||
| Kosher | 72 | 71 | 63 | 54 | 44 | 304 |
| Ethical - Environmentally Friendly Package | 58 | 60 | 48 | 39 | 37 | 242 |
| Ethical - Environmentally Friendly Product | 49 | 43 | 46 | 45 | 34 | 217 |
| GMO Free | 37 | 61 | 46 | 42 | 31 | 217 |
| Ethical - Recycling | 50 | 56 | 47 | 31 | 31 | 215 |
| Top 5 companies | ||||||
| Traditional Medicinals | 6 | 8 | 13 | 7 | 5 | 39 |
| Numi | 10 | 5 | 0 | 9 | 3 | 27 |
| Target | 7 | 8 | 0 | 3 | 6 | 24 |
| Rishi Tea | 1 | 5 | 1 | 10 | 2 | 19 |
| Kroger | 0 | 11 | 0 | 0 | 4 | 15 |
| Top 5 flavours (including blend) | ||||||
| Unflavoured/Plain | 22 | 23 | 18 | 15 | 12 | 90 |
| Herbs/Herbal | 6 | 11 | 13 | 3 | 2 | 35 |
| Chai (Masala/Spice) | 4 | 3 | 2 | 6 | 3 | 18 |
| Ginger | 1 | 6 | 3 | 2 | 2 | 14 |
| Chamomile/Camomile | 3 | 2 | 4 | 0 | 3 | 12 |
| Top 5 ingredients | ||||||
| Ginger (Food) | 21 | 35 | 32 | 19 | 15 | 122 |
| Licorice (Food) | 14 | 21 | 21 | 14 | 13 | 83 |
| Green Tea (Food) | 22 | 13 | 15 | 12 | 11 | 73 |
| Peppermint (Food) | 14 | 18 | 23 | 7 | 10 | 72 |
| Lemongrass (Food) | 11 | 14 | 18 | 10 | 13 | 66 |
| Top 5 package types | ||||||
| Flexible sachet | 67 | 64 | 55 | 52 | 34 | 272 |
| Rigid box | 1 | 1 | 14 | 9 | 14 | 39 |
| Flexible | 12 | 3 | 8 | 6 | 9 | 38 |
| Flexible stand-up pouch | 9 | 2 | 8 | 5 | 11 | 35 |
| Jar | 6 | 6 | 3 | 2 | 2 | 19 |
| Launch types | ||||||
| New Variety/Range Extension | 41 | 37 | 27 | 33 | 36 | 174 |
| New Product | 27 | 30 | 43 | 22 | 28 | 150 |
| New Packaging | 25 | 23 | 14 | 6 | 4 | 72 |
| Relaunch | 4 | 8 | 12 | 19 | 9 | 52 |
| New Formulation | 0 | 1 | 1 | 0 | 0 | 2 |
| Source: Mintel GNPD, 2022 | ||||||
Examples of new products
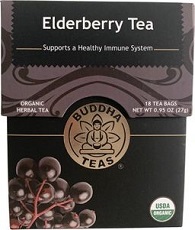
Elderberry Tea
| Company | Miyazaki Kamimizuen |
|---|---|
| Brand | Buddha Teas |
| Date published | May 2022 |
| Launch type | New variety / range extension |
| Price in US dollars | 5.18 ($19.24 per 100 millilitres / grams) |
This kosher certified herbal tea claims to be caffeine free, support immune health, and have a lingering berry flavour. This product retails in a 0.95 ounce pack, with 18 bags inside, and bearing the CCOF Organic and USDA Organic logos.
Positioning claims: Caffeine free, ethical (environmentally friendly package and product, recycling, sustainable (habitat/resources), toxin free), free from (added/artificial flavourings and preservatives), functional - immune system, GMO free, kosher, no additives/preservatives.
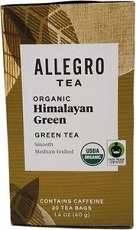
Organic Himalayan Green Tea
| Company | Allegro Coffee Company |
|---|---|
| Brand | Allegro Tea |
| Date published | July 2022 |
| Launch type | New variety / range extension |
| Price in US dollars | 4.69 ($11.82 per 100 millilitres / grams) |
This fair trade and kosher certified tea claims to have a smooth taste while being less bitter than other green teas, while retailing in a 1.4 ounce pack containing 20 tea bags.
Positioning claims: Ethical (biodegradable, environmentally friendly package and product, human, recycling, sustainable (habitat/resources)), kosher, organic.
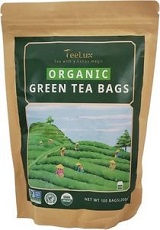
Organic Green Tea Bags
| Company | Unavailable |
|---|---|
| Brand | TeeLux |
| Date published | July 2022 |
| Launch type | New product |
| Price in US dollars | 12.99 ($6.50 per 100 millilitres / grams) |
This product claims to be a package of whole leaves that can be prepared into a soup that leaves a sweet aftertaste. The product retails in a 4.23 ounce pack containing 60 teabags, and bears the FPB, EU Organic and USDA Organic logos.
Positioning claims: Ease of use
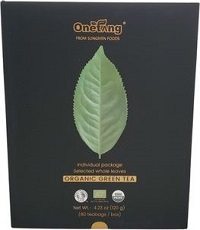
Organic Green Tea
| Company | Summit Import |
|---|---|
| Brand | Onetang from Sungiven Foods |
| Date published | July 2022 |
| Launch type | New product |
| Price in US dollars | 24.99 ($20.84 per 100 millilitres / grams) |
FGO Organic Earl Grey Loose Tea claims to be a silky, full bodied blend of tea that can be consumed hot or cold. The product retails in a 16 ounce pack that brews 200 cups of tea. The pack bears the USDA Organic, California Certified Organic Farmers, and Non GMO Project Verified logos.
Positioning claims: GMO Free
Organic Earl Grey Loose Tea
| Company | FGO |
|---|---|
| Brand | FGO |
| Date published | June 2022 |
| Launch type | New variety / range extension |
| Price in US dollars | 22.99 ($5.07 per 100 millilitres / grams) |
FGO Organic Earl Grey Loose Tea claims to be a silky, full bodied blend of tea that can be consumed hot or cold. The product retails in a 16 ounce pack that brews 200 cups of tea. The pack bears the USDA Organic, California Certified Organic Farmers, and Non GMO Project Verified logos.
Positioning claims: GMO Free.
Sleep Herbal Tea Supplement
| Company | Lidl |
|---|---|
| Brand | Lidl Organic |
| Date published | June 2022 |
| Launch type | New variety / range extension |
| Price in US dollars | 3.63 ($12.17 per 100 millilitres / grams) |
Lidl Organic Sleep Herbal Tea Supplement claims to be made with chamomile flower, passionflower herb, and valerian root. This product claims to aid in relaxation, and retails in a 1.07 ounce pack containing 16 tea bags. This product bears the USDA Organic, Facebook, Twitter, and Instagram logos.
Positioning claims: Caffeine free, functional (stress and sleep), GMO free, kosher, social media.
Tulsi Turmeric Green Tea
| Company | Vahdam Teas |
|---|---|
| Brand | Vahdam |
| Date published | May 2022 |
| Launch type | New variety / range extension |
| Price in US dollars | 5.99 ($19.93 per 100 millilitres / grams) |
Vahdam Tulsi Turmeric Grean Tea claims to be a green tea with basil that is fair trade. This product retails in a 1.06 ounce pack containing 15 tea bags. This product bears the Climate Neutral Certified, Certified Plastic Neutral Product, USDA Organic, Non GMO Project Verified, Ecocert, India Organic and Jaivik Bharat logos.
Positioning claims: All natural product, carbon neutral, ethical (charity, environmentally friendly package and product, human, recycling, sustainable (habitat/resources)), GMO free.
Berry DeTox Herbal Supplement Tea
| Company | East West Tea |
|---|---|
| Brand | Yogi |
| Date published | April 2022 |
| Launch type | New packaging |
| Price in US dollars | 3.99 ($12.57 per 100 millilitres / grams) |
Yogi Berry DeTox Herbal Supplement Tea claims to be a light, fruity, and traditionally blended product that supposedly aids in cleansing. This product retails in a 1.12 ounce pack which contains 16 tea bags.
Positioning claims: Caffeine free, ethical (biodegradable, environmentally friendly package and product, human, recycling), functional (digestive), GMO free, kosher, vegan/no animal ingredients.
Blueberry Slim Life Green Tea
| Company | East West Tea |
|---|---|
| Brand | Yogi |
| Date published | April 2022 |
| Launch type | New packaging |
| Price in US dollars | 3.99 ($12.57 per 100 millilitres / grams) |
Yogi Blueberry Slim Life Green Tea claims to be an herbal supplement meant to be taken while dieting or to boost stamina. This product retails in a 1.12 ounce pack containing 16 tea bags. This product bears the QAI, USDA Organic, and Non GMO Project Verified logos.
Positioning claims: Ethical (biodegradable, environmentally friendly package and product, human, recycling), functional (brain and nervous system, energy, slimming), GMO free, kosher, vegan/no animal ingredients.
Ginger Turmeric Herbal Tea
| Company | Lidl |
|---|---|
| Brand | Lidl Organic |
| Date published | March 2022 |
| Launch type | New variety / range extension |
| Price in US dollars | 2.99 ($6.59 per 100 millilitres / grams) |
Lidl Organic Ginger Turmeric Herbal Tea claims to be a full body herbal tea with ginger, turmeric, orange peel and black pepper. This product retails in a 1.6 ounce pack containing 20 tea bags. This product bears the USDA Organic, Facebook, Twitter, and Instagram logos.
Positioning claims: Caffeine free, GMO free, kosher, social media
For more information
The Canadian Trade Commissioner Service:
International Trade Commissioners can provide Canadian industry with on-the-ground expertise regarding market potential, current conditions and local business contacts, and are an excellent point of contact for export advice.
More agri-food market intelligence:
International agri-food market intelligence
Discover global agriculture and food opportunities, the complete library of Global Analysis reports, market trends and forecasts, and information on Canada's free trade agreements.
Agri-food market intelligence service
Canadian agri-food and seafood businesses can take advantage of a customized service of reports and analysis, and join our email subscription service to have the latest reports delivered directly to their inbox.
More on Canada's agriculture and agri-food sectors:
Canada's agriculture sectors
Information on the agriculture industry by sector. Data on international markets. Initiatives to support awareness of the industry in Canada. How the department engages with the industry.
For additional information on upcoming trade shows, please contact:
Ben Berry, Deputy Director
Trade Show Strategy and Delivery
Agriculture and agri-food Canada
ben.berry@agr.gc.ca
Resources
- Euromonitor International. Organic Beverages in the US, January 2022
- Euromonitor International. Tea in the US, January 2022
- Mintel Global New Products Database, 2022
- Canadian Food Inspection Agency. Canada-United States Organic Equivalency Arrangement, June 2009
Health and Wellness Series – Organic tea trends in the United States – Focus on top five markets
Global Analysis Report
Prepared by: Brendan Dwyer, Student (Co-op)
© His Majesty the King in Right of Canada, represented by the Minister of Agriculture and Agri-Food (2023).
Photo credits
All photographs reproduced in this publication are used by permission of the rights holders.
All images, unless otherwise noted, are copyright His Majesty the King in Right of Canada.
To join our distribution list or to suggest additional report topics or markets, please contact:
Agriculture and Agri-Food Canada, Global Analysis1341 Baseline Rd, Tower 5, 3rd floor
Ottawa ON K1A 0C5
Canada
Email: aafc.mas-sam.aac@agr.gc.ca
The Government of Canada has prepared this report based on primary and secondary sources of information. Although every effort has been made to ensure that the information is accurate, Agriculture and Agri-Food Canada (AAFC) assumes no liability for any actions taken based on the information contained herein.
Reproduction or redistribution of this document, in whole or in part, must include acknowledgement of agriculture and agri-food Canada as the owner of the copyright in the document, through a reference citing AAFC, the title of the document and the year. Where the reproduction or redistribution includes data from this document, it must also include an acknowledgement of the specific data source(s), as noted in this document.
Agriculture and Agri-Food Canada provides this document and other report services to agriculture and food industry clients free of charge.