

Note: This report includes forecasting data that is based on baseline historical data.
Executive summary
Japan was the fifth largest global retail sales market for baked goods with values of US$24.7 billion, representing a 5.0% market share in 2023. Japan experienced an increase in compound annual growth rate (CAGR) of 2.9% as retail sales grew from US$21.4 billion in 2018 and are expected to further improve with an increase in CAGR of 1.8% in the forecast period as retail sales are anticipated to reach US$27.0 billion by 2028.
In 2022, Japan was the twentieth largest global market for baked goods with imports of US$529.9 million (1.1% market share), 118.2 million kilograms in 2022, increasing in CAGR by 7.2% from US$373.9 million, 94.4 million kilograms in 2017.
Canada was Japan's sixteenth largest supplier of baked goods providing US$6.2 million (1.2% market share), 1.3 million kilograms in 2022, representing a decline in CAGR of 2.9% from US$7.2 million in 2017. Top baked goods imports from Canada included bread, pastry, cakes and biscuits (HS code: 190590) valued at US$6.2 million (99.0% market share), 1.3 million kilograms, and rusks, toasted bread (HS code 190540) with values of US$53,098 (0.9% market share), 3,510 kilograms.
The top baked goods categories in Japan, in terms of retail value sales in 2023, were pastries, with values of US$10.2 billion (41.3% market share), followed by cakes with values of US$9.6 billion (38.9% market share), and bread, with values of US$4.5 billion (18.1% market share). Of interest, frozen baked goods experienced the greatest performance within the historic period, as retail sales of the segment grew 9.3% from US$19.4 million in 2018 to US$30.2 million in 2023.
Japan's top five baked goods companies (Yamazaki Baking Co Ltd, Fuji Baking Co Ltd, Shikishima Baking Co Ltd, Kobeya Baking Co Ltd and Lotte Group) represented a combined market share of 42.7% in 2023.
According to Mintel's Global New Products Database (GNPD), there were 11,389 new bakery products launched in Japan from January 2018 to November 2023.
The predominant sub-categories of new bakery products released were cakes, pastries and sweet goods (7,790 products), sweet biscuits/cookies (2,342 products) and bread and bread products (861 products).
Global trade overview of bakery (baked goods) product imports
The global market for baked goods has experienced positive value growth with a moderate compound annual growth rate (CAGR) of 7.3% as imports increased from US$32.7 billion, (11.2 billion kilograms) in 2017 to US$46.5 billion, (14.0 billion kilograms) in 2022. The United States (U.S) was the largest global market for baked goods in 2022 with imports valued at US$9.8 billion, (21.1% market share), 2.4 billion kilograms, representing a substantial increase in CAGR of 13.9% from US$5.1 billion in 2017, followed by the United Kingdom (U.K) with imports valued at US$3.6 billion (7.8% market share), 1.1 billion kilograms, and an increase in CAGR of 8.3% from US$2.4 billion (880.8 million kilograms) in 2017 and Germany, with import values of US$3.1 billion (6.8% market share), 1.0 billion kilograms, in 2022.
Japan was the twentieth largest (after the Czech Republic and Portugal) global market for baked goods with imports of US$529.9 million (1.1% market share), 118.2 million kilograms in 2022, increasing in CAGR by 7.2% from US$373.9 million, 94.4 million kilograms in 2017. Canada in comparison, was the fifth largest global market for baked goods with import values of US$2.0 billion (4.4% market share), 509.9 million kilograms in 2022, representing a moderate increase in CAGR of 6.5% from imports of US$1.5 billion, (491.7 million kilograms) in 2017.
| Country | 2017 | 2018 | 2019 | 2020 | 2021 | 2022 | CAGR* % 2017-2022 | Market share % in 2022 |
|---|---|---|---|---|---|---|---|---|
| World total | 32,672.9 | 35,513.8 | 37,076.4 | 37,250.5 | 42,891.6 | 46,505.6 | 7.3 | 100.0 |
| United States | 5,120.2 | 5,722.6 | 6,172.5 | 6,445.4 | 7,808.5 | 9,828.8 | 13.9 | 21.1 |
| United Kingdom | 2,421.5 | 2,612.2 | 2,747.8 | 2,766.0 | 2,787.4 | 3,610.0 | 8.3 | 7.8 |
| Germany | 2,294.6 | 2,473.0 | 2,556.0 | 2,710.8 | 3,068.0 | 3,141.7 | 6.5 | 6.8 |
| France | 2,260.7 | 2,365.2 | 2,377.9 | 2,357.0 | 2,669.0 | 2,689.3 | 3.5 | 5.8 |
| Canada (5) | 1,485.3 | 1,554.8 | 1,635.3 | 1,655.1 | 1,762.0 | 2,036.6 | 6.5 | 4.4 |
| Netherlands | 1,235.5 | 1,410.3 | 1,451.9 | 1,470.8 | 1,753.5 | 1,853.0 | 8.4 | 4.0 |
| Belgium | 1,147.6 | 1,228.2 | 1,191.8 | 1,139.6 | 1,478.7 | 1,566.5 | 6.4 | 3.4 |
| Italy | 950.0 | 993.4 | 960.7 | 932.2 | 1,053.6 | 1,118.6 | 3.3 | 2.4 |
| Spain | 746.9 | 845.9 | 874.0 | 777.5 | 925.4 | 999.0 | 6.0 | 2.1 |
| Australia | 637.5 | 698.9 | 762.9 | 779.5 | 890.9 | 996.2 | 9.3 | 2.1 |
| Japan (20) | 373.9 | 389.4 | 417.7 | 423.5 | 490.8 | 529.9 | 7.2 | 1.1 |
|
Source: Global Trade Tracker, 2023 1: For the purpose of this report, baked goods are defined using HS code 1905 *CAGR: Compound Annual Growth Rate |
||||||||
| Country | 2017 | 2018 | 2019 | 2020 | 2021 | 2022 | CAGR* % 2017-2022 | Market share % in 2022 |
|---|---|---|---|---|---|---|---|---|
| World total | 11,211.7 | 11,985.1 | 12,549.9 | 13,431.7 | 13,577.7 | 14,008.8 | 4.6 | 100.0 |
| United States | 1,563.7 | 1,724.5 | 1,833.3 | 1,939.4 | 2,181.7 | 2,425.9 | 9.2 | 17.3 |
| United Kingdom | 880.8 | 897.5 | 964.1 | 977.0 | 863.7 | 1,064.1 | 3.9 | 7.6 |
| Germany | 794.9 | 828.4 | 899.7 | 923.5 | 993.2 | 1,035.6 | 5.4 | 7.4 |
| France | 753.2 | 752.1 | 772.5 | 786.3 | 863.9 | 871.8 | 3.0 | 6.2 |
| Netherlands | 424.0 | 457.3 | 537.1 | 594.2 | 656.5 | 786.2 | 13.1 | 5.6 |
| Belgium | 439.6 | 456.9 | 441.7 | 397.5 | 512.9 | 562.3 | 5.0 | 4.0 |
| Canada (7) | 491.7 | 508.0 | 519.2 | 505.3 | 498.0 | 509.9 | 0.7 | 3.6 |
| Italy | 334.0 | 326.2 | 338.7 | 319.0 | 347.1 | 366.2 | 1.9 | 2.6 |
| Spain | 248.9 | 261.8 | 290.7 | 267.9 | 304.9 | 337.6 | 6.3 | 2.4 |
| Austria | 219.9 | 232.9 | 254.7 | 244.1 | 257.0 | 260.0 | 3.4 | 1.9 |
| Japan (26) | 94.4 | 97.0 | 104.7 | 105.9 | 114.6 | 118.2 | 4.6 | 0.8 |
|
Source: Global Trade Tracker, 2023 1: For the purpose of this report, baked goods are defined using HS code 1905 *CAGR: Compound Annual Growth Rate |
||||||||
Japan's trade overview of baked good imports
Japan is a net importer of baked goods products. In 2022, Japan imported US$529.9 million and exported US$403.3 million of baked goods, recording a trade deficit of US$126.6 million. The top three suppliers of baked goods to Japan were China with values of US$107.9 million (20.4% market share), 31.9 million kilograms, followed by Malaysia with values of US$58.0 million (10.9% market share), 13.9 million kilograms, and the United States (U.S) with values of US$56.5 million (10.7% market share), 11.8 million kilograms in 2022. Canada in comparison, was Japan's sixteenth largest supplier of baked goods providing US$6.2 million (1.2% market share), 1.3 million kilograms in 2022, representing a decline in CAGR of 2.9% from US$7.2 million in 2017.
| Partner countries | 2017 | 2018 | 2019 | 2020 | 2021 | 2022 | CAGR* % 2017-2022 | Market share % in 2022 |
|---|---|---|---|---|---|---|---|---|
| World total | 373.9 | 389.4 | 417.7 | 423.5 | 490.8 | 529.9 | 7.2 | 100.0 |
| China | 102.5 | 101.2 | 104.0 | 95.7 | 101.9 | 107.9 | 1.0 | 20.4 |
| Malaysia | 49.7 | 50.0 | 52.7 | 54.8 | 52.5 | 58.0 | 3.1 | 10.9 |
| United States | 41.5 | 41.0 | 39.3 | 34.1 | 44.8 | 56.5 | 6.4 | 10.7 |
| France | 20.3 | 22.8 | 33.9 | 33.0 | 50.1 | 56.2 | 22.5 | 10.6 |
| Viet-Nam | 18.1 | 21.7 | 24.8 | 26.9 | 26.4 | 32.4 | 12.4 | 6.1 |
| Indonesia | 13.2 | 14.8 | 15.6 | 19.9 | 21.4 | 27.7 | 16.0 | 5.2 |
| Italy | 18.5 | 17.2 | 20.9 | 25.2 | 28.1 | 26.8 | 7.7 | 5.1 |
| Korea | 10.5 | 9.9 | 12.1 | 14.5 | 18.7 | 22.1 | 15.9 | 4.2 |
| Belgium | 9.3 | 13.2 | 14.9 | 18.8 | 21.9 | 20.7 | 17.3 | 3.9 |
| Thailand | 27.0 | 26.9 | 26.6 | 26.3 | 23.2 | 20.7 | −5.2 | 3.9 |
| Canada (16) | 7.2 | 5.7 | 6.8 | 6.2 | 7.4 | 6.2 | −2.9 | 1.2 |
|
Source: Global Trade Tracker, 2023 *CAGR: Compound Annual Growth Rate |
||||||||
| Partner countries | 2017 | 2018 | 2019 | 2020 | 2021 | 2022 | CAGR* % 2017-2022 | Market share % in 2022 |
|---|---|---|---|---|---|---|---|---|
| World total | 94.4 | 97.0 | 104.7 | 105.9 | 114.6 | 118.2 | 4.6 | 100.0 |
| China | 32.8 | 31.6 | 32.6 | 30.5 | 31.9 | 31.9 | −0.6 | 26.9 |
| Malaysia | 10.5 | 10.8 | 11.7 | 12.5 | 12.5 | 13.9 | 5.7 | 11.8 |
| United States | 11.8 | 11.6 | 10.8 | 10.4 | 11.5 | 11.8 | 0.0 | 9.9 |
| Indonesia | 5.1 | 6.0 | 6.1 | 7.5 | 7.1 | 8.3 | 10.0 | 7.0 |
| Viet-Nam | 5.3 | 6.6 | 7.3 | 7.7 | 7.3 | 8.2 | 9.1 | 7.0 |
| France | 3.0 | 3.2 | 6.2 | 5.6 | 7.0 | 7.9 | 21.4 | 6.7 |
| Italy | 3.6 | 3.2 | 3.9 | 4.2 | 5.1 | 5.4 | 8.5 | 4.6 |
| Korea | 2.0 | 1.9 | 2.4 | 3.1 | 4.2 | 5.1 | 20.3 | 4.3 |
| Thailand | 6.9 | 6.3 | 6.2 | 6.1 | 5.2 | 4.7 | −7.2 | 4.0 |
| Belgium | 1.9 | 2.9 | 4.3 | 4.9 | 5.0 | 4.3 | 18.1 | 3.7 |
| Canada (14) | 1.5 | 1.2 | 1.6 | 1.4 | 1.7 | 1.3 | −2.1 | 1.1 |
|
Source: Global Trade Tracker, 2023 *CAGR: Compound Annual Growth Rate |
||||||||
Of Japan's baked good imports, bread, pastry, cakes and biscuits (HS code: 190590) were the largest segment with values of US$506.1 million (95.5% market share), 113.8 million kilograms, followed by waffles and wafers (HS code: 190532) with values of US$20.5 million (3.9% market share), 3.9 million kilograms and rusks, toasted bread (HS code: 190540) with values of US$2.2 million (0.4% market share), 352,579 kilograms, in 2022. Of note, Canada has attained measurable market representation in most of Japan's baked goods imports (with the exception of gingerbread and sweet biscuits), particularly with rusks (toasted bread) imports, which Canada's supply represented 2.4% of the market share in 2022.
| HS Code | Description | Import value (US$) | Import volume (kilograms) | Top suppliers and market value share % | Canada's value share % | ||
|---|---|---|---|---|---|---|---|
| 1 | 2 | 3 | |||||
| Baked goods total (HS code 1905) | 529,949,877 | 118,215,845 | China: 20.4 | Malaysia: 10.9 | United States: 10.7 | 1.2 | |
| 190590 | Bread, pastry, cakes and biscuits | 506,124,744 | 113,780,660 | China: 21.2 | Malaysia: 11.2 | United States: 11.1 | 1.2 |
| 190532 | Waffles and wafers | 20,494,569 | 3,920,690 | Belgium: 55.3 | Italy: 17.0 | Malaysia: 5.7 | 0.03 |
| 190540 | Rusks, toasted bread | 2,203,529 | 352,579 | Thailand: 20.7 | Spain: 16.5 | China: 13.8 | 2.4 |
| 190510 | Crispbread | 615,157 | 66,040 | Norway: 77.7 | Australia: 15.8 | Switzerland: 4.2 | 0.6 |
| 190520 | Gingerbread | 416,947 | 82,574 | Sweden: 52.4 | Sri Lanka: 19.5 | Germany: 15.8 | |
| 190531 | Sweet biscuits | 94,931 | 13,302 | France: 52.8 | Brazil: 20.5 | Italy: 18.4 | |
| Source: Global Trade Tracker, 2023 | |||||||
Canada's performance
Japan's baked goods imports from Canada
Japan was the twentieth largest global market for baked good products with imports of US$529.9 million (1.1% market share), 118.2 million kilograms in 2022. Of these imports, Canada was the sixteenth largest supplier to Japan (representing a 1.2% market share) with imports valued at US$6.2 million (−2.9% from US$7.2 million in 2017), 1.3 million kilograms in 2022.
Top baked goods imports from Canada included bread, pastry, cakes and biscuits (HS code: 190590) valued at US$6.2 million (99.0% market share), 1.3 million kilograms, followed by rusks, toasted bread (HS code 190540) with values of US$53,098 (0.9% market share), 3,510 kilograms and waffles and wafers (HS code: 190532) with values of US$5,658 (0.1% market share), 329 kilograms.
| HS Code | Description | Import value (US$) | Import volume (kilograms) | Market value share % |
|---|---|---|---|---|
| Baked goods total (HS code 1905) | 6,215,296 | 1,341,388 | 100.0 | |
| 190590 | bread, pastry, cakes and biscuits | 6,153,089 | 1,337,369 | 99.0 |
| 190540 | rusks, toasted bread | 53,098 | 3,510 | 0.9 |
| 190532 | waffles and wafers | 5,658 | 329 | 0.1 |
| 190510 | crispbread | 3,451 | 180 | 0.1 |
| Source: Global Trade Tracker, 2023 | ||||
| Category | 2017 | 2018 | 2019 | 2020 | 2021 | 2022 | CAGR* % 2017-2022 |
|---|---|---|---|---|---|---|---|
| Japan imports from the World | 373.9 | 389.4 | 417.7 | 423.5 | 490.8 | 529.9 | 7.2 |
| Japan imports from Canada | 7.2 | 5.7 | 6.8 | 6.2 | 7.4 | 6.2 | −2.9 |
| Supply gap | 366.7 | 383.7 | 410.9 | 417.3 | 483.4 | 523.7 | 7.4 |
|
Source: Global Trade Tracker, 2023 *CAGR: Compound Annual Growth Rate |
|||||||
Canada's export market
Canada, unlike Japan, is a net exporter of baked goods products. In 2022, Canada enjoyed a baked goods product trade surplus of US$2.7 billion with imports of US$2.0 billion, and exports valued at US$4.7 billion (+13.9% from exports of US$2.4 billion in 2017). Of interest, Canada was the second largest (after Germany) global exporter of baked goods in 2022.
Canada's top baked goods products exported to global markets included bread, pastry, cakes and biscuits (HS code: 190590) with values of US$3.4 billion (72.1% market share), 711.6 million kilograms, sweet biscuits (HS code: 190531) with values of US$551.7 million (11.9% market share), 108.1 million kilograms and waffles and wafers (HS code: 190532) valued at US$469.3 million (10.1% market share), 75.0 million kilograms in 2022.
The U.S was the largest market for Canadian baked goods product exports with values of US$4.5 billion (97.0% market share), 911.2 million kilograms, followed by the U.K with values of US$44.8 million (1.0% market share), 14.4 million kilograms and Mexico with values of US$34.8 million (0.8% market share), 4.0 million kilograms in 2022. Japan in comparison, was the fifth largest export market for Canadian baked goods products with values of US$7.5 million (0.2% market share), 2.2 million kilograms in 2022.
| Country | Export value (US$ M) | Export volume (kilograms) | Market value share % in 2022 |
|---|---|---|---|
| Global total | 4,656,420,063 | 947,207,451 | 100.0 |
| United States | 4,518,211,999 | 911,221,123 | 97.0 |
| United Kingdom | 44,774,526 | 14,393,587 | 1.0 |
| Mexico | 34,805,424 | 3,979,942 | 0.8 |
| Australia | 12,122,668 | 3,036,933 | 0.3 |
| Japan (5) | 7,474,612 | 2,160,743 | 0.2 |
| Korea | 3,648,156 | 1,284,563 | 0.1 |
| Ireland | 3,638,371 | 1,286,698 | 0.1 |
| Saudi Arabia | 3,056,585 | 598,908 | 0.1 |
| Philippines | 2,076,951 | 489,361 | 0.04 |
| Costa Rica | 1,968,648 | 1,286,136 | 0.04 |
| Source: Global Trade Tracker, 2023 | |||
The province of Ontario was predominant in supplying baked good products to Japan, occupying a 52.5% market share, followed by British Columbia with a 31.5% market share and Québec, representing a 16.0% market share in 2022. Bread, pastry, cakes and biscuits (HS code: 190590) was the largest baked goods segment exported to Japan with values of US$5.1 million (68.8% market share), 1.4 million kilograms, followed by sweet biscuits (HS code 190531) with values of US$1.7 million (23.3% market share), 406,946 kilograms and crispbread (HS code 190510) with values of US$541,426 (7.2% market share), 337,704 kilograms in 2022.
| HS Code | Description | Export value (US$) | Export volume (kilograms) | Top provincial suppliers and market value share % | ||
|---|---|---|---|---|---|---|
| Baked goods total (HS code 1905) | 7,474,612 | 2,160,743 | Ontario: 52.5 | British Columbia: 31.5 | Québec: 16.0 | |
| 190590 | bread, pastry, cakes, biscuits | 5,143,241 | 1,405,049 | Ontario: 92.2 | Québec: 6.9 | British Columbia: 0.9 |
| 190531 | sweet biscuits | 1,742,863 | 406,946 | Ontario: 68.9 | Québec: 23.8 | British Columbia: 7.4 |
| 190510 | crispbread | 541,426 | 337,704 | Ontario: 100.0 | ||
| 190540 | rusks, toasted bread | 42,449 | 10,360 | British Columbia: 54.7 | Ontario: 45.3 | |
| 190532 | waffles and wafers | 4,634 | 684 | Ontario: 100.0 | ||
| Source: Global Trade Tracker, 2023 | ||||||
Retail markets
Global retail sales overview of bakery products (baked goods)
Global retail sales of baked goods have increased moderately in CAGR by 7.9% from US$334.7 billion in 2018 to US$489.4 billion in 2023 and are expected to increase at an additional CAGR of 7.6% as retail sales attain US$706.4 billion by 2028. The United States (U.S) was the largest global market for baked goods with retail sales of US$98.1 billion (20.0% market share), followed by China with values of US$36.6 billion (7.5% market share) and Mexico, with retail sales of US$29.4 billion (6.0% market share) in 2023.
Japan was the fifth largest global retail sales market for baked goods with values of US$24.7 billion, representing a 5.0% market share in 2023. Japan experienced an increase in CAGR of 2.9% as retail sales grew from US$21.4 billion in 2018 and are expected to further improve with an increase in CAGR of 1.8% in the forecast period as retail sales are anticipated to reach US$27.0 billion by 2028. In comparison, Canada was the twelfth largest retail sales market for baked goods, accounting for a 1.7% retail sale market share with values of US$8.3 billion in 2023, representing an increase of 7.0% from US$5.9 billion in 2018. Similarly, Canada is also expected to achieve positive growth, increasing by 3.2% in the forecast period as retail sales attain US$9.7 billion by 2028. Of note, Türkiye is anticipated to experience the largest increase in CAGR (19.7%) in the forecast period as retail sales of baked goods reach US$40.4 billion by 2028.
| Geography | 2018 | 2023 | CAGR* % 2018-2023 | 2024 | 2028 | CAGR* % 2023-2028 |
|---|---|---|---|---|---|---|
| World | 334,711.3 | 489,447.1 | 7.9 | 529,704.9 | 706,411.4 | 7.6 |
| United States | 65,951.7 | 98,127.0 | 8.3 | 107,147.3 | 132,582.9 | 6.2 |
| China | 30,251.4 | 36,620.7 | 3.9 | 39,075.8 | 48,918.2 | 6.0 |
| Mexico | 18,965.0 | 29,416.9 | 9.2 | 31,517.6 | 39,813.3 | 6.2 |
| Brazil | 17,460.0 | 28,979.2 | 10.7 | 31,999.4 | 43,864.7 | 8.6 |
| Japan (5) | 21,364.8 | 24,692.1 | 2.9 | 25,316.6 | 27,044.4 | 1.8 |
| Italy | 18,669.3 | 24,534.9 | 5.6 | 25,672.6 | 29,629.6 | 3.8 |
| Germany | 17,019.0 | 21,907.0 | 5.2 | 21,097.5 | 22,874.0 | 0.9 |
| France | 15,276.8 | 18,731.7 | 4.2 | 19,438.7 | 21,525.9 | 2.8 |
| Türkiye | 2,362.4 | 16,470.4 | 47.5 | 21,071.4 | 40,418.3 | 19.7 |
| United Kingdom | 9,203.5 | 11,088.7 | 3.8 | 11,566.0 | 13,581.9 | 4.1 |
| Canada (12) | 5,932.7 | 8,320.7 | 7.0 | 8,547.2 | 9,719.9 | 3.2 |
|
Source: Euromonitor International, 2023 1: Baked goods (as defined by Euromonitor International), the aggregation of bread, pastries, dessert mixes, frozen baked goods and cakes. Note: Baked goods from in-store bakeries are classified under unpackaged/artisanal, not packaged/industrial. *CAGR: Compound Annual Growth Rate |
||||||
Retail sales overview of bakery products (baked goods) in Japan
Retail sales of baked goods in Japan were valued at US$24.7 billion in 2023. During the 2018-2023 period, this market grew at a CAGR of 2.9% from US$21.4 billion in 2017 (−1.3% from 2019-2020). Between 2020-2021, the market increased by 4.8%, and most recently, increased by a further 6.2% from 2022 −2023 (as retail sales grew from US$23.2 billion in 2022). Baked goods are expected to experience continued growth in value sales in 2023 (as volume sales remain relatively stagnant), largely driven by unit price increases (and rising production costs due to increases in the selling price of imported wheat by the Japanese government). In addition to increasing prices of imported wheat, an avian flu outbreak in the first half of 2023 also led to an egg shortage, increasing egg prices and effecting production costs, especially for cakes (Euromonitor International; Baked Goods in Japan, November 2023).
The top baked goods categories in Japan, in terms of retail value sales in 2023, were pastries, with values of US$10.2 billion (41.3% market share) increasing at a CAGR of 3.0% from US$8.8 billion in 2018, followed by cakes with values of US$9.6 billion (38.9% market share), representing an increase in CAGR of 3.2% from US$8.2 billion in 2018 and bread, with values of US$4.5 billion (18.1% market share), increasing in CAGR by 2.1% from US$4.0 billion in 2018. Of interest, frozen baked goods experienced the greatest performance within the historic period, as retail sales of the segment grew 9.3% from US$19.4 million in 2018 to US$30.2 million in 2023.
Growth in Japan's baked goods category is expected to remain positive at 1.8%, as retail value sales are projected to reach US$27.0 billion by 2028. In contrast, retail volume growth of baked goods is likely to remain limited over the forecast period due to the country's declining population. Given this demographic shift, baked goods manufacturers are expected to sustain sales through the provision of premium value-added and health-oriented product lines that are also budget conscious. For example, manufacturer Shikishima Baking introduced a healthier version of leavened bread with sprouted brown and black rice in 2023 (Euromonitor International; Baked Goods in Japan, November 2023). Further, the importance of domestic wheat and food self-sufficiency has also been increasing in Japan. The country's Ministry of Agriculture, Forestry and Fisheries seeks to increase Japan's wheat production area by 9.0% by 2030. However, as baked goods products made with domestic wheat are generally priced higher (as domestic production quantity is limited by the country's rainy seasons) than those made with imported wheat; promotional activities that convey the taste and safety of domestically grown wheat are likely to remain a necessity in order to support both retail value and volume sales in the forecast period (Euromonitor International; Baked Goods in Japan, November 2023).
| Category | 2018 | 2023 | CAGR* % 2018-2023 | 2024 | 2028 | CAGR* % 2023-2028 |
|---|---|---|---|---|---|---|
| Baked Goods | 21,364.8 | 24,692.1 | 2.9 | 25,316.6 | 27,044.4 | 1.8 |
| Bread | 4,020.6 | 4,466.3 | 2.1 | 4,614.8 | 4,997.0 | 2.3 |
| Cakes | 8,211.8 | 9,604.1 | 3.2 | 9,929.2 | 10,868.0 | 2.5 |
| Dessert Mixes | 110.7 | 127.0 | 2.8 | 128.0 | 130.7 | 0.6 |
| Frozen Baked Goods | 19.4 | 30.2 | 9.3 | 30.9 | 33.4 | 2.0 |
| Pastries | 8,781.1 | 10,189.8 | 3.0 | 10,329.8 | 10,704.9 | 1.0 |
| Dessert Pies and Tarts | 221.1 | 274.6 | 4.4 | 283.9 | 310.4 | 2.5 |
|
Source: Euromonitor International, 2023 *CAGR: Compound Annual Growth Rate |
||||||
Competitive landscape
Japan's baked goods market remained a highly fragmented industry in 2023. The top five baked goods companies (Yamazaki Baking Co Ltd, Fuji Baking Co Ltd, Shikishima Baking Co Ltd, Kobeya Baking Co Ltd and Lotte Group) represented a combined market share of 42.7% in 2023.
In terms of retail sales, Yamazaki Baking Co Ltd (top Brand names; Yamazaki, Lunch Pack, Mini Pan, Royal Bread, Shokutaku Roll and Shu Cream) was the largest baked goods company in Japan with values of US$6.1 billion (24.8% market share). The company's success can be attributed to its extensive product portfolio and price range that accommodate the requirements of price-sensitive consumer. Fuji Baking Co Ltd (Brand names; Fuji Baking, onjikomi and Neo), Japan's second largest baked goods company, attained retail values of US$1.8 billion (7.5% market share) in 2023.
Private label companies in comparison, continue to show a measured presence in the baked goods market in Japan with retail sales of US$926.2 million (3.8% market share) in 2023, increasing in CAGR by 5.8% from retail sales of US$699.7 million in 2018, while artisanal companies represented a larger market share, attaining retail sales of US$4.6 billion (18.6% market share) in 2023, and increasing in CAGR by 0.3% from US$4.5 billion in 2018.
| Company | Retail sales (US$ millions) | Market share % |
|---|---|---|
| Total | 24,692.1 | 100.0 |
| Yamazaki Baking Co Ltd | 6,126.9 | 24.8 |
| Fuji Baking Co Ltd | 1,843.6 | 7.5 |
| Shikishima Baking Co Ltd | 1,774.0 | 7.2 |
| Kobeya Baking Co Ltd | 447.4 | 1.8 |
| Lotte Group | 340.9 | 1.4 |
| First Baking Co Ltd | 329.6 | 1.3 |
| Morinaga & Co Ltd | 260.8 | 1.1 |
| Bourbon Corp | 166.3 | 0.7 |
| Nichiryo Baking Co Ltd | 98.7 | 0.4 |
| Andersen Co Ltd | 82.6 | 0.3 |
| Artisanal | 4,590.3 | 18.6 |
| Private Label | 926.2 | 3.8 |
| Others | 7,510.3 | 30.4 |
| Source: Euromonitor International, 2023 | ||
Distribution channels
The majority of Japan's baked goods market is distributed through grocery retailers versus non-grocery retailers. Grocery retailers (offline) distribution of baked goods accounted for an 86.8% market share in 2023, decreasing slightly from 88.1% held in 2018, while grocery retailing (online, e-commerce), increased from US$638.3 million (3.0% market share) in 2018 to US$801.2 million (3.2% market share) in 2023. Further, within grocery retailers (offline), convenience stores and supermarkets were the predominant distribution channels for baked goods representing US$7.0 billion and US$6.2 billion each, with market shares of 28.4% and 24.9% respectively, and within non-grocery retailers, health and beauty specialist retailers occupied a 7.4% market share, retail sales of US$1.8 billion in 2023.
| Outlet type | 2018 | 2023 | ||
|---|---|---|---|---|
| Actual | Share % | Actual | Share % | |
| Retail Channels Total | 21,364.8 | 100.0 | 24,692.1 | 100.0 |
| Retail Offline | 20,726.5 | 97.0 | 23,890.9 | 96.8 |
| Grocery Retailers | 18,829.5 | 88.1 | 21,444.0 | 86.8 |
| Convenience Retail | 6,309.8 | 29.5 | 7,007.1 | 28.4 |
| Convenience Stores | 6,309.8 | 29.5 | 7,007.1 | 28.4 |
| Supermarkets | 5,072.9 | 23.7 | 6,157.3 | 24.9 |
| Hypermarkets | 3,006.3 | 14.1 | 3,462.9 | 14.0 |
| Warehouse Clubs | 131.7 | 0.6 | 155.2 | 0.6 |
| Food/drink/tobacco specialists | 4,039.7 | 18.9 | 4,366.3 | 17.7 |
| Small Local Grocers | 269.2 | 1.3 | 295.3 | 1.2 |
| Non-Grocery Retailers | 1,897.0 | 8.9 | 2,446.8 | 9.9 |
| General Merchandise Stores | 624.6 | 2.9 | 625.5 | 2.5 |
| Health and Beauty Specialists | 1,272.4 | 6.0 | 1,819.3 | 7.4 |
| Other Non-Grocery Retailers | 2.0 | 0.0 | ||
| Retail E-Commerce | 638.3 | 3.0 | 801.2 | 3.2 |
| Source: Euromonitor International, 2023 | ||||
Market segmentation
Bread
Bread was the third largest category in Japan's baked goods market with retail value sales of US$4.5 billion (18.1% market share) in 2023. The category grew at a measurable CAGR of 2.1% during the 2018-2023 period, increasing in retail sales from US$4.0 billion in 2018.
Leavened bread was the largest bread segment with retail value sales of US$4.5 billion (99.7% of bread market share) in 2023. Of the leavened bread segment, unpackaged leavened bread achieved the best annual performance, increasing in growth by 6.7% as retail sales increased from US$808.9 million in 2022 to US$863.2 million in 2023, while packaged leavened bread increased in CAGR by 2.3% from US$3.2 billion in 2018 to US$3.6 billion in 2023. Flat bread (packaged) in comparison, grew by a measurable 6.1% from US$9.8 million in 2018 to US$13.2 million in 2023 (−5.7% from US$14.0 million in 2022 to US$13.2 million in 2023).
The overall bread market is forecast to remain positive with a CAGR of 2.3% as retail sales are anticipated to reach US$5.0 billion by 2028, despite flat bread's expected marginal decline in growth by 1.2% to US$12.4 million by 2028. In the bread (flat and unleavened) market competitive landscape, Yamazaki Baking Co Ltd (Brand names: Royal Bread, Shokutaku Roll, Double Soft, Chou Houjun and Funwari Shokupan) led sales with a market share of 34.5%, followed by Shikishima Baking Co Ltd (Brand name: Choujyuku) with a market share of 19.9% and Fuji Baking Co Ltd (Brand names: Honjikomi and Neo) with a market share of 13.7% in 2023. In comparison, private label held a measured presence in the bread market attaining a 5.9% market share, while artisanal companies represented a greater share (19.3%) of the market, in 2023.
| Category | 2018 | 2019 | 2020 | 2021 | 2022 | 2023 |
|---|---|---|---|---|---|---|
| Bread | 4,020.6 | 4,064.5 | 4,107.5 | 4,067.2 | 4,259.1 | 4,466.3 |
| Flat Bread | 9.8 | 10.1 | 13.4 | 13.4 | 14.0 | 13.2 |
| Packaged Flat Bread | 9.8 | 10.1 | 13.4 | 13.4 | 14.0 | 13.2 |
| Leavened Bread | 4,010.8 | 4,054.4 | 4,094.1 | 4,053.9 | 4,245.1 | 4,453.1 |
| Packaged Leavened Bread | 3,211.0 | 3,286.6 | 3,381.2 | 3,313.5 | 3,436.2 | 3,589.9 |
| Unpackaged Leavened Bread | 799.8 | 767.8 | 713.0 | 740.4 | 808.9 | 863.2 |
| Source: Euromonitor International, 2023 | ||||||
| Category | Annual growth % 2022-2023 | CAGR* % 2018-2023 | Total growth % 2018-2023 |
|---|---|---|---|
| Bread | 4.9 | 2.1 | 11.1 |
| Flat Bread | −5.7 | 6.1 | 34.7 |
| Packaged Flat Bread | −5.7 | 6.1 | 34.7 |
| Leavened Bread | 4.9 | 2.1 | 11.0 |
| Packaged Leavened Bread | 4.5 | 2.3 | 11.8 |
| Unpackaged Leavened Bread | 6.7 | 1.5 | 7.9 |
|
Source: Euromonitor International, 2023 *CAGR: Compound Annual Growth Rate |
|||
| Company | Retail sales (US$ millions) | Market share % |
|---|---|---|
| Total | 4,466.3 | 100.0 |
| Yamazaki Baking Co Ltd | 1,540.6 | 34.5 |
| Shikishima Baking Co Ltd | 888.0 | 19.9 |
| Fuji Baking Co Ltd | 612.3 | 13.7 |
| Private Label | 262.8 | 5.9 |
| Artisanal | 863.2 | 19.3 |
| Others | 97.5 | 2.2 |
| Source: Euromonitor International, 2023 | ||
| Category | 2024 | 2025 | 2026 | 2027 | 2028 |
|---|---|---|---|---|---|
| Bread | 4,614.8 | 4,722.8 | 4,817.2 | 4,908.2 | 4,997.0 |
| Flat Bread | 12.8 | 12.6 | 12.5 | 12.4 | 12.4 |
| Packaged Flat Bread | 12.8 | 12.6 | 12.5 | 12.4 | 12.4 |
| Leavened Bread | 4,602.0 | 4,710.2 | 4,804.7 | 4,895.7 | 4,984.7 |
| Packaged Leavened Bread | 3,712.0 | 3,802.4 | 3,881.2 | 3,956.9 | 4,030.5 |
| Unpackaged Leavened Bread | 890.0 | 907.8 | 923.4 | 938.8 | 954.2 |
| Source: Euromonitor International, 2023 | |||||
| Category | Annual growth % 2023-2024 | CAGR* % 2023-2028 | Total growth % 2023-2028 |
|---|---|---|---|
| Bread | 3.3 | 2.3 | 11.9 |
| Flat Bread | −3.0 | −1.2 | −6.1 |
| Packaged Flat Bread | −3.0 | −1.2 | −6.1 |
| Leavened Bread | 3.3 | 2.3 | 11.9 |
| Packaged Leavened Bread | 3.4 | 2.3 | 12.3 |
| Unpackaged Leavened Bread | 3.1 | 2.0 | 10.5 |
|
Source: Euromonitor International, 2023 *CAGR: Compound Annual Growth Rate |
|||
Cakes
Cakes were the second largest category in Japan's baked goods market with retail value sales of US$9.6 billion (38.9% market share) in 2023. The category grew at a CAGR of 3.2% during the 2018-2023 period, increasing in retail sales from US$8.2 billion in 2018.
Packaged cakes were the largest cake segment with retail value sales of US$7.2 billion (75.1% of cake market share) in 2023, increasing in CAGR by 4.4% from US$5.8 billion in 2018. Of note, unpackaged cakes experienced the best performance of the segment, increasing in annual growth by 7.6% from US$2.2 billion in 2022 to US$2.4 in 2023.
The cake market is forecast to remain positive, albeit at a lower growth rate of 2.5%, as retail sales are anticipated to reach US$10.9 billion by 2028. In the cake market competitive landscape, Yamazaki Baking Co Ltd (Brand names: Yamazaki and Shu Cream) led sales with a market share of 18.5%, followed by Lotte Group (Brand name: Choco Pie) with a market share of 3.5% and Morinaga & Co Ltd (Brand name: Morinaga) with a market share of 2.6% in 2023. In comparison, private label represented a measured market share (3.1%), while artisanal companies represented a significant presence (24.9%) in Japan's cake market, in 2023.
| Category | 2018 | 2019 | 2020 | 2021 | 2022 | 2023 |
|---|---|---|---|---|---|---|
| Cakes | 8,211.8 | 8,087.6 | 7,931.7 | 8,545.0 | 8,979.1 | 9,604.1 |
| Packaged Cakes | 5,818.2 | 5,741.9 | 6,100.2 | 6,555.8 | 6,756.1 | 7,211.2 |
| Unpackaged Cakes | 2,393.6 | 2,345.8 | 1,831.5 | 1,989.2 | 2,223.0 | 2,392.9 |
| Source: Euromonitor International, 2023 | ||||||
| Category | Annual growth % 2022-2023 | CAGR* % 2018-2023 | Total growth % 2018-2023 |
|---|---|---|---|
| Cakes | 7.0 | 3.2 | 17.0 |
| Packaged Cakes | 6.7 | 4.4 | 23.9 |
| Unpackaged Cakes | 7.6 | 0.0 | 0.0 |
|
Source: Euromonitor International, 2023 *CAGR: Compound Annual Growth Rate |
|||
| Company | Retail sales (US$ millions) | Market share % |
|---|---|---|
| Total | 9,604.1 | 100.0 |
| Yamazaki Baking Co Ltd | 1,774.2 | 18.5 |
| Lotte Group | 340.9 | 3.5 |
| Morinaga & Co Ltd | 245.3 | 2.6 |
| Private Label | 297.9 | 3.1 |
| Artisanal | 2,392.9 | 24.9 |
| Others | 3,790.4 | 39.5 |
| Source: Euromonitor International, 2023 | ||
| Category | 2024 | 2025 | 2026 | 2027 | 2028 |
|---|---|---|---|---|---|
| Cakes | 9,929.2 | 10,177.5 | 10,400.9 | 10,640.9 | 10,868.0 |
| Packaged Cakes | 7,459.9 | 7,652.1 | 7,826.5 | 7,998.4 | 8,168.9 |
| Unpackaged Cakes | 2,469.3 | 2,525.4 | 2,574.4 | 2,642.5 | 2,699.2 |
| Source: Euromonitor International, 2023 | |||||
| Category | Annual growth % 2023-2024 | CAGR* % 2023-2028 | Total growth % 2023-2028 |
|---|---|---|---|
| Cakes | 3.4 | 2.5 | 13.2 |
| Packaged Cakes | 3.4 | 2.5 | 13.3 |
| Unpackaged Cakes | 3.2 | 2.4 | 12.8 |
|
Source: Euromonitor International, 2023 *CAGR: Compound Annual Growth Rate |
|||
Pastries
Pastries were the largest category in Japan's baked goods market with retail value sales of US$10.2 billion (41.3% market share) in 2023 due to the strong demand for the categories on-the-go products, as pastries remain a convenient and popular breakfast and lunch option amongst consumers, office workers in particular (Euromonitor International; Baked Goods in Japan, November 2023). The category grew at a moderate CAGR of 3.0% during the 2018-2023 period, increasing in retail sales from US$8.8 billion in 2018. Within the pastries category, packaged pastries were the largest segment with retail value sales of US$8.9 billion (86.9% of pastries market share) in 2023, increasing in CAGR by 3.5% from US$7.5 billion in 2018 (+6.6% from US$8.3 billion in 2022).
The pastry market is forecast to increase in CAGR by 1.0% as retail sales are anticipated to reach US$10.7 billion by 2028. In the pastry market competitive landscape, Yamazaki Baking Co Ltd (Brand names: Lunch Pack and Mini Pan) led sales with a market share of 27.1%, followed by Fuji Baking Co Ltd (Brand name: Fuji Baking) with a market share of 10.1% and Shikishima Baking Co Ltd (Brand name: Shikishima Baking) with a market share of 6.3% in 2023. In comparison, private label attained a market share representation of 3.5% while artisanal companies represented a larger presence within the Japanese pastry market, attaining a market share of 13.1% in 2023.
| Category | 2018 | 2019 | 2020 | 2021 | 2022 | 2023 |
|---|---|---|---|---|---|---|
| Pastries | 8,781.1 | 8,844.9 | 8,612.3 | 9,035.3 | 9,596.1 | 10,189.8 |
| Packaged Pastries | 7,458.6 | 7,575.3 | 7,524.0 | 7,856.3 | 8,309.2 | 8,855.7 |
| Unpackaged Pastries | 1,322.5 | 1,269.6 | 1,088.3 | 1,178.9 | 1,287.0 | 1,334.1 |
| Source: Euromonitor International, 2023 | ||||||
| Category | Annual growth % 2022-2023 | CAGR* % 2018-2023 | Total growth % 2018-2023 |
|---|---|---|---|
| Pastries | 6.2 | 3.0 | 16.0 |
| Packaged Pastries | 6.6 | 3.5 | 18.7 |
| Unpackaged Pastries | 3.7 | 0.2 | 0.9 |
|
Source: Euromonitor International, 2023 *CAGR: Compound Annual Growth Rate |
|||
| Company | Retail sales (US$ millions) | Market share % |
|---|---|---|
| Total | 10,189.8 | 100.0 |
| Yamazaki Baking Co Ltd | 2,765.7 | 27.1 |
| Fuji Baking Co Ltd | 1,025.5 | 10.1 |
| Shikishima Baking Co Ltd | 645.0 | 6.3 |
| Private Label | 357.8 | 3.5 |
| Artisanal | 1,334.1 | 13.1 |
| Others | 3,359.0 | 33.0 |
| Source: Euromonitor International, 2023 | ||
| Category | 2024 | 2025 | 2026 | 2027 | 2028 |
|---|---|---|---|---|---|
| Pastries | 10,329.8 | 10,415.2 | 10,497.7 | 10,594.8 | 10,704.9 |
| Packaged Pastries | 8,958.9 | 9,018.0 | 9,077.2 | 9,151.2 | 9,238.3 |
| Unpackaged Pastries | 1,370.9 | 1,397.3 | 1,420.5 | 1,443.6 | 1,466.7 |
| Source: Euromonitor International, 2023 | |||||
| Category | Annual growth 2023-2024 | CAGR* % 2023-2028 | Total growth % 2023-2028 |
|---|---|---|---|
| Pastries | 1.4 | 1.0 | 5.1 |
| Packaged Pastries | 1.2 | 0.8 | 4.3 |
| Unpackaged Pastries | 2.8 | 1.9 | 9.9 |
|
Source: Euromonitor International, 2023 *CAGR: Compound Annual Growth Rate |
|||
Dessert pies and tarts
The dessert pies and tarts category attained retail value sales of US$274.6 million (1.1% market share of baked goods) in 2023. The category grew at a measurable CAGR of 4.4% during the 2018-2023 period, increasing in retail sales from US$221.1 million in 2018. Sweet pies and tarts were the largest segment of the category with retail value sales of US$239.2 million (87.1% of dessert pies and tarts market share) in 2023, increasing in CAGR by 3.6% from US$200.9 million in 2018, while the frozen cakes, sweet pies and tarts segment experienced the largest increase in growth (11.8%) within the historic period as retail sales increased from US$20.3 million in 2018 to US$35.4 million in 2023 (+7.3% from US$33.0 million in 2022).
The dessert pies and tarts market are forecast to remain positive with a lower CAGR of 2.5% as retail sales increase to US$310.4 million by 2028. In the dessert pies and tarts market competitive landscape, Yamazaki Baking Co Ltd (Brand name: Yamazaki) led sales with a market share of 16.9%, followed by Shikishima Baking Co Ltd (Brand name: Shikishima Baking) with a market share of 8.5% and Nichirei Corp (Brand name: Nichirei) with a market share of 5.1% in 2023.
| Category | 2018 | 2019 | 2020 | 2021 | 2022 | 2023 |
|---|---|---|---|---|---|---|
| Dessert Pies and Tarts | 221.1 | 218.6 | 236.1 | 267.1 | 264.0 | 274.6 |
| Sweet Pies and Tarts | 200.9 | 198.2 | 210.6 | 238.1 | 230.9 | 239.2 |
| Frozen Cakes, Sweet Pies and Tarts | 20.3 | 20.4 | 25.4 | 29.0 | 33.0 | 35.4 |
| Source: Euromonitor International, 2023 | ||||||
| Category | Annual growth % 2022-2023 | CAGR* % 2018-2023 | Total growth % 2018-2023 |
|---|---|---|---|
| Dessert Pies and Tarts | 4.0 | 4.4 | 24.2 |
| Sweet Pies and Tarts | 3.6 | 3.6 | 19.1 |
| Frozen Cakes, Sweet Pies and Tarts | 7.3 | 11.8 | 74.4 |
|
Source: Euromonitor International, 2023 *CAGR: Compound Annual Growth Rate |
|||
| Company | Retail sales (US$ millions) | Market share % |
|---|---|---|
| Total | 274.6 | 100.0 |
| Yamazaki Baking Co Ltd | 46.3 | 16.9 |
| Shikishima Baking Co Ltd | 23.4 | 8.5 |
| Nichirei Corp | 13.9 | 5.1 |
| Others | 188.7 | 68.7 |
| Source: Euromonitor International, 2023 | ||
| Category | 2024 | 2025 | 2026 | 2027 | 2028 |
|---|---|---|---|---|---|
| Dessert Pies and Tarts | 283.9 | 291.5 | 298.1 | 304.4 | 310.4 |
| Sweet Pies and Tarts | 247.1 | 253.4 | 258.9 | 264.2 | 269.3 |
| Frozen Cakes, Sweet Pies and Tarts | 36.8 | 38.1 | 39.2 | 40.2 | 41.1 |
| Source: Euromonitor International, 2023 | |||||
| Category | Annual growth % 2023-2024 | CAGR* % 2023-2028 | Total growth % 2023-2028 |
|---|---|---|---|
| Dessert Pies and Tarts | 3.4 | 2.5 | 13.0 |
| Sweet Pies and Tarts | 3.3 | 2.4 | 12.6 |
| Frozen Cakes, Sweet Pies and Tarts | 4.0 | 3.0 | 16.1 |
|
Source: Euromonitor International, 2023 *CAGR: Compound Annual Growth Rate |
|||
Dessert mixes and frozen baked goods
Dessert mixes and frozen baked goods attained retail value sales of US$127.0 million (0.5% market share of baked goods) and US$30.2 million (0.1% market share of baked goods) respectively, in 2023. Dessert mixes increased in CAGR by 2.8% from US$110.7 million in 2018 (+8.5% from US$117.0 million in 2022) as manufacturers have recently increased product innovation and versatility to help mitigate declining volume sales incurred between 2021 to 2022. For example, Hagoromo Foods, a manufacturer of processed fruit and vegetables, recently launched microwavable pouch steamed cake mixes requiring minimal preparation (the addition of water), for consumption as a sweet dessert or as a main meal (with corn or beans), complementing a variety of consumption occasions (Euromonitor International; Baked Goods in Japan, November 2023). Frozen baked goods in comparison, was the greater performing category of the two, increasing in growth by 9.3% from US$19.4 million in 2018 to US$30.2 million in 2023 (+7.9% from US$28.0 million in 2022).
In the forecast period, both dessert mixes and frozen baked goods will achieve positive growth, increasing to US$130.7 million and US$33.4 million respectively, by 2028. In the dessert mix competitive landscape, House Foods Corp (Brand name: House Foods) led sales with a market share of 26.6%, followed by Nisshin Seifun Group Inc (Brand name: Nisshin Seifun) with a market share representation of 22.5% and Nippon Flour Mills Co Ltd (Brand name: Nippon), with a market share of 17.9% in 2023. In comparison, private labels represented a measured presence in the Japan dessert mixes market, attaining a market share of 5.5% in 2023. In the frozen baked goods competitive landscape, Nichirei Corp (Brand name: Nichirei) led sales with a market share of 34.1%, followed by Japan Tobacco Inc (Brand name: TableMark) with a market share of 24.8% in 2023. In comparison, private labels represented a measured presence in the Japanese frozen baked goods market, attaining a market share of 2.3% in 2023.
| Category | 2018 | 2019 | 2020 | 2021 | 2022 | 2023 |
|---|---|---|---|---|---|---|
| Dessert Mixes | 110.7 | 113.4 | 148.6 | 126.2 | 117.0 | 127.0 |
| Frozen Baked Goods | 19.4 | 19.5 | 25.6 | 25.2 | 28.0 | 30.2 |
| Source: Euromonitor International, 2023 | ||||||
| Category | Annual growth % 2022-2023 | CAGR* % 2018-2023 | Total growth % 2018-2023 |
|---|---|---|---|
| Dessert Mixes | 8.5 | 2.8 | 14.7 |
| Frozen Baked Goods | 7.9 | 9.3 | 55.7 |
|
Source: Euromonitor International, 2023 *CAGR: Compound Annual Growth Rate |
|||
| Company | Retail sales (US$ millions) | Market share % |
|---|---|---|
| Total | 127.0 | 100.0 |
| House Foods Corp | 33.8 | 26.6 |
| Nisshin Seifun Group Inc | 28.6 | 22.5 |
| Nippon Flour Mills Co Ltd | 22.7 | 17.9 |
| Private Label | 7.0 | 5.5 |
| Others | 19.4 | 15.3 |
| Source: Euromonitor International, 2023 | ||
| Company | Retail sales (US$ millions) | Market share % |
|---|---|---|
| Total | 30.2 | 100.0 |
| Nichirei Corp | 10.3 | 34.1 |
| Japan Tobacco Inc | 7.5 | 24.8 |
| Private Label | 0.7 | 2.3 |
| Others | 11.7 | 38.7 |
| Others | ||
| Source: Euromonitor International, 2023 | ||
| Category | 2024 | 2025 | 2026 | 2027 | 2028 |
|---|---|---|---|---|---|
| Dessert Mixes | 128.0 | 128.4 | 128.9 | 129.6 | 130.7 |
| Frozen Baked Goods | 30.9 | 31.6 | 32.2 | 32.8 | 33.4 |
| Source: Euromonitor International, 2023 | |||||
| Category | Annual growth % 2023-2024 | CAGR* % 2023-2028 | Total growth % 2023-2028 |
|---|---|---|---|
| Dessert Mixes | 0.8 | 0.6 | 2.9 |
| Frozen Baked Goods | 2.3 | 2.0 | 10.6 |
|
Source: Euromonitor International, 2023 *CAGR: Compound Annual Growth Rate |
|||
New product launch analysis
According to Mintel, in Asia, brands are targeting the breakfast occasion, tapping into the popularity of sweet baked goods as a food with which to start the day. Packaged bread and sweet bakery items with innovative flavours and formats that promote convenience, heath and indulgence are among the most popular weekend breakfast food options. Relatedly, brands are communicating added-value attributes on their packaging to attract money-conscious consumers (Mintel; A year of innovation in cakes, pastries and sweet goods, 2023). The biscuit and cracker consumer also appreciates new flavours such as chocolate and nut, while inherent nutrients (protein, fibre and vitamins and minerals) remain in demand (Mintel; A year of innovation in biscuits, cookies and crackers, 2023).
According to Mintel's Global New Products Database (GNPD), there were 11,389 new bakery products launched in Japan from January 2018 to November 2023. The number of yearly new product launches has decreased in growth by a CAGR of 3.5% from a launch of 2,053 bakery products in 2018 to its most recent launch of 1,778 bakery products in 2022.
The predominant sub-categories of new bakery products released were cakes, pastries and sweet goods (7,790 products), sweet biscuits/cookies (2,342 products) and bread and bread products (861 products). The most popular product claims were ethical - environmentally friendly packaging (3,001products), followed by ethical - sustainable with (2,738 products) and ethical - toxins free with (1,450 products).
The companies with the highest number of new product launches were Shikishima Baking with (1,256 products), followed by FamilyMart (1,151 products) and Lawson (993 products). Just over half (56.6%) of the new product launches were new variety/range extension (6,448 products), whereas 29.0% were relaunch products (3,308 products). Top packaging types included flexible packaging (10,094 products), tray (581 products), tub (265 products), flexible stand-up pouch (158 products) and flexible sachet (128 products). Top flavours were chocolate (1,347 products), followed by unflavoured/plain (603 products), strawberry (374 products) and cream/whipped cream (260 products).
| Product attributes | Number of new products by year | Total | |||||
|---|---|---|---|---|---|---|---|
| 2018 | 2019 | 2020 | 2021 | 2022 | 2023 (January to November) | ||
| Yearly product launches | 2,053 | 1,964 | 1,994 | 1,814 | 1,778 | 1,786 | 11,389 |
| Top 5 sub-categories | |||||||
| Cakes, pastries and sweet goods | 1,350 | 1,318 | 1,273 | 1,240 | 1,304 | 1,305 | 7,790 |
| Sweet biscuits/cookies | 465 | 415 | 461 | 376 | 305 | 320 | 2,342 |
| Bread and bread products | 154 | 171 | 188 | 125 | 110 | 113 | 861 |
| Baking ingredients and mixes | 46 | 33 | 43 | 35 | 29 | 23 | 209 |
| Savoury biscuits/crackers | 38 | 27 | 29 | 38 | 30 | 25 | 187 |
| Top 10 claims | |||||||
| Ethical - environmentally friendly package | 157 | 331 | 477 | 550 | 696 | 790 | 3,001 |
| Ethical - sustainable (habitat/resources) | 91 | 267 | 437 | 510 | 680 | 753 | 2,738 |
| Ethical - toxins free | 124 | 247 | 233 | 223 | 265 | 358 | 1,450 |
| Seasonal | 276 | 241 | 227 | 206 | 178 | 169 | 1,297 |
| Limited edition | 170 | 175 | 209 | 159 | 155 | 157 | 1,025 |
| Microwaveable | 153 | 95 | 147 | 106 | 134 | 146 | 781 |
| Ethical - environmentally friendly product | 61 | 139 | 157 | 141 | 116 | 125 | 739 |
| Cobranded | 125 | 118 | 149 | 116 | 110 | 96 | 714 |
| Premium | 106 | 124 | 102 | 90 | 126 | 141 | 689 |
| Low/reduced sugar | 39 | 61 | 46 | 64 | 73 | 36 | 319 |
| Top 10 companies | |||||||
| Shikishima Baking | 167 | 205 | 210 | 223 | 222 | 229 | 1,256 |
| FamilyMart | 170 | 218 | 232 | 202 | 135 | 194 | 1,151 |
| Lawson | 185 | 159 | 171 | 180 | 181 | 117 | 993 |
| Seven & Holdings | 124 | 168 | 138 | 118 | 148 | 183 | 879 |
| Bourbon | 131 | 103 | 126 | 109 | 76 | 85 | 630 |
| Yamazaki Baking | 78 | 80 | 57 | 66 | 102 | 128 | 511 |
| Monteur | 96 | 95 | 72 | 73 | 80 | 74 | 490 |
| First Baking | 94 | 48 | 86 | 62 | 84 | 116 | 490 |
| Ministop | 94 | 80 | 76 | 71 | 86 | 49 | 456 |
| Fujipan | 80 | 68 | 73 | 63 | 69 | 97 | 450 |
| Top product launches | |||||||
| New variety/range extension | 1,240 | 1,173 | 1,116 | 951 | 1,038 | 930 | 6,448 |
| Relaunch | 465 | 548 | 626 | 565 | 494 | 610 | 3,308 |
| New packaging | 238 | 137 | 136 | 168 | 116 | 112 | 907 |
| New product | 107 | 103 | 115 | 129 | 124 | 126 | 704 |
| New formulation | 3 | 3 | 1 | 1 | 6 | 8 | 22 |
| Top 5 Flavours (including blend) unordered | |||||||
| Chocolate | 242 | 214 | 201 | 199 | 230 | 261 | 1,347 |
| Unflavoured/plain | 112 | 99 | 102 | 97 | 97 | 96 | 603 |
| Strawberry | 71 | 63 | 64 | 53 | 66 | 57 | 374 |
| Cream/crème/whipped cream | 48 | 33 | 40 | 34 | 49 | 56 | 260 |
| Sweet potato/kumara | 40 | 38 | 33 | 39 | 33 | 38 | 221 |
| Top 5 ingredients | |||||||
| Wheat flour | 1,975 | 1,869 | 1,916 | 1,736 | 1,723 | 1,718 | 10,937 |
| White sugar | 1,978 | 1,879 | 1,905 | 1,733 | 1,696 | 1,725 | 10,916 |
| Flavouring substances | 1,821 | 1,725 | 1,748 | 1,588 | 1,607 | 1,622 | 10,111 |
| Emulsifiers | 1,813 | 1,689 | 1,759 | 1,616 | 1,600 | 1,607 | 10,084 |
| Salt | 1,732 | 1,600 | 1,667 | 1,522 | 1,469 | 1,469 | 9,459 |
| Top 5 package types | |||||||
| Flexible | 1,762 | 1,756 | 1,783 | 1,625 | 1,575 | 1,593 | 10,094 |
| Tray | 156 | 57 | 58 | 81 | 106 | 123 | 581 |
| Tub | 44 | 65 | 56 | 40 | 33 | 27 | 265 |
| Flexible stand-up pouch | 29 | 31 | 40 | 23 | 18 | 17 | 158 |
| Flexible sachet | 20 | 25 | 27 | 23 | 23 | 10 | 128 |
| Total pack size | |||||||
| 7.20 grams | 13 | 11 | 19 | 18 | 6 | 11 | 78 |
| 60.00 grams | 12 | 12 | 13 | 12 | 12 | 12 | 73 |
| 36.00 grams | 11 | 10 | 14 | 14 | 12 | 9 | 70 |
| 31.00 grams | 6 | 14 | 12 | 14 | 8 | 15 | 69 |
| 10.50 grams | 14 | 8 | 17 | 11 | 7 | 4 | 61 |
| Source: Mintel Global New Product Database (GNPD), 2023 | |||||||
| Sub-category | Number of products | Average price per product (in US$) |
|---|---|---|
| Cakes, Pastries and Sweet Goods | 7,790 | 1.65 |
| Sweet Biscuits / Cookies | 2,342 | 2.06 |
| Bread and Bread Products | 861 | 1.67 |
| Baking Ingredients and Mixes | 209 | 3.29 |
| Savoury Biscuits / Crackers | 187 | 1.51 |
| Source: Mintel Global New Product Database (GNPD), 2023 | ||
Examples of new product launches
Beni Haruka Sweet Potato Mochi Roll

Source: Mintel, 2023
| Company | Lawson |
|---|---|
| Brand | Uchi Café Aki No Sweets Collection |
| Category | Bakery |
| Sub-category | Cakes, pastries and sweet goods |
| Market | Japan |
| Store type | Convenience store |
| Date published | November 2023 |
| Launch type | Relaunch |
| Price in US dollars | 2.65 |
Uchi Café Aki No Sweets Collection Beni Haruka Sweet Potato Mochi Roll has been relaunched for Autumn 2023, and retails in a pack containing six slices. Made with Beni Haruka sweet potato paste and caramelised Beni Haruka sweet potatoes - Resealable sticker - Pack is printed with biomass ink- Launched on October 3, 2023, with a recommended retail price (RRP) of 397 yen- Logos and certifications: Biomass 10.
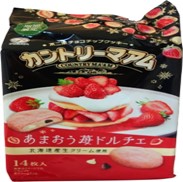
Amaou Strawberry Dolce Cookies
Source: Mintel, 2023
| Company | Fujiya |
|---|---|
| Brand | Fujiya Country Ma'am |
| Category | Bakery |
| Sub-category | Sweet biscuits / cookies |
| Market | Japan |
| Store type | Supermarket |
| Date published | December 2022 |
| Launch type | New variety / range extension |
| Price in US dollars | 2.37 |
Fujiya Country Ma'am Amaou Strawberry Dolce Cookies are now available, and retail in a pack with 14 10.5 gram packets. - Limited edition - Made with special ingredients including fresh cream from Hokkaido, and strawberry juice from hand-picked, fully ripened Amaou strawberries which are frozen to capture the peak of freshness - Can be microwaved or oven toasted - Sweet and sour Amaou strawberry taste and rich fresh cream flavour- Feature white chocolate chips and sweet chocolate chips - Recreates the flavour of strawberry dolce - Launched on November 8, 2022, with an RRP of 324 yen.
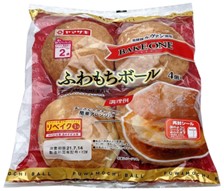
Fluffy & Chewy Rolls
Source: Mintel, 2023
| Company | Yamazaki Baking |
|---|---|
| Brand | Yamazaki Bake One |
| Category | Bakery |
| Sub-category | Bread and bread products |
| Market | Japan |
| Store type | Drug store / pharmacy |
| Date published | July 2021 |
| Launch type | New variety / range extension |
| Price in US dollars | 1.56 |
Yamazaki Bake One Fluffy & Chewy Rolls are now available. They feature a sourdough starter and are said to be perfect with cheese and mayonnaise. The product can be toasted for a crispy texture and retails in a 4-count pack that comes with a resealable sticker, is printed with biomass ink and bears a QR code and a summer promotion. Launched on July 1, 2021. RRP unavailable.
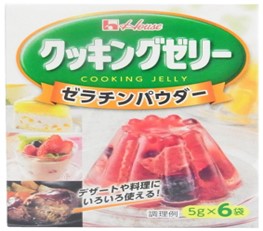
Cooking Jelly
Source: Mintel, 2023
| Company | House Foods |
|---|---|
| Brand | House |
| Category | Bakery |
| Sub-category | Baking ingredients and mixes |
| Market | Japan |
| Store type | Supermarket |
| Date published | April 2020 |
| Launch type | Relaunch |
| Price in US dollars | 1.58 |
House Cooking Jelly has been repackaged. This gelatin can be used for making desserts with addition of 250 millilitres of hot water or cooking by adding 50 millilitres of water and heating in a microwave, and then mixing with ingredients and letting the mixture set in a fridge. This product retails in a 30 gram pack with six 5 gram packets. The pack bears cooking instructions, a QR code and the FSC logo. Launched on January 20, 2020, with an RRP of 184 yen.
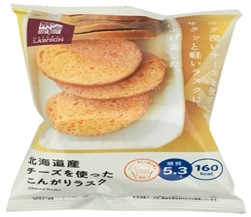
Hokkaido Cheese Rusks
Source: Mintel, 2023
| Company | Lawson |
|---|---|
| Brand | Natural Lawson |
| Category | Bakery |
| Sub-category | Savoury biscuits / crackers |
| Market | Japan |
| Store type | Convenience store |
| Date published | June 2018 |
| Launch type | New variety / range extension |
| Price in US dollars | 1.34 |
Natural Lawson Hokkaido Cheese Rusks are now available. They are described as crispy rusks with rich cheese from Hokkaido. This low-carb product contains 5.3 grams sugar, 160 calories and 6.2 grams dietary fibre, and retails in a 30 gram pack. Launched on April 17, 2018, with an RRP of 148 yen.
Opportunities for Canada
Japan was the fifth largest global retail sales market for baked goods with values of US$24.7 billion, representing a 5.0% market share in 2023. Japan experienced an increase in CAGR of 2.9% as retail sales grew from US$21.4 billion in 2018 and are expected to further improve with an increase in CAGR of 1.8% in the forecast period as retail sales are anticipated to reach US$27.0 billion by 2028.
Japan is a net importer of baked goods products. In 2022, Japan imported US$529.9 million and exported US$403.3 million of baked goods, recording a trade deficit of US$126.6 million. Further, Japan was the twentieth largest (after the Czech Republic and Portugal) global market for baked goods with imports of US$529.9 million (1.1% market share), 118.2 million kilograms in 2022, increasing in CAGR by 7.2% from US$373.9 million, 94.4 million kilograms in 2017. Of Japan's 2022 baked good imports, Canada was the sixteenth largest supplier to Japan (representing a 1.2% market share) providing US$6.2 million (−2.9% from US$7.2 million in 2017), 1.3 million kilograms in 2022,
Top baked goods imports from Canada included bread, pastry, cakes and biscuits (HS code: 190590) valued at US$6.2 million (99.0% market share), 1.3 million kilograms, followed by rusks, toasted bread (HS code 190540) with values of US$53,098 (0.9% market share), 3,510 kilograms and waffles and wafers (HS code: 190532) with values of US$5,658 (0.1% market share), 329 kilograms, signifying Canada's position as a trusted and capable supplier of baked goods (products) to the Japanese market.
Given the expected and continued growth in the baked goods product market in Japan, Canadian producers have the opportunity to expand their exports of baked goods, including value-added products to the Japanese market. That said, it is important for Canadian suppliers to work closely with their importing partners and Trade Commissioners to understand and ensure that Japan's import requirements for their specific products are met.
Canada's broad (and growing) trade network provides Canadian companies preferred access to diverse markets all over the world. Information on Canada's free trade agreements (FTA) may be found at Global Affairs Canada, Trade and investment agreements.
The Comprehensive and Progressive Agreement for Trans-Pacific Partnership (CPTPP) is a free trade agreement (FTA) between Canada and 10 other countries in the Asia-Pacific region: Australia, Brunei, Chile, Japan, Malaysia, Mexico, New Zealand, Peru, Singapore and Vietnam. The CPTPP entered into force on December 30, 2018, in the first six countries to have ratified the agreement: Canada, Australia, Japan, Mexico, New Zealand, and Singapore (Global Affairs Canada; About the Comprehensive and Progressive Agreement for Trans-Pacific Partnership [CPTPP]).
One of the benefits of the CPTPP agreement is a comprehensive tariff elimination across all sectors. Once fully implemented, 99% (94% of Canada's exports of agriculture and agri-food products) of tariff lines among CPTPP parties will be duty free. Further, tariffs on other goods will be eliminated gradually over "phase-out" periods, which vary by country and are detailed in each country's respective tariff elimination schedules (please see Annex 2-D of the Agreement for the tariff elimination schedules of each CPTPP country) (Global Affairs Canada; About tariff elimination under the CPTPP). For additional tariff information, please consult the Canada Tariff Finder to explore tariff information for the CPTPP market, and other countries with which Canada has a free trade agreement (Global Affairs Canada; About tariff elimination under the CPTPP).
The CPTPP commits to helping small and medium-sized enterprises (SMEs) take advantage of the agreement's commercial opportunities. SMEs represent over 99% of Canadian businesses and almost 90% of all private sector jobs in Canada. For further information, please consult CPTPP benefits for small and medium-sized enterprises.
For more information
The Canadian Trade Commissioner Service:
International Trade Commissioners can provide Canadian industry with on-the-ground expertise regarding market potential, current conditions and local business contacts, and are an excellent point of contact for export advice.
More agri-food market intelligence:
International agri-food market intelligence
Discover global agriculture and food opportunities, the complete library of Global Analysis reports, market trends and forecasts, and information on Canada's free trade agreements.
Agri-food market intelligence service
Canadian agri-food and seafood businesses can take advantage of a customized service of reports and analysis, and join our email subscription service to have the latest reports delivered directly to their inbox.
More on Canada's agriculture and agri-food sectors:
Canada's agriculture sectors
Information on the agriculture industry by sector. Data on international markets. Initiatives to support awareness of the industry in Canada. How the department engages with the industry.
For information on FoodEx Japan 2024, please contact:
Ben Berry, Deputy Director
Trade Show Strategy and Delivery
Agriculture and agri-food Canada
ben.berry@agr.gc.ca
Resources
- Euromonitor International, 2023:
- Country Report: Baked Goods in Japan, November 2023
- Global Affairs Canada; Trade and investment agreements, (About) Comprehensive and Progressive Agreement for Trans-Pacific Partnership (CPTPP)
- Global Trade Tracker, 2023
- Mintel; A year of innovation in cakes, pastries and sweet goods, Walji, Amrin. June 20, 2023
- Mintel; A year of innovation in biscuits, cookies and crackers, Kaczorowski, Mikolaj. March 20, 2023
- Mintel Global New Products Database, 2023
Sector Trend Analysis – Bakery products in Japan
Global Analysis Report
Prepared by: Laurie Bernardi, International Market Research Analyst
© His Majesty the King in Right of Canada, represented by the Minister of Agriculture and Agri-Food (2024).
Photo credits
All photographs reproduced in this publication are used by permission of the rights holders.
All images, unless otherwise noted, are copyright His Majesty the King in Right of Canada.
To join our distribution list or to suggest additional report topics or markets, please contact:
Agriculture and Agri-Food Canada, Global Analysis1341 Baseline Rd, Tower 5, 3rd floor
Ottawa ON K1A 0C5
Canada
Email: aafc.mas-sam.aac@agr.gc.ca
The Government of Canada has prepared this report based on primary and secondary sources of information. Although every effort has been made to ensure that the information is accurate, Agriculture and Agri-Food Canada (AAFC) assumes no liability for any actions taken based on the information contained herein.
Reproduction or redistribution of this document, in whole or in part, must include acknowledgement of agriculture and agri-food Canada as the owner of the copyright in the document, through a reference citing AAFC, the title of the document and the year. Where the reproduction or redistribution includes data from this document, it must also include an acknowledgement of the specific data source(s), as noted in this document.
Agriculture and Agri-Food Canada provides this document and other report services to agriculture and food industry clients free of charge.