

Note: This report includes forecasting data that is based on baseline historical data.
Executive summary
Baked goods retail sales in the United Arab Emirates (UAE) increased at a compound annual growth rate (CAGR) of 3.1% from 2018 to 2022, reaching US$671.7 million. It is expected to grow at a CAGR of 7.5% from 2023 to 2027, reaching US$966.7 million in 2027. Frozen baked goods was the best performing category over 2018-22, with retail value sales increasing by CAGR of 7.5%. reaching US$51.8 million.
UAE consumers have increasingly adopted health and wellness lifestyles. Baked goods with reduced sugar content or alternative sweetening ingredients as well as functional bread and cakes enriched with protein, fibre, fruits, and plant based ingredients are becoming more popular in UAE.
Top three baked goods companies were Almarai Co Ltd, followed by Modern Bakery LLC, and IFFCO Group. Over 2018-22, Almarai sales grew the fastest, followed by Mondelez International, and Sunbulah Group.
Top four brands in the UAE make up over half the industry with Modern Bakery and Almarai dominating. Almarai and IFFCO have the most brands in the top 14.
The majority of bakery products in the UAE are distributed through hyper and supermarkets. Combined, they represent 80.0% of distribution, followed by small retailers (15.0%) and Ecommerce (5.0%).
According to Mintel's Global New Products Database (GNPD), Top sub-categories of new bakery products included sweet biscuits/cookies, baking ingredients and mixes, bread and bread products, and savour biscuits/crackers.
Retail environment and trends
Baked goods retail sales in the UAE increased at a CAGR of 3.1% from 2018 to 2022, reaching US$671.7 million. It is expected to grow at a CAGR of 7.5% from 2023 to 2027, reaching US$966.7 million in 2027. Frozen baked goods was the best performing category over 2018 to 2022, with retail value sales increasing by CAGR of 7.5%. reaching US$51.8 million.
Since the pandemic, UAE consumers have increasingly adopted health and wellness lifestyles. Baked goods with reduced sugar content or alternative sweetening ingredients as well as functional bread and cakes enriched with protein, fibre, fruits, and plant based ingredients are becoming more popular in UAE.
| Category | 2018 | 2022 | CAGR* % 2018-2022 | 2023 | 2027 | CAGR* % 2022-2027 |
|---|---|---|---|---|---|---|
| Baked Goods | 594.9 | 671.7 | 3.1 | 724.2 | 966.7 | 7.5 |
| Bread | 317.8 | 369.1 | 3.8 | 392.9 | 504.9 | 6.5 |
| Pastries | 131.6 | 139.0 | 1.0 | 151.8 | 212.4 | 8.8 |
| Cakes | 78.2 | 81.2 | 1.7 | 89.8 | 124.7 | 8.6 |
| Frozen baked goods | 38.8 | 51.8 | 7.5 | 57.5 | 85.3 | 10.4 |
| Dessert mixes | 21.6 | 23.2 | 1.4 | 24.2 | 29.2 | 4.8 |
|
Source: Euromonitor International, 2023 *CAGR: Compound Annual Growth |
||||||
Bakeries and small scale baked good companies make up over half the market for baked goods in the UAE, ffollowed by private labels. Top three baked goods companies were Almarai Co Ltd. (US$26.0 million in 2022), followed by Modern Bakery LLC (US$24.9 million) and IFFCO Group (US$16.2 million). Over 2018 to 2022, Almarai sales grew the fastest by a CAGR of 17.9%, followed by Mondelez International (15.0%) and Sunbulah Group (8.0%).
| Company name | 2018 | 2019 | 2020 | 2021 | 2022 | CAGR* % 2018-2022 |
|---|---|---|---|---|---|---|
| Almarai Co Ltd | 13.5 | 14.8 | 15.7 | 20.7 | 26.0 | 17.9 |
| Modern Bakery LLC | 20.8 | 21.9 | 22.8 | 22.8 | 24.9 | 4.6 |
| IFFCO Group | 12.2 | 12.6 | 13.6 | 14.7 | 16.2 | 7.4 |
| Mondelez International Inc | 8.5 | 8.9 | 7.6 | 8.1 | 14.9 | 15.0 |
| Americana Group | 12.6 | 13.1 | 11.2 | 12.1 | 13.3 | 1.4 |
| Kawan Food Bhd | 9.0 | 9.3 | 9.9 | 10.8 | 12.0 | 7.6 |
| Sahar Enterprises LLC | 7.2 | 7.5 | 8.0 | 8.7 | 9.6 | 7.4 |
| Golden Loaf Est | 6.9 | 7.0 | 7.5 | 7.2 | 9.2 | 7.6 |
| Al Arz Automatic Bakery llc | 6.5 | 6.9 | 7.5 | 7.4 | 8.4 | 6.5 |
| ID Fresh Food (India) Pvt Ltd | 6.0 | 6.3 | 6.7 | 7.2 | 8.0 | 7.4 |
| Mars Inc | 6.6 | 7.1 | 6.0 | 6.5 | 7.3 | 2.2 |
| General Mills Inc | 5.5 | 5.7 | 6.9 | 6.9 | 7.2 | 7.0 |
| National Food Products Co LLC | 4.6 | 5.2 | 6.5 | |||
| Al Jadeed Bakery LLC | 4.9 | 5.0 | 5.4 | 5.2 | 5.5 | 2.9 |
| Sunbulah Group | 3.0 | 3.1 | 3.4 | 3.7 | 4.1 | 8.0 |
| McCain Foods Ltd | 3.7 | 3.5 | 3.5 | 3.8 | 4.1 | 2.6 |
| Private label | 43.2 | 45.6 | 49.0 | 47.0 | 49.8 | 3.7 |
| Generics | 22.0 | 23.1 | 24.0 | 23.8 | 25.5 | 3.8 |
| Others | 386.0 | 399.8 | 380.3 | 382.1 | 405.0 | −2.4 |
| Total | 594.9 | 618.7 | 611.7 | 622.5 | 671.7 | 3.1 |
|
Source: Euromonitor International, 2023 *CAGR: Compound Annual Growth |
||||||
Top four brands in the UAE make up over half the industry with Modern Bakery and Almarai dominating. Almarai and IFFCO have the most brands in the top 14.
| Brand (Company) | 2018 | 2019 | 2020 | 2021 | 2022 | CAGR* % 2018-2022 |
|---|---|---|---|---|---|---|
| Modern Bakery (Modern Bakery LLC) | 19.0 | 20.8 | 21.9 | 22.8 | 22.8 | 4.6 |
| L'Usine (Almarai Co Ltd) | 12.2 | 13.5 | 14.8 | 15.7 | 15.9 | 8.8 |
| Americana (Americana Group) | 11.3 | 12.6 | 13.1 | 11.2 | 12.1 | 1.4 |
| Kawan (Kawan Food Bhd) | 8.2 | 9.0 | 9.3 | 9.9 | 10.8 | 7.6 |
| Al Kabeer (Sahar Enterprises LLC) | 6.6 | 7.2 | 7.5 | 8.0 | 8.7 | 7.4 |
| Golden Loaf (Golden Loaf Est) | 6.4 | 6.9 | 7.0 | 7.5 | 7.2 | 7.6 |
| Al Baker (IFFCO Group) | 5.9 | 6.4 | 6.7 | 7.2 | 7.7 | 7.2 |
| Al Arz Automatic Bakery (Al Arz Automatic Bakery llc) | 6.1 | 6.5 | 6.9 | 7.5 | 7.4 | 6.5 |
| ID (ID Fresh Food (India) Pvt Ltd) | 6.1 | 6.0 | 6.3 | 6.7 | 7.2 | 7.4 |
| Hayat (IFFCO Group) | 5.3 | 5.7 | 6.0 | 6.4 | 6.9 | 7.6 |
| Galaxy/Dove (Mars Inc) | 6.4 | 6.6 | 7.1 | 6.0 | 6.5 | 2.2 |
| Bakemart (Almarai Co Ltd) | 4.9 | |||||
| Barni (Mondelez International Inc) | 6.1 | 6.8 | 7.1 | 5.7 | 6.2 | 0.2 |
| Royal Bakers (National Food Products Co LLC) | 4.6 | 5.2 | ||||
| Private label | 40.1 | 43.2 | 45.6 | 49.0 | 47.0 | 3.7 |
| Generics | 20.5 | 22.0 | 23.1 | 24.0 | 23.8 | 3.8 |
| Others | 369.3 | 386.0 | 399.8 | 380.3 | 382.1 | 1.2 |
| Total all brands | 562.3 | 594.9 | 618.7 | 611.7 | 622.5 | 3.1 |
|
Source: Euromonitor International, 2023 *CAGR: Compound Annual Growth |
||||||
Retail subsector analysis
Bread
All bread categories have shown post pandemic growth. Leavened bread saw the most growth with packaged bread growing the fastest, at a CAGR of 4.8% from 2018 to 2022, reaching US$85.1 million. Sales of packaged and unpackaged flat bread increased by a CAGR of 3.8%. Bread is expected to continue growing over 2022-27, with growth rates set to accelerate in all categories.
Packaged bread producers are likely to integrate an increasing number of nutritious elements into their offers. Grain, nut, and seed combinations in packaged baked goods appeal to consumers concerned with the protein, mineral, vitamin, and fibre levels of their diets.
| Category | 2018 | 2022 | CAGR* % 2018-2022 | 2023 | 2027 | CAGR* % 2022-2027 |
|---|---|---|---|---|---|---|
| Bread | 317.8 | 369.1 | 3.8 | 392.9 | 504.9 | 6.5 |
| Leavened bread | 140.9 | 164.0 | 3.9 | 174.9 | 220.7 | 6.0 |
| Packaged leavened bread | 70.5 | 85.1 | 4.8 | 91.0 | 116.5 | 6.4 |
| Unpackaged leavened bread | 70.5 | 78.9 | 2.9 | 84.0 | 104.2 | 5.5 |
| Flat bread | 176.9 | 205.1 | 3.8 | 218.0 | 284.3 | 6.9 |
| Packaged flat bread | 102.5 | 118.7 | 3.7 | 127.3 | 169.2 | 7.4 |
| Unpackaged flat bread | 74.4 | 86.4 | 3.8 | 90.7 | 115.1 | 6.1 |
|
Source: Euromonitor International, 2023 *CAGR: Compound Annual Growth |
||||||
Modern Bakery and L'Usine were the largest bread companies in the UAE with sales growing by CAGR's of 4.9% and 11.1% from 2018 to 2022 respectively, with sales increasing to US$14.8 million and US$11.3 million respectively in 2022.
| Brand (company) | 2018 | 2019 | 2020 | 2021 | 2022 | CAGR* % 2018-2022 |
|---|---|---|---|---|---|---|
| Modern Bakery (Modern Bakery LLC) | 12.2 | 12.8 | 13.9 | 13.5 | 14.8 | 4.9 |
| L'Usine (Almarai Co Ltd) | 7.4 | 8.2 | 9.2 | 9.1 | 11.3 | 11.1 |
| Golden Loaf (Golden Loaf Est) | 6.4 | 6.5 | 7.0 | 6.7 | 8.5 | 7.3 |
| Al Arz Automatic Bakery (Al Arz Automatic Bakery llc) | 6.5 | 6.9 | 7.5 | 7.4 | 8.4 | 6.5 |
| Bakemart (Almarai Co Ltd) | 4.9 | 7.2 | ||||
| Royal Bakers (National Food Products Co LLC) | 4.6 | 5.2 | 6.5 | |||
| Al Jadeed Bakery (Al Jadeed Bakery LLC) | 4.9 | 5.0 | 5.4 | 5.2 | 5.5 | 2.9 |
| Delba (Delba Backbetrieb GmbH) | 1.4 | 1.5 | 1.6 | 1.5 | 2.0 | 8.4 |
| Private label | 42.3 | 44.7 | 48.1 | 46.0 | 48.8 | 3.6 |
| Generics | 22.0 | 23.1 | 24.0 | 23.8 | 25.5 | 3.8 |
| Others | 214.6 | 221.4 | 227.6 | 219.7 | 230.6 | 1.8 |
| Total | 317.8 | 330.1 | 349.0 | 342.9 | 369.1 | 3.8 |
|
Source: Euromonitor International, 2023 *CAGR: Compound Annual Growth |
||||||
Cakes
Sales growth of both packaged and unpacked cakes was static over 2018 to 2022 but expected to accelerate over 2023 to 2027.
| Category | 2018 | 2022 | CAGR* % 2017-2022 | 2023 | 2027 | CAGR* % 2022-2027 |
|---|---|---|---|---|---|---|
| Cakes | 78.2 | 81.2 | 1.0 | 89.8 | 124.7 | 8.6 |
| Packaged cakes | 30.8 | 32.4 | 1.3 | 35.3 | 47.9 | 8.0 |
| Unpackaged cakes | 47.4 | 48.8 | 0.7 | 54.5 | 76.7 | 8.9 |
|
Source: Euromonitor International, 2023 *CAGR: Compound Annual Growth |
||||||
Total cake brand growth was static over 2018 to 2022 at a CAGR of 1.0%. Small scale cake brands followed by Americana are the largest cake brands in the UAE. L'Usine experienced the fastest growth at a CAGR of 3.6% from 2018 to 2022, followed by Modern Bakery (3.5%).
| Brand (Company) | 2018 | 2019 | 2020 | 2021 | 2022 | CAGR* % 2018-2022 |
|---|---|---|---|---|---|---|
| Americana (Americana Group) | 12.6 | 13.1 | 11.2 | 12.1 | 13.3 | 1.4 |
| Galaxy/Dove (Mars Inc) | 6.6 | 7.1 | 6.0 | 6.5 | 7.3 | 2.2 |
| Barni (Mondelez International Inc) | 6.8 | 7.1 | 5.7 | 6.2 | 6.8 | 0.2 |
| L'Usine (Almarai Co Ltd) | 1.6 | 1.7 | 1.4 | 1.5 | 1.8 | 3.6 |
| Modern Bakery (Modern Bakery LLC) | 1.5 | 1.6 | 1.4 | 1.6 | 1.7 | 3.5 |
| Britannia (Britannia Industries Ltd) | 0.8 | 0.8 | 0.7 | 0.7 | 0.9 | 2.8 |
| Gandour (Al Jazirah Food Processing Co Ltd) | 0.4 | 0.5 | 0.4 | 0.4 | 0.5 | 1.4 |
| Others | 47.8 | 49.8 | 40.6 | 45.0 | 48.9 | 0.6 |
| Total | 78.2 | 81.7 | 67.5 | 74.1 | 81.2 | 1.0 |
|
Source: Euromonitor International, 2023 *CAGR: Compound Annual Growth |
||||||
Desert mixes
Sales of dessert mixes were stagnant over 2018 to 2022, at US$23.2 million in 2022 but are expected to accelerate over 2023 to 2027. While the pandemic drove growth in dessert mixes due to increased home activity and home consumption, the popularity of such products is likely to wane once lifestyles and consumption return to outside the home.
| Category | 2018 | 2022 | CAGR* % 2018-2022 | 2023 | 2027 | CAGR* % 2023-2027 |
|---|---|---|---|---|---|---|
| Dessert Mixes | 21.6 | 23.2 | 1.7 | 24.3 | 29.2 | 4.8 |
|
Source: Euromonitor International, 2023 *CAGR: Compound Annual Growth |
||||||
Betty Crocker and Al Alali are the largest dessert mix brands in the UAE with retail sales representing almost half total brand sales in 2022.
| Brand (Company) | 2018 | 2019 | 2020 | 2021 | 2022 | CAGR* % 2018-2022 |
|---|---|---|---|---|---|---|
| Betty Crocker (General Mills Inc) | 4.7 | 4.9 | 5.8 | 5.8 | 6.0 | 6.5 |
| Al Alali (Basamh Marketing Co) | 2.6 | 2.6 | 2.9 | 2.9 | 3.0 | 4.1 |
| Royal (Mondelez International Inc) | 1.7 | 1.8 | 1.9 | 1.9 | 2.0 | 3.2 |
| Foster Clark's (Suntory Holdings Ltd) | 1.1 | 1.1 | 1.2 | 1.2 | 1.3 | 3.5 |
| Pillsbury (General Mills Inc) | 0.8 | 0.8 | 1.1 | 1.1 | 1.2 | 9.7 |
| Green's (Green's General Foods Pty Ltd) | 0.7 | 0.8 | 0.8 | 0.8 | 0.7 | 1.1 |
| Others | 10.0 | 9.0 | 8.4 | 8.3 | 8.9 | −2.7 |
| Total | 21.6 | 21.0 | 22.1 | 22.1 | 23.2 | 1.7 |
|
Source: Euromonitor International, 2023 *CAGR: Compound Annual Growth |
||||||
Frozen baked goods
Sales of frozen baked goods increased over 2018 to 2022 by a CAGR of 7.5%, reaching US$51.8 million in 2022. A growth rate of 10.4% is expected over 2023 to 2027.
| Category | 2018 | 2022 | CAGR* % 2017-2022 | 2023 | 2027 | CAGR* % 2022-2027 |
|---|---|---|---|---|---|---|
| Frozen baked goods | 38.8 | 51.8 | 7.5 | 57.5 | 85.3 | 10.4 |
|
Source: Euromonitor International, 2023 *CAGR: Compound Annual Growth |
||||||
Kawan brand is the biggest brand in the UAE. Al Karamah experienced the largest CAGR at 9.1%, reaching US$1.2 million in 2022.
| Brand (company) | 2018 | 2019 | 2020 | 2021 | 2022 | CAGR* % 2018-2022 |
|---|---|---|---|---|---|---|
| Kawan (Kawan Food Bhd) | 9.0 | 9.3 | 9.9 | 10.8 | 12.0 | 7.6 |
| Al Kabeer (Sahar Enterprises LLC) | 7.2 | 7.5 | 8.0 | 8.7 | 9.6 | 7.4 |
| Al Baker (IFFCO Group) | 6.4 | 6.7 | 7.2 | 7.7 | 8.5 | 7.2 |
| ID (ID Fresh Food (India) Pvt Ltd) | 6.0 | 6.3 | 6.7 | 7.2 | 8.0 | 7.4 |
| Hayat (IFFCO Group) | 5.7 | 6.0 | 6.4 | 6.9 | 7.7 | 7.6 |
| Sunbulah (Sunbulah Group) | 3.0 | 3.1 | 3.4 | 3.7 | 4.1 | 8.0 |
| Al Karamah (Al Karamah Doughs Co Ltd) | 0.8 | 0.9 | 0.9 | 1.0 | 1.2 | 9.1 |
| Others | 0.6 | 0.5 | 0.3 | 0.7 | 0.7 | 3.0 |
| Total | 38.8 | 40.1 | 42.8 | 46.7 | 51.8 | 7.5 |
|
Source: Euromonitor International, 2023 *CAGR: Compound Annual Growth |
||||||
Pastries
Sales of packaged and unpackaged pastries were static over 2018 to 2022 but are expected to increase by a CAGR of 8.8% over 2023 to 2027.
| Category | 2018 | 2022 | CAGR* % 2018-2022 | 2023 | 2027 | CAGR* % 2023-2027 |
|---|---|---|---|---|---|---|
| Pastries | 131.6 | 139.0 | 1.4 | 151.8 | 212.4 | 8.8 |
| Packaged pastries | 40.4 | 41.1 | 0.4 | 44.1 | 58.5 | 7.3 |
| Unpackaged pastries | 91.2 | 97.9 | 1.8 | 107.7 | 153.9 | 9.3 |
|
Source: Euromonitor International, 2023 *CAGR: Compound Annual Growth |
||||||
Artisanal brands made up over half the retail sales in the market, increasing by a CAGR of 3.8% over 2017-21. Following artisanal brands, private label brands have the highest retail sales and experienced the largest sales increase at a CAGR of 5.9% from 2017 to 2021.
| Brand (company) | 2018 | 2019 | 2020 | 2021 | 2022 | CAGR* % 2018-2022 |
|---|---|---|---|---|---|---|
| Modern Bakery (Modern Bakery LLC) | 7.1 | 7.4 | 7.4 | 7.7 | 8.3 | 4.3 |
| L'Usine (Almarai Co Ltd) | 4.4 | 4.9 | 5.1 | 5.3 | 5.7 | 6.3 |
| Grand Mills (Agthia Group PJSC) | 2.2 | 2.3 | 2.4 | 2.5 | 2.6 | 4.4 |
| Yaumi (Al Rashed Food Co Ltd) | 2.0 | 2.1 | 2.2 | 2.2 | 2.4 | 4.8 |
| Golden Loaf (Golden Loaf Est) | 0.4 | 0.5 | 0.5 | 0.5 | 0.7 | 11.3 |
| Kellogg's Pop-Tarts (Kellogg Co) | 0.4 | 0.4 | 0.4 | 0.5 | 0.5 | 9.4 |
| 7 Days (Chipita SA) | 5.2 | 5.5 | 5.5 | 5.7 | ||
| Other | 109.9 | 115.6 | 99.8 | 105.2 | 112.6 | 0.6 |
| Total | 131.6 | 138.7 | 123.2 | 129.6 | 139.0 | 1.4 |
|
Source: Euromonitor International, 2023 *CAGR: Compound Annual Growth |
||||||
Distribution channels
The majority of bakery products in the UAE are distributed through hyper and supermarkets. Combined, they represent 80.0% of distribution, followed by small retailers (15.0%) and Ecommerce (5.0%).
As UAE consumers love both shopping centres and the digital world, both channels are expected to coexist to drive growth and recovery from the pandemic, with stores expected to continue being the most important and biggest channel in the UAE. Stores now draw people in with a more sensory experience and accommodate online order fulfilment. For example, in 2021, the UAE saw the arrival of its first AI-powered fully automated store (Carrefour City+) located in Mall of the Emirates, Dubai. Items are added to customers' digital shopping baskets and paid for by smartphone, without interacting with staff or a checkout.
| Outlet type | 2018 | 2019 | 2020 | 2021 | 2022 | CAGR* % 2018-2022 | Share % 2022 |
|---|---|---|---|---|---|---|---|
| Grocery retailers | 585.4 | 608.4 | 590.5 | 594.6 | 635.5 | 2.1 | 95 |
| Convenience retail | 13.2 | 16.8 | 15.8 | 18.8 | 20.8 | 12 | 3 |
| Convenience stores | 8.2 | 11.6 | 10.1 | 12.7 | 13.7 | 13.8 | 2 |
| Forecourt retailers | 5.1 | 5.2 | 5.6 | 6.2 | 7.1 | 9 | 1 |
| Supermarkets | 147.4 | 155.0 | 146.0 | 142.2 | 152.3 | 0.8 | 23 |
| Hypermarkets | 344.8 | 357.7 | 356.8 | 361.3 | 385.5 | 2.8 | 57 |
| Food/drink/tobacco specialists | 53.7 | 55.0 | 49.4 | 49.5 | 52.5 | −0.5 | 8 |
| Small local crocers | 26.3 | 23.8 | 22.5 | 22.9 | 24.5 | −1.8 | 4 |
| Ecommerce | 9.5 | 10.3 | 21.2 | 27.9 | 31.3 | 34.7 | 5 |
| Total | 594.9 | 618.7 | 611.7 | 622.5 | 671.7 | 3.1 | 100.0 |
|
Source: Euromonitor International, 2023 *CAGR: Compound Annual Growth |
|||||||
New product launch analysis
According to Mintel's Global New Products Database (GNPD), 263 bakery products were launched in the UAE. from 2018 to 2022. Top sub-categories of new bakery products included sweet biscuits/cookies, baking ingredients and mixes, bread and bread products, and savour biscuits/crackers. Flexible was the most common package type, followed by carton. New product was the largest new launch type, followed by new variety/Range extender, and new packaging.
| Product attributes | Yearly launch counts | Total | ||||
|---|---|---|---|---|---|---|
| 2018 | 2019 | 2020 | 2021 | 2022 | ||
| Yearly product launches | 69 | 48 | 58 | 39 | 49 | 263 |
| Top five sub-categories | ||||||
| Sweet biscuits/cookies | 43 | 28 | 27 | 13 | 17 | 128 |
| Baking ingredients and mixes | 11 | 11 | 11 | 6 | 21 | 60 |
| Bread and bread products | 3 | 3 | 11 | 10 | 5 | 32 |
| Savoury biscuits / crackers | 9 | 2 | 6 | 4 | 4 | 25 |
| Cakes, pastries and sweet goods | 3 | 4 | 3 | 6 | 2 | 18 |
| Top five claims | ||||||
| Vegetarian | 23 | 15 | 16 | 8 | 14 | 76 |
| Social media | 11 | 15 | 9 | 11 | 17 | 63 |
| Ethical - environmentally friendly package | 12 | 10 | 13 | 6 | 19 | 60 |
| Ethical - recycling | 11 | 9 | 13 | 5 | 16 | 54 |
| No additives / preservatives | 12 | 8 | 11 | 7 | 8 | 46 |
| Imported status | ||||||
| Imported | 47 | 31 | 31 | 26 | 26 | 161 |
| Not imported | 4 | 2 | 4 | 6 | 4 | 20 |
| Top packaged types | ||||||
| Flexible | 61 | 34 | 45 | 29 | 34 | 203 |
| Carton | 3 | 5 | 3 | 6 | 1 | 18 |
| Flexible stand-up pouch | 2 | 3 | 4 | 0 | 7 | 16 |
| Can | 0 | 3 | 2 | 0 | 2 | 7 |
| Bottle | 0 | 1 | 1 | 1 | 1 | 4 |
| Top launch types | ||||||
| New product | 69 | 48 | 58 | 39 | 49 | 263 |
| New variety / range extension | 50 | 44 | 61 | 33 | 29 | 217 |
| New packaging | 26 | 23 | 19 | 30 | 24 | 122 |
| Relaunch | 3 | 4 | 3 | 4 | 4 | 18 |
| New formulation | 2 | 1 | 2 | 1 | 0 | 6 |
| Top five flavours (including blend) | ||||||
| Unflavoured / plain | 18 | 9 | 14 | 8 | 12 | 61 |
| Chocolate | 8 | 7 | 5 | 1 | 8 | 29 |
| Butter | 5 | 1 | 1 | 2 | 1 | 10 |
| Chocolate (milk) | 3 | 2 | 1 | 1 | 2 | 9 |
| Vanilla / vanilla bourbon / vanilla madagascar | 1 | 1 | 4 | 3 | 0 | 9 |
| Top five ingredients | ||||||
| Salt (food) | 57 | 33 | 45 | 26 | 31 | 192 |
| Wheat flour (food) | 57 | 35 | 42 | 23 | 26 | 183 |
| White sugar (food) | 53 | 35 | 44 | 25 | 25 | 182 |
| Emulsifiers | 33 | 27 | 35 | 16 | 18 | 129 |
| Raising agents | 33 | 22 | 28 | 14 | 17 | 114 |
| Top five companies | ||||||
| Marks & Spencer | 3 | 5 | 5 | 0 | 3 | 16 |
| ZPC Flis | 0 | 0 | 11 | 0 | 0 | 11 |
| Waitrose | 1 | 2 | 3 | 1 | 1 | 8 |
| Mondelez | 2 | 3 | 0 | 0 | 0 | 5 |
| Britannia Industries | 3 | 1 | 0 | 0 | 0 | 4 |
| Source: Mintel GNPD, 2023 | ||||||
Examples of new product launches
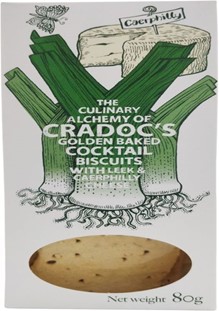
Golden Baked Cocktail Biscuits with Leek and Caerphilly Cheese Zoom
Source: Mintel GNPD, 2023
| Company | Cradoc's |
|---|---|
| Brand | The Culinary Alchemy of Cradoc's |
| Category | Bakery |
| Sub-category | Savoury biscuits / crackers |
| Market | United Arab Emirates |
| Location of manufacture | United Kingdom |
| Import status | Imported product |
| Store name | Spinneys |
| Store type | Supermarket |
| Price in US dollars | 5.38 |
The Culinary Alchemy of Cradoc's Golden Baked Cocktail Biscuits with Leek and Caerphilly Cheese are crunchy and baked to a crisp with mature caerphilly and cheddar cheeses- Irresistibly tasty and light wafer with shards of lush green leek - The manufacturer chooses not to use additives, chemicals, E-numbers, preservatives, trans fats, palm oil, inhibitors or industrial stuff.
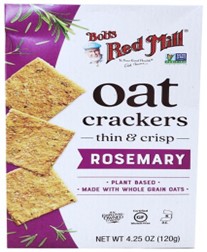
Rosemary Oat Crackers
Source: Mintel GNPD, 2023
| Company | Bob's Red Mill Natural Foods |
|---|---|
| Distributor | Bob's Red Mill Natural Foods |
| Brand | Bob's Red Mill |
| Category | Bakery |
| Sub-category | Savoury biscuits / crackers |
| Market | United Arab Emirates |
| Store name | Spinneys |
| Store type | Supermarket |
| Price in US dollars | 7.08 |
Bob's Red Mill Rosemary Oat Crackers are made with a handful of simple ingredients like oats, almonds, quinoa and flaxseeds. This plant based, gluten free and kosher certified product is said to be thin, crisp and satisfying with an irresistible flavour, can be enjoyed with a variety of toppings or on its own by the handful. It retails in a 120 gram pack bearing Non-GMO Project Verified and an Employee Owned Company logos.
Maple Pecan Organic Cookies

Source: Mintel GNPD, 2023
| Company | Farm Brothers |
|---|---|
| Brand | Farm Brothers |
| Category | Bakery |
| Sub-category | Sweet biscuits / cookies |
| Market | United Arab Emirates |
| Location of manufacture | Belgium |
| Import status | Imported product |
| Store name | Carrefour |
| Store type | Mass merchandise / hypermarket |
| Price in US dollars | 6.45 |
Farm Brothers Maple Pecan Organic Cookies are slow-baked crunchy and vegan cookies made with oats, spelt and rye, and are a source of fibre. The product retails in a 150 gram pack featuring the Vegan Society Approved Vegan Trademark, B Corporation Certified, FSC, EU Organic, Facebook, Twitter, and Instagram logos. For every pack sold, the manufacturer states that they donate 20 square centimetres of land to an organic farmer, contributing to soil health and biodiversity.
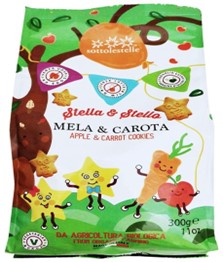
Apple and Carrot Cookies
Source: Mintel GNPD, 2023
| Company | Sottolestelle |
|---|---|
| Brand | Sottolestelle Stella |
| Category | Bakery |
| Sub-category | Sweet biscuits / cookies |
| Market | United Arab Emirates |
| Location of manufacture | Italy |
| Import status | Imported product |
| Store name | Carrefour |
| Store type | Mass merchandise / hypermarket |
| Price in US dollars | 4.77 |
Sottolestelle Stella & Stello Apple and Carrot Cookies comprise ingredients from organic farming. These soft wheat cookies are suitable for both vegetarians and vegans, are free from eggs and milk, and have been made with 100% extra virgin olive oil. This DNV and USDA Organic certified product retails in a 300 gram pack featuring the ISO 9001 and ISO 220005 certifications, JAS ICEA, Love for Earth, and the EU Organic logos.
For more information
The Canadian Trade Commissioner Service:
International Trade Commissioners can provide Canadian industry with on-the-ground expertise regarding market potential, current conditions and local business contacts, and are an excellent point of contact for export advice.
More agri-food market intelligence:
International agri-food market intelligence
Discover global agriculture and food opportunities, the complete library of Global Analysis reports, market trends and forecasts, and information on Canada's free trade agreements.
Agri-food market intelligence service
Canadian agri-food and seafood businesses can take advantage of a customized service of reports and analysis, and join our email subscription service to have the latest reports delivered directly to their inbox.
More on Canada's agriculture and agri-food sectors:
Canada's agriculture sectors
Information on the agriculture industry by sector. Data on international markets. Initiatives to support awareness of the industry in Canada. How the department engages with the industry.
For additional information on Gulfood, please contact:
Ben Berry, Deputy Director
Trade Show Strategy and Delivery
Agriculture and agri-food Canada
ben.berry@agr.gc.ca
Resources
- Euromonitor International:
- Baked Goods in the UAE (December 2022)
- Staple Foods in the UAE (November 2022)
- Mintel Global New Products Database, 2023
Sector Trend Analysis – Bakery products in the United Arab Emirates
Global Analysis Report
Prepared by: Kris Clipsham, Market Analyst
© His Majesty the King in Right of Canada, represented by the Minister of Agriculture and Agri-Food (2023).
Photo credits
All photographs reproduced in this publication are used by permission of the rights holders.
All images, unless otherwise noted, are copyright His Majesty the King in Right of Canada.
To join our distribution list or to suggest additional report topics or markets, please contact:
Agriculture and Agri-Food Canada, Global Analysis1341 Baseline Rd, Tower 5, 3rd floor
Ottawa ON K1A 0C5
Canada
Email: aafc.mas-sam.aac@agr.gc.ca
The Government of Canada has prepared this report based on primary and secondary sources of information. Although every effort has been made to ensure that the information is accurate, Agriculture and Agri-Food Canada (AAFC) assumes no liability for any actions taken based on the information contained herein.
Reproduction or redistribution of this document, in whole or in part, must include acknowledgement of agriculture and agri-food Canada as the owner of the copyright in the document, through a reference citing AAFC, the title of the document and the year. Where the reproduction or redistribution includes data from this document, it must also include an acknowledgement of the specific data source(s), as noted in this document.
Agriculture and Agri-Food Canada provides this document and other report services to agriculture and food industry clients free of charge.