

Note: This report includes forecasting data that is based on baseline historical data.
Executive summary
Global baked goods imports in 2023 were US$52.9 billion. Top three countries that imported baked goods from the world in 2023 were the United States (US$10.6 billion), the United Kingdom (US$4.3 billion) and Germany (US$3.9 billion).
Global baked goods export in 2023 were US$54.1 billion. Top three countries that exported baked goods to the world in 2023 were Germany (US$5.8 billion), Canada (US$5.2 billion) and Italy (US$4.1 billion).
South Korea imported US$472.0 million baked goods from the world in 2023. The top three suppliers were China (US$79.8 million), Malaysia (US$78.2 million) and the United States (US$56.3 million).
Total Canadian bake goods export to South Korea in 2023 were US$4.1 million. Ontario exported more than half of the goods at the value of US$2.4 million in 2023, followed by British Columbia at the value of US$1.1 million.
Baked goods in South Korea retail sales increased by a compound annual growth rate (CAGR) of 3.4% from 2018 to 2023, reaching US$3.873 billion. It is expected to grow by a CAGR of 4.6% from 2024 to 2028, reaching US$4.854 billion in 2028.
Retail sales of packaged leavened bread in South Korea increased by a CAGR of 13.0% from 2018 to 2023, reaching US$113.3 million in 2023. At the same time unpackaged leavened bread increased by a CAGR of 2.1%, to US$1.2 billion.
Both packaged cakes and unpacked cakes increased by a CAGR of 2.5% and 1.5% from 2018 to 2023 respectively. But both are predicted to grow by a CAGR of 2.8% and 4.3% respectively from 2023 to 2028.
Grocery retailers distribute most of the products in South Korea representing a market share of 96.1% while the remainder of the bakery products are distributed through non-grocery specialists (general merchandise store) at 3.9% in 2023. Retail offline represents a 97.2% of the total retail channel while non-store retailing (e-commerce) 2.8% in 2023.
Trade overview
Global baked goods import in 2023 were US$52.9 billion. Top three countries that imported baked goods from the world in 2023 were the United States (US$10.6 billion), the United Kingdom (US$4.3 billion) and Germany (US$3.9 billion). Canada was the 6th largest country to import baked goods at the value of US$2.2 billion. South Korea ranked as the 26th largest importing country at the value of US$472.6 million. All the top 10 countries have positive growth ranging from 7.4% (France) to 14.5% (US) from 2019 to 2023.
| Country | 2019 | 2020 | 2021 | 2022 | 2023 | CAGR* % 2019-2023 |
|---|---|---|---|---|---|---|
| Total | 37,119.6 | 37,306.7 | 43,029.0 | 48,384.2 | 52,971.2 | 9.3 |
| United States | 6,172.5 | 6,445.4 | 7,808.5 | 9,828.8 | 10,620.2 | 14.5 |
| United Kingdom |
2,747.8 |
2,766.0 | 2,787.4 | 3,610.0 | 4,342.2 | 12.1 |
| Germany | 2,556.0 | 2,710.8 | 3,068.0 | 3,141.7 | 3,905.5 | 11.2 |
| France | 2,377.9 | 2,357.0 | 2,669.0 | 2,689.9 | 3,159.4 | 7.4 |
| Netherlands | 1,451.9 | 1,470.8 | 1,753.5 | 1,821.3 | 2,199.9 | 11.0 |
| Canada | 1,635.3 | 1,655.1 | 1,762.1 | 2,036.6 | 2,174.8 | 7.4 |
| Belgium | 1,191.8 | 1,139.6 | 1,481.4 | 1,534.3 | 1,915.0 | 12.6 |
| Italy | 960.7 | 932.2 | 1,053.6 | 1,128.5 | 1,381.3 | 9.5 |
| Spain | 874.0 | 777.5 | 925.4 | 999.0 | 1,120.3 | 6.4 |
| Austria | 762.6 | 743.7 | 827.1 | 819.0 | 1,051.6 | 8.4 |
| South Korea 26th | 339.8 | 348.4 | 389.8 | 419.3 | 472.6 | 8.6 |
|
Source: Euromonitor International, 2024 *CAGR: Compound Annual Growth Rate HS code: 1905 |
||||||
Global baked goods export in 2023 was US$54.1 billion. Top three countries that exported baked goods to the world in 2023 were Germany (US$5.8 billion), Canada (US$5.2 billion) and Italy (US$4.1 billion). South Korea ranked 25th largest exporting country at the value of US$391.4 million. All the top 10 countries have positive growth ranging from 4.9% (US) to 18.1% (Mexico) from 2019 to 2023.
| Country | 2019 | 2020 | 2021 | 2022 | 2023 | CAGR* % 2019-2023 |
|---|---|---|---|---|---|---|
| Total | 38,734.4 | 38,247.6 | 44,419.7 | 48,121.9 | 54,096.7 | 8.7 |
| Germany | 4,081.7 | 4,313.9 | 4,656.8 | 4,888.2 | 5,761.3 | 9.0 |
| Canada | 3,043.7 | 3,115.8 | 3,726.5 | 4,656.7 | 5,195.2 | 14.3 |
| Italy | 2,701.4 | 2,778.3 | 3,400.1 | 3,501.8 | 4,088.1 | 10.9 |
| Belgium | 2,375.4 | 2,366.9 | 2,959.7 | 3,003.2 | 3,734.4 | 12.0 |
| France | 2,378.7 | 2,278.9 | 2,853.6 | 2,959.3 | 3,350.7 | 8.9 |
| Poland | 1,963.4 | 2,089.1 | 2,361.7 | 2,650.8 | 3,279.3 | 13.7 |
| Netherlands | 2,108.8 | 2,103.6 | 2,551.8 | 2,563.2 | 3,131.6 | 10.4 |
| Mexico | 1,357.9 | 1,498.5 | 1,843.1 | 2,338.2 | 2,642.4 | 18.1 |
| United States | 2,092.0 | 2,036.9 | 2,151.6 | 2,441.6 | 2,533.7 | 4.9 |
| Spain | 1,203.5 | 1,284.1 | 1,550.1 | 1,637.7 | 2,024.1 | 13.9 |
| South Korea 25th | 253.1 | 309.0 | 367.1 | 351.8 | 391.4 | 11.5 |
|
Source: Euromonitor International, 2024 *CAGR: Compound Annual Growth Rate |
||||||
South Korea imported / exported bakery from / to the world including Canada
South Korea imported US$472.0 million baked goods from the world in 2023. The top three supplier were China (US$79.8 million), Malaysia (US$78.2 million) and the US (US$56.3 million). Viet-Nam grew the most at a CAGR of 41.7% from 2019 to 2023. Canada was the 15th largest supplying country to South Korea at the value of US$5.8 million in 2023.
| Country | 2019 | 2020 | 2021 | 2022 | 2023 | CAGR* % 2019-2023 |
|---|---|---|---|---|---|---|
| World | 339.8 | 348.3 | 389.6 | 419.4 | 472.0 | 8.6 |
| China | 47.0 | 46.3 | 51.8 | 69.0 | 79.8 | 14.2 |
| Malaysia | 55.9 | 63.4 | 59.5 | 70.5 | 78.2 | 8.8 |
| United States | 53.6 | 56.8 | 65.6 | 61.9 | 56.3 | 1.2 |
| Viet-Nam | 10.9 | 16.7 | 21.5 | 30.9 | 43.9 | 41.7 |
| Japan | 21.7 | 10.4 | 15.6 | 20.1 | 24.3 | 2.9 |
| Indonesia | 19.7 | 19.1 | 19.4 | 17.2 | 22.7 | 3.6 |
| France | 15.0 | 15.5 | 28.3 | 22.5 | 22.7 | 10.9 |
| Italy | 14.7 | 17.7 | 19.3 | 19.0 | 19.6 | 7.5 |
| Germany | 17.5 | 14.0 | 14.6 | 14.2 | 15.7 | −2.7 |
| Thailand | 6.9 | 7.5 | 10.4 | 12.0 | 14.3 | 20.0 |
| Canada 15th | 2.3 | 3.6 | 4.5 | 4.6 | 5.8 | 26.0 |
|
Source: Euromonitor International, 2024 *CAGR: Compound Annual Growth Rate |
||||||
South Korea exported US$391.0 million baked goods to the world in 2023. The top three countries were the US (US$123.8 million), China (US$53.1 million), Japan (US$23.3 million). Canada was the 4th largest importing country and grew the most by a CAGR of 25.0% from 2019 to 2023, importing US$22.0 million from South Korea.
| Country | 2019 | 2020 | 2021 | 2022 | 2023 | CAGR* % 2019-2023 |
|---|---|---|---|---|---|---|
| World | 253.0 | 308.6 | 366.8 | 351.7 | 391.0 | 11.5 |
| United States | 69.6 | 90.8 | 102.7 | 94.2 | 123.8 | 15.5 |
| China | 32.9 | 41.0 | 61.6 | 49.2 | 53.1 | 12.7 |
| Japan | 13.9 | 18.5 | 23.3 | 31.1 | 23.3 | 13.8 |
| Canada | 9.0 | 11.5 | 11.9 | 12.2 | 22.0 | 25.0 |
| Taiwan | 16.5 | 26.0 | 25.1 | 21.6 | 20.3 | 5.3 |
| Hong Kong | 15.0 | 22.9 | 21.6 | 20.2 | 18.6 | 5.5 |
| Australia | 14.4 | 16.2 | 16.4 | 15.8 | 18.4 | 6.3 |
| Philippines | 7.7 | 7.9 | 9.3 | 11.3 | 14.4 | 16.9 |
| Viet-Nam | 13.0 | 14.0 | 15.4 | 15.9 | 13.2 | 0.4 |
| Malaysia | 5.0 | 6.8 | 6.9 | 7.5 | 8.3 | 13.5 |
|
Source: Euromonitor International, 2024 *CAGR: Compound Annual Growth Rate |
||||||
Canadian provinces trade with South Korea
Total bake goods export to South Korea in 2023 was US$4.1 million. Ontario exported more than half of the goods at the value of US$2.4 million in 2023, followed by British Columbia at the value of US$1.1 million.
| Country | 2019 | 2020 | 2021 | 2022 | 2023 | CAGR* % 2019-2023 |
|---|---|---|---|---|---|---|
| Total | 1,879,931.4 | 2,804,591.4 | 3,204,983.1 | 3,772,622.5 | 4,097,729.8 | 21.5 |
| Ontario | 1,685,855.3 | 2,613,888.2 | 2,693,782.5 | 2,089,104.8 | 2,419,568.6 | 9.5 |
| British Columbia | 64,218.4 | 175,190.6 | 383,818.2 | 922,979.9 | 1,077,618.3 | 102.4 |
| Quebec | 129,857.7 | 15,512.6 | 127,382.4 | 748,551.1 | 600,542.9 | 46.7 |
| Alberta | 11,986.7 | |||||
|
Source: Euromonitor International, 2024 *CAGR: Compound Annual Growth Rate |
||||||
Total bake goods import from South Korea in 2023 was US$22.9 million. British Columbia imported more than half of the goods at the value of US$12.2 million in 2023, followed by Ontario at the value of US$10.1 million.
| Country | 2019 | 2020 | 2021 | 2022 | 2023 | CAGR* % 2019-2023 |
|---|---|---|---|---|---|---|
| Total | 10,433,962.7 | 13,857,881.9 | 13,677,415.1 | 14,696,861.5 | 22,852,697.6 | 21.7 |
| British Columbia | 5,009,536.0 | 7,008,635.5 | 7,724,911.5 | 7,909,549.0 | 12,249,955.0 | 25.1 |
| Ontario | 5,322,275.9 | 6,662,691.9 | 5,792,760.4 | 6,711,282.1 | 10,099,203.3 | 17.4 |
| Quebec | 1,724.0 | 25.2 | 32,514.8 | 35,459.6 | 273,407.9 | 254.9 |
| Alberta | 100,426.8 | 186,529.3 | 126,907.0 | 40,450.2 | 212,978.5 | 20.7 |
| Saskatchewan | 17,055.9 | N/C | ||||
|
Source: Euromonitor International, 2024 *CAGR: Compound Annual Growth Rate N/C: Not calculable |
||||||
Retail environment and trends
Baked goods in South Korea
Baked goods retail sales in South Korea increased at a CAGR of 3.4% from 2018 to 2023, reaching US$3.8 billion. It will grow at a CAGR of 4.6% from 2023 to 2028, reaching US$4.8 billion in 2028. Frozen baked goods is the best performing category in 2023, with retail value sales increasing by CAGR of 32.4%. reaching US$56.1 million.
Prices of raw materials are continuously rising in South Korea due to recent inflation. However, as high inflation persists, local consumers are showing a discernible inclination towards baked goods with a reasonable balance between price and assured quality, rather than exhibiting overly price-sensitive reactions. This balanced consumer attitude has emerged as a prominent factor affecting their purchasing behaviour, resulting in packaged baked goods outperforming unpackaged options over the year Euromonitor 2023).
| Category | 2018 | 2023 | CAGR* % 2018-2023 | 2024 | 2028 | CAGR* % 2023-2028 |
|---|---|---|---|---|---|---|
| Baked Goods | 3,276.5 | 3,873.0 | 3.4 | 4,022.6 | 4,854.4 | 4.6 |
| Bread | 1,143.5 | 1,315.2 | 2.8 | 1,366.1 | 1,642.1 | 4.5 |
| Cakes | 1,377.2 | 1,506.5 | 1.8 | 1,540.1 | 1,816.6 | 3.8 |
| Dessert Mixes | 8.8 | 6.7 | −5.3 | 6.1 | 5.4 | −4.2 |
| Frozen Baked Goods | 13.8 | 56.1 | 32.4 | 64.6 | 89.8 | 9.9 |
| Pastries | 688.1 | 938.0 | 6.4 | 993.7 | 1,237.6 | 5.7 |
| Dessert Pies and Tarts | 45.3 | 50.4 | 2.2 | 52.0 | 62.7 | 4.5 |
|
Source: Euromonitor International, 2024 *CAGR: Compound Annual Growth Rate |
||||||
Baked goods volume grew by a CAGR of 0.1% from 2018 to 2023, reaching 392.9 thousand tonnes in 2023. It is estimated that it will increase by a CAGR of 2.4%, to attain 443.3 thousand tonnes in 2028.
| Category | 2018 | 2023 | CAGR* % 2018-2023 | 2024 | 2028 | CAGR* % 2023-2028 |
|---|---|---|---|---|---|---|
| Baked Goods | 390.5 | 392.9 | 0.1 | 399.0 | 443.3 | 2.4 |
| Bread | 187.4 | 181.4 | −0.6 | 184.0 | 203.1 | 2.3 |
| Cakes | 107.5 | 100.0 | −1.4 | 99.6 | 108.0 | 1.6 |
| Dessert Mixes | 0.7 | 0.5 | −6.5 | 0.4 | 0.4 | −4.4 |
| Frozen Baked Goods | 1.1 | 3.7 | 27.5 | 4.2 | 5.4 | 7.9 |
| Pastries | 91.2 | 104.6 | 2.8 | 108.2 | 123.6 | 3.4 |
| Dessert Pies and Tarts | 2.6 | 2.6 | 0.0 | 2.6 | 2.9 | 2.2 |
|
Source: Euromonitor International, 2024 *CAGR: Compound Annual Growth Rate |
||||||
The top three companies that achieved the largest retail sales of baked goods from 2018 to 2023 were SPC Group (US$455.7 million in 2023), followed by Orion Group (US$149.1 million in 2023) and Lotte Group (US$139.1 million in 2023). Of these top three companies, SPC Group grew positively a of 7.2%, Orion Group grew at 2.4% while Lottle Group declined in CAGR's by 6.6% in 2023.
| Company name | 2018 | 2019 | 2020 | 2021 | 2022 | 2023 | CAGR* % 2018-2023 |
|---|---|---|---|---|---|---|---|
| SPC Group | 322.0 | 308.4 | 349.4 | 382.1 | 407.1 | 455.7 | 7.2 |
| Orion Group | 132.7 | 131.1 | 132.2 | 134.2 | 139.7 | 149.1 | 2.4 |
| Lotte Group | 195.5 | 186.3 | 171.8 | 171.9 | 145.7 | 139.1 | −6.6 |
| Crown Confectionery Co Ltd | 55.9 | 54.2 | 59.5 | 56.8 | 53.0 | 54.5 | −0.5 |
| CJ Corp | 2.3 | 2.6 | 5.3 | 5.3 | 5.3 | 6.1 | 21.5 |
| Samyang Holdings Corp | 2.2 | 1.8 | 2.4 | 2.0 | 1.2 | 1.0 | −14.6 |
| Artisanal | 2,909.6 | 2,847.4 | 2,709.0 | 2,816.4 | 2,592.5 | 2,744.3 | −1.2 |
| Private Label | 23.2 | 22.2 | 32.9 | 39.9 | 47.6 | 62.0 | 21.7 |
| Others | 205.3 | 214.4 | 234.3 | 244.2 | 240.3 | 261.2 | 4.9 |
| Total | 3,848.8 | 3,768.4 | 3,696.9 | 3,852.7 | 3,632.4 | 3,873.0 | 0.1 |
|
Source: Euromonitor International, 2024 *CAGR: Compound Annual Growth Rate |
|||||||
In terms of brands, the largest brand Samlip and 4th largest brand Oh Yes demonstrated a positive growth from 2018 to 2023 with CAGR's of 7.2% and 0.5% separately, reaching US$455.7 million and US$41.1 million respectively in 2023.
| Brand name (GBO) | 2018 | 2019 | 2020 | 2021 | 2022 | 2023 | CAGR* % 2018-2023 |
|---|---|---|---|---|---|---|---|
| Samlip (SPC Group) | 322.0 | 308.4 | 349.4 | 382.1 | 407.1 | 455.7 | 7.2 |
| Lotte (Lotte Group) | 123.7 | 114.0 | 106.1 | 110.0 | 89.8 | 87.6 | −6.7 |
| Orion (Orion Group) | 87.3 | 81.5 | 89.0 | 83.0 | 78.9 | 82.0 | −1.2 |
| Oh Yes (Crown Confectionery Co Ltd) | 40.0 | 41.2 | 48.3 | 43.7 | 40.2 | 41.1 | 0.5 |
| Monshell (Lotte Group) | 47.3 | 49.3 | 44.1 | 44.6 | 36.8 | 35.6 | −5.5 |
| Vicpie (Crown Confectionery Co Ltd) | 15.9 | 13.0 | 11.2 | 13.1 | 12.8 | 13.4 | −3.4 |
| Ottu (Orion Group) | 11.8 | 10.9 | 10.4 | 11.2 | 10.8 | 11.3 | −0.9 |
| Gourmet (CJ Corp) | 0.7 | 2.7 | 3.1 | 3.6 | 4.6 | N/C | |
| Market O (Orion Group) | 7.3 | 6.2 | 3.4 | 2.4 | 2.7 | 3.2 | −15.2 |
| Beksul (CJ Corp) | 2.3 | 1.9 | 2.6 | 2.3 | 1.6 | 1.4 | −9.5 |
| Artisanal | 2,909.6 | 2,847.4 | 2,709.0 | 2,816.4 | 2,592.5 | 2,744.3 | −1.2 |
| Private Label | 23.2 | 22.2 | 32.9 | 39.9 | 47.6 | 62.0 | 21.7 |
| Others | 256.2 | 269.9 | 285.4 | 299.1 | 306.6 | 329.8 | 5.2 |
| Total | 3,848.8 | 3,768.4 | 3,696.9 | 3,852.7 | 3,632.4 | 3,873.0 | 0.1 |
|
Source: Euromonitor International, 2024 *CAGR: Compound Annual Growth Rate N/C: Not calculable |
|||||||
Retail subsector analysis
Overall positive impact on packaged bread
Retail sales of packaged leavened bread increased by a CAGR of 13.0% from 2018 to 2023, reaching US$113.3 million in 2023. At the same time unpackaged leavened bread increased by a CAGR of 2.1%, to US$1,201.9 million. However it is estimated that the growth for both packaged leavened bread and unpackaged leavened bread increased by a CAGR of 6.5% and 4.3% separately from 2023 to 2028.
| Category | 2018 | 2023 | CAGR* % 2018-2023 | 2024 | 2028 | CAGR* % 2023-2028 |
|---|---|---|---|---|---|---|
| Bread | 1,143.5 | 1,315.2 | 2.8 | 1,366.1 | 1,642.1 | 4.5 |
| Leavened Bread | 1,143.5 | 1,315.2 | 2.8 | 1,366.1 | 1,642.1 | 4.5 |
| Packaged Leavened Bread | 61.6 | 113.3 | 13.0 | 123.0 | 155.5 | 6.5 |
| Unpackaged Leavened Bread | 1,081.9 | 1,201.9 | 2.1 | 1,243.1 | 1,486.6 | 4.3 |
|
Source: Euromonitor International, 2024 *CAGR: Compound Annual Growth Rate |
||||||
In terms of retail sales volume, the packaged leavened bread grew by a CAGR of 7.4% from 2018 to 2023, reaching 21.4 thousand tonnes in 2023. Conversely, unpackaged leavened bread decreased at a CAGR of −1.5% from 2018 to 2023, down to 160.0 thousand tonnes. It is projected that both packaged leavened bread and unpackaged leavened bread will all grow at a CAGR's of 4.2% and 2.0% respectively from 2023 to 2028.
| Category | 2018 | 2023 | CAGR* % 2018-2023 | 2024 | 2028 | CAGR* % 2023-2028 |
|---|---|---|---|---|---|---|
| Bread | 187.4 | 181.4 | −0.6 | 184.0 | 203.1 | 2.3 |
| Leavened Bread | 187.4 | 181.4 | −0.6 | 184.0 | 203.1 | 2.3 |
| Packaged Leavened Bread | 15.0 | 21.4 | 7.4 | 22.7 | 26.3 | 4.2 |
| Unpackaged Leavened Bread | 172.5 | 160.0 | −1.5 | 161.3 | 176.8 | 2.0 |
|
Source: Euromonitor International, 2024 *CAGR: Compound Annual Growth Rate |
||||||
SPC Group and Lotte Group were the largest bread companies in South Korea with retail sales attaining CAGR's of same 7.4% and 7.4% from 2018 to 2023 respectively, with both companies to increase retail sales to US$66.5 million and US$19.3 million respectively in 2023.
| Company name | 2018 | 2019 | 2020 | 2021 | 2022 | 2023 | CAGR* % 2018-2023 |
|---|---|---|---|---|---|---|---|
| SPC Group | 46.6 | 43.8 | 52.0 | 58.7 | 58.8 | 66.5 | 7.4 |
| Lotte Group | 13.5 | 14.6 | 16.4 | 17.5 | 17.5 | 19.3 | 7.4 |
| Artisanal | 1,270.8 | 1,229.8 | 1,174.3 | 1,222.2 | 1,133.1 | 1,201.9 | −1.1 |
| Private Label | 1.8 | 2.7 | 3.7 | 5.9 | 8.5 | 11.6 | 45.2 |
| Others | 10.5 | 8.4 | 10.6 | 12.0 | 13.3 | 15.8 | 8.5 |
| Total | 1,343.2 | 1,299.3 | 1,257.0 | 1,316.3 | 1,231.3 | 1,315.2 | −0.4 |
|
Source: Euromonitor International, 2024 *CAGR: Compound Annual Growth Rate |
|||||||
Samlip (SPC Group) and Lotte (Lotte Group) were the largest bread brands in South Korea with retail sales attaining CAGR's of 7.4% and 7.4% from 2018 to 2023 respectively, with both companies to increase retail sales to US$66.5 million and US$19.3 million respectively in 2023.
| Brand name | 2018 | 2019 | 2020 | 2021 | 2022 | 2023 | CAGR* % 2018-2023 |
|---|---|---|---|---|---|---|---|
| Samlip (SPC Group) | 46.6 | 43.8 | 52.0 | 58.7 | 58.8 | 66.5 | 7.4 |
| Lotte (Lotte Group) | 13.5 | 14.6 | 16.4 | 17.5 | 17.5 | 19.3 | 7.4 |
| Artisanal | 1,270.8 | 1,229.8 | 1,174.3 | 1,222.2 | 1,133.1 | 1,201.9 | −1.1 |
| Private Label | 1.8 | 2.7 | 3.7 | 5.9 | 8.5 | 11.6 | 45.2 |
| Others | 10.5 | 8.4 | 10.6 | 12.0 | 13.3 | 15.8 | 8.5 |
| Total | 1,343.2 | 1,299.3 | 1,257.0 | 1,316.3 | 1,231.3 | 1,315.2 | −0.4 |
|
Source: Euromonitor International, 2024 *CAGR: Compound Annual Growth Rate |
|||||||
Both packaged cakes and unpacked cakes increased by a CAGR of 2.5% and 1.5% from 2018 to 2023 respectively. But both are predicted to grow by a CAGR of 2.8% and 4.3% respectively from 2023 to 2028.
| Category | 2018 | 2023 | CAGR* % 2018-2023 | 2024 | 2028 | CAGR* % 2023-2028 |
|---|---|---|---|---|---|---|
| Cakes | 1,377.2 | 1,506.5 | 1.8 | 1,540.1 | 1,816.6 | 3.8 |
| Packaged Cakes | 449.1 | 507.6 | 2.5 | 508.9 | 583.5 | 2.8 |
| Unpackaged Cakes | 928.1 | 998.9 | 1.5 | 1,031.1 | 1,233.1 | 4.3 |
|
Source: Euromonitor International, 2024 *CAGR: Compound Annual Growth Rate |
||||||
In terms of volume, both packaged cakes increased at a CAGR of 0.2% and unpackaged cakes declined at a CAGR of −2.2% from 2018 to 2023. But both are predicted to grow at CAGR of 0.6% and 2.0% respectively from 2023 to 2028.
| Category | 2018 | 2023 | CAGR* % 2018-2023 | 2024 | 2028 | CAGR* % 2023-2028 |
|---|---|---|---|---|---|---|
| Cakes | 107.5 | 100.0 | −1.4 | 99.6 | 108.0 | 1.6 |
| Packaged Cakes | 32.4 | 32.7 | 0.2 | 31.9 | 33.7 | 0.6 |
| Unpackaged Cakes | 75.1 | 67.3 | −2.2 | 67.7 | 74.3 | 2.0 |
|
Source: Euromonitor International, 2024 *CAGR: Compound Annual Growth Rate |
||||||
SPC Samlip Group experienced the largest growth by a CAGR of 9.0% from 2018 to 2023, followed by Private label & Orion group which grew by a CAGR of 2.5% and 2.4% separately from 2018 to 2023.
| Company name | 2018 | 2019 | 2020 | 2021 | 2022 | 2023 | CAGR* % 2018-2023 |
|---|---|---|---|---|---|---|---|
| Orion Group | 132.7 | 131.1 | 132.2 | 134.2 | 139.7 | 149.1 | 2.4 |
| SPC Group | 65.4 | 65.6 | 78.8 | 76.9 | 86.7 | 100.6 | 9.0 |
| Lotte Group | 144.7 | 133.8 | 122.4 | 117.4 | 98.2 | 92.7 | −8.5 |
| Crown Confectionery Co Ltd | 55.9 | 54.2 | 59.5 | 56.8 | 53.0 | 54.5 | −0.5 |
| Artisanal | 1,090.2 | 1,063.3 | 1,002.7 | 1,039.4 | 948.9 | 998.9 | −1.7 |
| Private Label | 3.1 | 2.3 | 1.8 | 1.3 | 2.5 | 3.5 | 2.5 |
| Others | 125.8 | 124.6 | 134.7 | 127.8 | 110.5 | 107.3 | −3.1 |
| Total | 1,617.8 | 1,574.8 | 1,532.1 | 1,553.8 | 1,439.5 | 1,506.5 | −1.4 |
|
Source: Euromonitor International, 2024 *CAGR: Compound Annual Growth Rate |
|||||||
Samlip demonstrated a positive growth at an increase in CAGR of 9.0% from 2018 to 2023. However, the Onion and Lotte brands declined in growth at −1.2% and −10.8% respectively from 2018 to 2023.
| Brand name | 2018 | 2019 | 2020 | 2021 | 2022 | 2023 | CAGR* % 2018-2023 |
|---|---|---|---|---|---|---|---|
| Samlip (SPC Group) | 65.4 | 65.6 | 78.8 | 76.9 | 86.7 | 100.6 | 9.0 |
| Orion (Orion Group) | 87.3 | 81.5 | 89.0 | 83.0 | 78.9 | 82.0 | −1.2 |
| Lotte (Lotte Group) | 72.9 | 61.5 | 59.2 | 58.8 | 44.3 | 41.2 | −10.8 |
| Oh Yes (Crown Confectionery Co Ltd) | 40.0 | 41.2 | 48.3 | 43.7 | 40.2 | 41.1 | 0.5 |
| Monshell (Lotte Group) | 47.3 | 49.3 | 44.1 | 44.6 | 36.8 | 35.6 | −5.5 |
| Vicpie (Crown Confectionery Co Ltd) | 15.9 | 13.0 | 11.2 | 13.1 | 12.8 | 13.4 | −3.4 |
| Ottu (Orion Group) | 11.8 | 10.9 | 10.4 | 11.2 | 10.8 | 11.3 | −0.9 |
| Market O (Orion Group) | 7.3 | 6.2 | 3.4 | 2.4 | 2.7 | 3.2 | −15.2 |
| Artisanal | 1,090.2 | 1,063.3 | 1,002.7 | 1,039.4 | 948.9 | 998.9 | −1.7 |
| Private Label | 3.1 | 2.3 | 1.8 | 1.3 | 2.5 | 3.5 | 2.5 |
| Others | 176.7 | 180.1 | 183.3 | 179.4 | 174.9 | 175.8 | −0.1 |
| Total | 1,617.8 | 1,574.8 | 1,532.1 | 1,553.8 | 1,439.5 | 1,506.5 | −1.4 |
|
Source: Euromonitor International, 2024 *CAGR: Compound Annual Growth Rate |
|||||||
In terms of retail sales value, dessert mixes grew negatively by a CAGR of −5.3% from 2018 to 2023, reaching US$6.7 million in 2023.
| Category | 2018 | 2023 | CAGR* % 2017-2021 | 2024 | 2028 | CAGR* % 2023-2028 |
|---|---|---|---|---|---|---|
| Dessert Mixes | 8.8 | 6.7 | −5.3 | 6.1 | 5.4 | −4.2 |
|
Source: Euromonitor International, 2024 *CAGR: Compound Annual Growth Rate |
||||||
In terms of retail sales volume, dessert mixes also decreased by a CAGR of −6.5% from 2018 to 2023 reaching 0.5 thousand tonnes in 2023. It continued to drop by a CAGR of −4.4% from 2023 to 2028, down to 0.4 thousand tonnes in 2028
| Category | 2018 | 2023 | CAGR* % 2018-2023 | 2024 | 2028 | CAGR* % 2023-2028 |
|---|---|---|---|---|---|---|
| Dessert Mixes | 0.7 | 0.5 | −6.5 | 0.4 | 0.4 | −4.4 |
|
Source: Euromonitor International, 2024 *CAGR: Compound Annual Growth Rate |
||||||
CJ Corp was the largest dessert mix company with retail sales valued at US$1.4 million in 2023, representing an decrease in CAGR of −9.5% from US$2.3 million in 2018. Samyang Holdings Corp also decreased by a CAGR of −14.6% from 2018 to 2023, down to US$1 million in 2023
| Company name | 2018 | 2019 | 2020 | 2021 | 2022 | 2023 | CAGR* % 2018-2023 |
|---|---|---|---|---|---|---|---|
| CJ Corp | 2.3 | 1.9 | 2.6 | 2.3 | 1.6 | 1.4 | −9.5 |
| Samyang Holdings Corp | 2.2 | 1.8 | 2.4 | 2.0 | 1.2 | 1.0 | −14.6 |
| Others | 5.8 | 4.8 | 6.7 | 6.4 | 4.8 | 4.3 | −5.8 |
| Total | 10.3 | 8.5 | 11.7 | 10.7 | 7.7 | 6.7 | −8.2 |
|
Source: Euromonitor International, 2024 *CAGR: Compound Annual Growth Rate |
|||||||
Beksul (CJ Corp) was the largest dessert mix brand with retail sales valued at US$1.4 million in 2023, representing a decrease in CAGR of −9.5% from US$2.3 million in 2018. Qwon (Samyang Holdings Corp) also decreased by a CAGR of −14.6% from 2018 to 2023, down to US$1,0 million in 2023.
| Brand name | 2018 | 2019 | 2020 | 2021 | 2022 | 2023 | CAGR* % 2018-2023 |
|---|---|---|---|---|---|---|---|
| Beksul (CJ Corp) | 2.3 | 1.9 | 2.6 | 2.3 | 1.6 | 1.4 | −9.5 |
| Qwon (Samyang Holdings Corp) | 2.2 | 1.8 | 2.4 | 2.0 | 1.2 | 1.0 | −14.6 |
| Others | 5.8 | 4.8 | 6.7 | 6.4 | 4.8 | 4.3 | −5.8 |
| Total | 10.3 | 8.5 | 11.7 | 10.7 | 7.7 | 6.7 | −8.2 |
|
Source: Euromonitor International, 2024 *CAGR: Compound Annual Growth Rate |
|||||||
Retail sales of the frozen baked goods category increased by a CAGR of 32.4% from 2018 to 2023, reaching US$56.1 million in 2023. It continued to grow by a CAGR of 9.9% from 2018 to 2023, reaching US$89.8 million by 2028.
| Category | 2018 | 2023 | CAGR* % 2018-2023 | 2024 | 2028 | CAGR* % 2023-2028 |
|---|---|---|---|---|---|---|
| Frozen Baked Goods | 13.8 | 56.1 | 32.4 | 64.6 | 89.8 | 9.9 |
|
Source: Euromonitor International, 2024 *CAGR: Compound Annual Growth Rate |
||||||
In terms of retail sales volume, frozen baked goods grew by a CAGR of 27.5% from 2018 to 2023, reaching 3.7 thousand tonnes in 2023. It continued to grow by a CAGR of 7.9% from 2018 to 2023, reaching 5.4 thousand tonnes by 2028.
| Category | 2018 | 2023 | CAGR* % 2018-2023 | 2024 | 2028 | CAGR* % 2023-2028 |
|---|---|---|---|---|---|---|
| Frozen Baked Goods | 1.1 | 3.7 | 27.5 | 4.2 | 5.4 | 7.9 |
|
Source: Euromonitor International, 2024 *CAGR: Compound Annual Growth Rate |
||||||
The frozen baked goods company CJ Corp experienced the largest increase in CAGR of 60.1%, reaching US$4.6 million in 2023 from US$0.7 million in 2019.
| Company name | 2018 | 2019 | 2020 | 2021 | 2022 | 2023 | CAGR* % 2019-2023 |
|---|---|---|---|---|---|---|---|
| CJ Corp | 0.7 | 2.7 | 3.1 | 3.6 | 4.6 | 60.1 | |
| Lotte Group | 2.5 | 3.3 | 1.9 | N/C | |||
| Private Label | 7.1 | 10.5 | 13.2 | 17.8 | N/C | ||
| Others | 24.7 | 21.8 | 23.6 | 27.3 | 33.7 | 8.1 | |
| Total | 25.4 | 34.2 | 40.5 | 46.1 | 56.1 | 21.9 | |
|
Source: Euromonitor International, 2024 *CAGR: Compound Annual Growth Rate N/C: Not calculable |
|||||||
The frozen baked goods brand Gourmet (CJ Corp) experienced the largest increase by a CAGR of 60.1%, reaching US$4.6 million in 2023 from US$0.7 million in 2019.
| Brand name | 2018 | 2019 | 2020 | 2021 | 2022 | 2023 | CAGR* % 2019-2023 |
|---|---|---|---|---|---|---|---|
| Gourmet (CJ Corp) | 0.7 | 2.7 | 3.1 | 3.6 | 4.6 | 60.1 | |
| Saeng (Lotte Group) | 2.5 | 3.3 | 1.9 | N/C | |||
| Private Label | 7.1 | 10.5 | 13.2 | 17.8 | N/C | ||
| Others | 24.7 | 21.8 | 23.6 | 27.3 | 33.7 | 8.1 | |
| Total | 25.4 | 34.2 | 40.5 | 46.1 | 56.1 | 21.9 | |
|
Source: Euromonitor International, 2024 *CAGR: Compound Annual Growth Rate N/C: Not calculable |
|||||||
The packaged pastries category experienced the largest increase in a CAGR of 12.3% while unpackaged pastries by a CAGR of 3.1% from 2018 to 2023, reaching US$394.6 million and US$543.5 million respectively in 2023.
| Category | 2018 | 2023 | CAGR* % 2018-2023 | 2024 | 2028 | CAGR* % 2023-2028 |
|---|---|---|---|---|---|---|
| Pastries | 688.1 | 938.0 | 6.4 | 993.7 | 1,237.6 | 5.7 |
| Packaged Pastries | 221.0 | 394.6 | 12.3 | 428.8 | 546.2 | 6.7 |
| Unpackaged Pastries | 467.1 | 543.5 | 3.1 | 564.9 | 691.5 | 4.9 |
|
Source: Euromonitor International, 2024 *CAGR: Compound Annual Growth Rate |
||||||
In terms of retail sales volume, packaged pastries grew by a CAGR of 8.9%, while the unpackaged pastries decreased by a CAGR of −1.0%, reaching 47.1 thousand tonnes and 57.5 thousand tonnes respectively in 2023.
| Category | 2018 | 2023 | CAGR* % 2018-2023 | 2024 | 2028 | CAGR* % 2023-2028 |
|---|---|---|---|---|---|---|
| Pastries | 91.2 | 104.6 | 2.8 | 108.2 | 123.6 | 3.4 |
| Packaged Pastries | 30.7 | 47.1 | 8.9 | 49.9 | 58.3 | 4.4 |
| Unpackaged Pastries | 60.6 | 57.5 | −1.0 | 58.2 | 65.4 | 2.6 |
|
Source: Euromonitor International, 2024 *CAGR: Compound Annual Growth Rate |
||||||
SPC Group experienced an increase by a CAGR of 6.6% from 2018 to 2023 for retail sales of US$268.6 million. Lotte Group recorded US$27.1 million in retail sales in 2023 by a CAGR of −6.2% from 2018 to 2023.
| Company name | 2018 | 2019 | 2020 | 2021 | 2022 | 2023 | CAGR* % 2018-2023 |
|---|---|---|---|---|---|---|---|
| SPC Group | 209.9 | 199.1 | 218.6 | 246.5 | 261.6 | 288.6 | 6.6 |
| Lotte Group | 37.4 | 37.9 | 30.5 | 33.7 | 28.0 | 27.1 | −6.2 |
| Artisanal | 548.7 | 554.3 | 532.0 | 554.8 | 510.4 | 543.5 | −0.2 |
| Private Label | 2.0 | 2.4 | 4.1 | 6.6 | 9.3 | 14.7 | 49.0 |
| Others | 10.3 | 16.7 | 23.7 | 37.3 | 49.9 | 64.2 | 44.2 |
| Total | 808.2 | 810.4 | 808.9 | 879.0 | 859.2 | 938.0 | 3.0 |
|
Source: Euromonitor International, 2024 *CAGR: Compound Annual Growth Rate |
|||||||
Samlip (SPC Group) experienced an increase in CAGR of 6.6% from 2018 to 2023 at the retail sales of US$268.6 million. Lotte (Lotte Group) recorded US$27.1 million retail sales in 2023 at a CAGR of −6.2% from 2018 to 2023.
| Brand name | 2018 | 2019 | 2020 | 2021 | 2022 | 2023 | CAGR* % 2018-2023 |
|---|---|---|---|---|---|---|---|
| Samlip (SPC Group) | 209.9 | 199.1 | 218.6 | 246.5 | 261.6 | 288.6 | 6.6 |
| Lotte (Lotte Group) | 37.4 | 37.9 | 30.5 | 33.7 | 28.0 | 27.1 | −6.2 |
| Artisanal | 548.7 | 554.3 | 532.0 | 554.8 | 510.4 | 543.5 | −0.2 |
| Private Label | 2.0 | 2.4 | 4.1 | 6.6 | 9.3 | 14.7 | 49.0 |
| Others | 10.3 | 16.7 | 23.7 | 37.3 | 49.9 | 64.2 | 44.2 |
| Total | 808.2 | 810.4 | 808.9 | 879.0 | 859.2 | 938.0 | 3.0 |
|
Source: Euromonitor International, 2024 *CAGR: Compound Annual Growth Rate |
|||||||
Distribution channel
The majority of South Korea's bakery products are distributed through store-based retailing versus non-store retailing during the historic period. Grocery retailers distribute most of the products in South Korea representing a market share of 96.1% while the remainder of the bakery products are distributed through non-grocery specialists (general merchandise store) at 3.9% in 2023. Retail offline represents a 97.2% of the total retail channel while non-store retailing (e-commerce) 2.8% in 2023.
Retail e-commerce experienced the largest increase in CAGR (25.0%) followed by convenience retail at 11.4% from 2018 to 2023.
| Outlet type | 2018 | 2019 | 2030 | 2021 | 2022 | 2023 | CAGR* % 2018-2023 |
|---|---|---|---|---|---|---|---|
| Retail Channels | 3,848.8 | 3,768.4 | 3,696.9 | 3,852.7 | 3,632.4 | 3,873.0 | 0.1 |
| Retail Offline | 3,739.9 | 3,631.2 | 3,462.1 | 3,566.1 | 3,330.2 | 3,540.7 | −1.1 |
| Grocery Retailers | 3,592.1 | 3,486.9 | 3,327.2 | 3,431.2 | 3,199.4 | 3,403.2 | −1.1 |
| Convenience Retail | 170.1 | 178.2 | 194.1 | 215.0 | 257.2 | 291.2 | 11.4 |
| Convenience Stores | 164.7 | 172.6 | 188.5 | 210.0 | 252.5 | 286.6 | 11.7 |
| Forecourt Retailers | 5.4 | 5.7 | 5.5 | 5.0 | 4.7 | 4.6 | −3.2 |
| Supermarkets | 287.9 | 267.6 | 293.9 | 296.7 | 194.3 | 204.1 | −6.6 |
| Hypermarkets | 1,643.4 | 1,575.2 | 1,493.5 | 1,529.5 | 1,431.2 | 1,502.7 | −1.8 |
| Warehouse Clubs | 77.0 | 84.8 | 77.6 | 73.2 | 62.5 | 57.3 | −5.7 |
| Food/drink/tobacco specialists | 1,316.3 | 1,290.7 | 1,175.6 | 1,229.0 | 1,173.3 | 1,262.6 | −0.8 |
| Small Local Grocers | 97.4 | 90.4 | 92.4 | 87.8 | 81.0 | 85.2 | −2.6 |
| Non-Grocery Retailers | 147.8 | 144.3 | 134.9 | 134.8 | 130.8 | 137.5 | −1.4 |
| General Merchandise Stores | 147.8 | 144.3 | 134.9 | 134.8 | 130.8 | 137.5 | −1.4 |
| Retail E-Commerce | 108.9 | 137.2 | 234.8 | 286.6 | 302.2 | 332.3 | 25.0 |
| Total | 3,848.8 | 3,768.4 | 3,696.9 | 3,852.7 | 3,632.4 | 3,873.0 | 0.1 |
|
Source: Euromonitor International, 2022 *CAGR: Compound Annual Growth Rate |
|||||||
Product launch analysis
According to Mintel's Global New Products Database (GNPD), 2,899 bakery products were launched in South Korea from 2019 to 2023. Top sub-categories of new bakery products included cakes, pastries & sweet goods with 1,433 launches, sweet biscuits/cookies with 705 launches, bread and bread products with 373 launches and baking ingredients and mixes with 219 launches. Flexible was the most common package type, with 2,308 launches, while flexible stand-up pouch followed with 190. New variety/range extension was the largest new launch type, with 1,312 launches, while new product was second with 1,133 launches and new packaging was third with 350 launches.
| Product attributes | Yearly launch counts | Total | ||||
|---|---|---|---|---|---|---|
| 2019 | 2020 | 2021 | 2022 | 2023 | ||
| Yearly product launches | 507 | 572 | 576 | 621 | 623 | 2,899 |
| Top five sub-categories | ||||||
| Cakes, Pastries and Sweet Goods | 259 | 300 | 264 | 298 | 322 | 1,443 |
| Sweet Biscuits/Cookies | 125 | 124 | 144 | 165 | 147 | 705 |
| Bread and Bread Products | 49 | 66 | 82 | 96 | 80 | 373 |
| Baking Ingredients and Mixes | 47 | 52 | 51 | 30 | 39 | 219 |
| Savoury Biscuits/Crackers | 17 | 16 | 20 | 13 | 14 | 80 |
| Top five claims | ||||||
| Microwaveable | 38 | 63 | 64 | 70 | 96 | 331 |
| Premium | 28 | 53 | 46 | 54 | 65 | 246 |
| Social Media | 51 | 42 | 35 | 40 | 43 | 211 |
| Ease of Use | 27 | 49 | 43 | 47 | 37 | 203 |
| Ethical - Environmentally Friendly Package | 8 | 20 | 26 | 68 | 59 | 181 |
| Imported status | ||||||
| Imported | 51 | 47 | 43 | 70 | 50 | 261 |
| Not imported | 4 | 1 | 4 | 7 | 7 | 23 |
| Top packaged types | ||||||
| Flexible | 415 | 445 | 463 | 507 | 478 | 2,308 |
| Flexible stand-up pouch | 31 | 36 | 41 | 36 | 46 | 190 |
| Carton | 13 | 28 | 19 | 28 | 16 | 104 |
| Tray | 11 | 12 | 15 | 17 | 36 | 91 |
| Tub | 16 | 20 | 7 | 7 | 11 | 61 |
| Top launch types | ||||||
| New Variety/Range Extension | 181 | 261 | 258 | 284 | 328 | 1,312 |
| New Product | 196 | 240 | 251 | 241 | 205 | 1,133 |
| New Packaging | 93 | 57 | 56 | 77 | 67 | 350 |
| Relaunch | 29 | 14 | 11 | 15 | 21 | 90 |
| New Formulation | 8 | 0 | 0 | 4 | 2 | 14 |
| Top five flavours (including blend) | ||||||
| Unflavoured/Plain | 86 | 104 | 108 | 89 | 91 | 478 |
| Chocolate | 64 | 60 | 44 | 44 | 53 | 265 |
| Butter | 7 | 12 | 23 | 24 | 16 | 82 |
| Milk | 10 | 10 | 11 | 13 | 11 | 55 |
| Strawberry | 19 | 9 | 8 | 11 | 7 | 54 |
| Top five ingredients | ||||||
| White Sugar (Food) | 457 | 497 | 490 | 543 | 555 | 2,542 |
| Wheat Flour (Food) | 410 | 451 | 419 | 484 | 504 | 2,268 |
| Salt (Food) | 386 | 434 | 440 | 502 | 500 | 2,262 |
| Eggs (Food) | 247 | 262 | 265 | 290 | 263 | 1,327 |
| Food Acids | 235 | 229 | 232 | 277 | 255 | 1,228 |
| Top five companies | ||||||
| SPC Samlip | 63 | 98 | 59 | 58 | 84 | 362 |
| Lotte Confectionery | 69 | 58 | 33 | 35 | 12 | 207 |
| Emart / E-Mart | 31 | 32 | 9 | 20 | 23 | 115 |
| Paris Croissant | 34 | 22 | 13 | 10 | 10 | 89 |
| Haitai Confectionery & Foods | 12 | 5 | 17 | 15 | 22 | 71 |
| Source: Mintel GNPD, 2024 | ||||||
Examples of new product launches
Cream Cookies

| Company | Quality Food Group |
|---|---|
| Manufacturer | Quality Food Group |
| Importer | Organic Story |
| Brand | Delser |
| Category | Bakery |
| Sub-category | Sweet biscuits / cookies |
| Market | South Korea |
| Store type | Internet / mail order |
| Date published | December 2023 |
| Launch type | New product |
| Price in local currency | KRW5,500.00 |
| Price in US dollars | 4.23 |
| Price in Euros | 3.87 |
Delser Cream Cookies are now available, and retails in a 270 gram pack. - Italian master bakery - With 100% Italian cream and fresh 100% Italian free-range eggs - Cookies with cream
High Calcium Love Palmier Pastry

| Company | Foodmerce |
|---|---|
| Manufacturer | Seoul Food Industrial |
| Distributor | Foodmerce |
| Brand | Pulmuone Pul's Kitchen |
| Category | Bakery |
| Sub-category | Baking ingredients and mixes |
| Market | South Korea |
| Store type | Internet / mail order |
| Date published | December 2023 |
| Launch type | New variety / range extension |
| Price in local currency | KRW19,900.00 |
| Price in US dollars | 15.38 |
| Price in Euros | 14.14 |
Pulmuone Pul's Kitchen High Calcium Love Palmier Pastry is now available, and retails in an 800 gram pack containing 20 40 gram units. - Contains seaweed powder - Logos and certifications: QR code, HACCP
Whole Wheat Mugwort Choco Pie
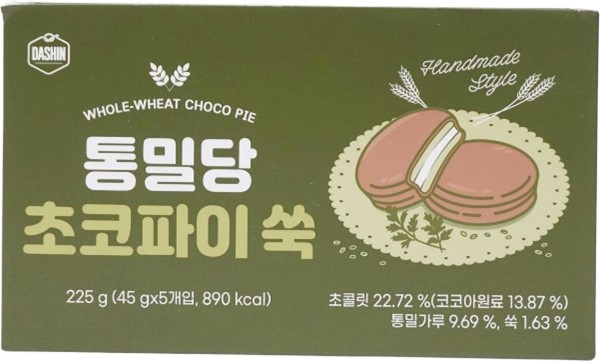
| Company | Funnym |
|---|---|
| Manufacturer | Young Food System |
| Distributor | Funnym |
| Brand | Dashin Tongmildang |
| Category | Bakery |
| Sub-category | Cakes, pastries and sweet goods |
| Market | South Korea |
| Date published | December 2023 |
| Launch type | New variety / range extension |
| Price in local currency | KRW15,700.00 |
| Price in US dollars | 12.13 |
| Price in Euros | 11.16 |
Dashin Tongmildang Whole Wheat Mugwort Choco Pie is now available, and retails in a 225 gram pack containing five 45 gram units. - Handmade style- Logos and certifications: HACCP
Corn Cream Bread
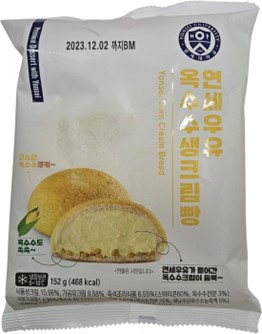
| Company | Food Core |
|---|---|
| Manufacturer | Food Core |
| Brand | Yonsei University Yonsei Milk |
| Category | Bakery |
| Sub-category | Cakes, pastries amd sweet goods |
| Market | South Korea |
| Store name | CU |
| Store type | Convenience store |
| Date published | December 2023 |
| Launch type | New variety / range extension |
| Price in local currency | KRW3,000.00 |
| Price in US dollars | 2.32 |
| Price in Euros | 2.13 |
Yonsei University Yonsei Milk Corn Cream Bread is now available, and retails in a 152 gram pack. - Filled with corn cream, which is made with Yonsei milk, and corn grains - Topped with aromatic corn cookies
No Sugar Soft Cake
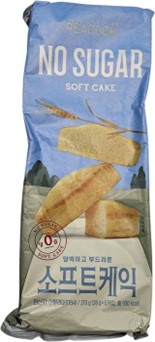
| Company | Emart / E-Mart |
|---|---|
| Manufacturer | Dino Corsini |
| Brand | Peacock |
| Category | Bakery |
| Sub-category | Cakes, pastries and sweet goods |
| Market | South Korea |
| Location of manufacture | Italy |
| Import status | Imported product |
| Store type | Mass merchandise / hypermarket |
| Store address | Seoul 05269 |
| Date published | December 2023 |
| Launch type | New variety / range extension |
| Price in local currency | KRW3,980.00 |
| Price in US dollars | 3.08 |
| Price in Euros | 2.83 |
Peacock No Sugar Soft Cake is now available, and retails in a 216 gram pack containing six 36 gram units. - Contains 0 grams sugar
For more information
The Canadian Trade Commissioner Service:
International Trade Commissioners can provide Canadian industry with on-the-ground expertise regarding market potential, current conditions and local business contacts, and are an excellent point of contact for export advice.
More agri-food market intelligence:
International agri-food market intelligence
Discover global agriculture and food opportunities, the complete library of Global Analysis reports, market trends and forecasts, and information on Canada's free trade agreements.
Agri-food market intelligence service
Canadian agri-food and seafood businesses can take advantage of a customized service of reports and analysis, and join our email subscription service to have the latest reports delivered directly to their inbox.
More on Canada's agriculture and agri-food sectors:
Canada's agriculture sectors
Information on the agriculture industry by sector. Data on international markets. Initiatives to support awareness of the industry in Canada. How the department engages with the industry.
Resources
- Global Trade Tracker, 2024
- Euromonitor International, 2024
- Euromonitor International 2023, Baked Goods in South Korea
- Mintel Global New Products Database, 2024
Sector Trend Analysis – Bakery trends in South Korea
Global Analysis Report
Prepared by: Hongli Wang, Market Analyst
© His Majesty the King in Right of Canada, represented by the Minister of Agriculture and Agri-Food (2024).
Photo credits
All photographs reproduced in this publication are used by permission of the rights holders.
All images, unless otherwise noted, are copyright His Majesty the King in Right of Canada.
To join our distribution list or to suggest additional report topics or markets, please contact:
Agriculture and Agri-Food Canada, Global Analysis1341 Baseline Rd, Tower 5, 3rd floor
Ottawa ON K1A 0C5
Canada
Email: aafc.mas-sam.aac@agr.gc.ca
The Government of Canada has prepared this report based on primary and secondary sources of information. Although every effort has been made to ensure that the information is accurate, Agriculture and Agri-Food Canada (AAFC) assumes no liability for any actions taken based on the information contained herein.
Reproduction or redistribution of this document, in whole or in part, must include acknowledgement of agriculture and agri-food Canada as the owner of the copyright in the document, through a reference citing AAFC, the title of the document and the year. Where the reproduction or redistribution includes data from this document, it must also include an acknowledgement of the specific data source(s), as noted in this document.
Agriculture and Agri-Food Canada provides this document and other report services to agriculture and food industry clients free of charge.