

Note: This report includes forecasting data that is based on baseline historical data.
Executive summary
In 2021, Mexico imported a total of US$198.5 million (72.1 thousand tonnes) of bread and bakery products - growing at a value compound annual growth rate (CAGR) of 8.6% (2017-2021). Top supplier markets to Mexico included the United States at a market share of 79.2%, Canada (4.7%), and Guatemala (3.1%). Canada ranking as the 2nd largest market supplied a value of US$9.4 million in 2021, with a CAGR of 25% over the 5-year period.
Retail sales of bread and bakery goods in the Mexican market totaled US$21.2 billion in 2021, growing at a CAGR of 7.9% between 2016 and 2021. Bread was the best performing category at a value market share of 71.9%, followed by pastries (19.4%), cakes (6.3%), dessert mixes (2.0%), and frozen baked goods, dessert cakes, sweet pies and tarts (0.4%) in 2021. Tortillas is the most popular and affordable staple in Mexico, where the flat bread is often the main source of food for the poorest of consumers.
Early in 2022, given the importance tortillas play on the local Mexican diet, the government in efforts to contain price increases on basic goods and services due to inflation, bought over half-a-million tons of white corn flour. Nevertheless, manufacturers of baked goods continue to suffer as a result of issues like rising energy and key ingredient prices, supply shortages, along with the impact of climate change on harvests. Although the sector is showing signs of value growth after the pandemic, volume sales are expected to be lower over the forecast period (2021 to 2026).
In Mexico, Grupo Bimbo SAB de CV (brands: Bimbo, Tía Rosa, Marinela) at a 15.5% value share is expected to maintain its lead in baked goods in 2022 - yet, has been losing share due to growing competition from artisanal products (79.1%). Other leading companies (brand) in the bread and bakery category were Kraft Heinz Company (Jell-O), D'Gari SA de CV (D'Gari), Con Alimentos SA de CV (Pronto), and General Mills Inc. (Betty Crocker) in 2021. Private labels held a 0.6% share over last year.
Trade of bread and bakery products
In 2021, global imports of bread and bakery products (excluding crispbread, gingerbread, sweet biscuits, waffles, non-communion wafers, rusks, toasted bread and similar products) totaled an import value of US$27.2 billion (8,697.6 thousand tonnes). Leading global import markets were the United States (US$5.1 billion), the United Kingdom (US$2.0 billion), and Germany (US$2.0 billion). Following France (US$1.7 billion) in 2021, Canada was the 5th largest importer of bread and bakery products at a value of US$1.3 billion (382.5 thousand tonnes) with a CAGR of 4.6% (2017 to 2021).
Amongst the top 10 markets in the world with a total market share of 59.8%, all of these importers of bread and bakery products have been growing by a total CAGR of 8.3% (US$16.2 billion) over the last 5-year period (2017to 2021). Leading markets with the highest growth over this period, were the United States at a CAGR of 12.5%, followed by the Netherlands (10.4%), and Australia (9.5%).
| Country | 2017 | 2018 | 2019 | 2020 | 2021 | CAGR* % 2017-2021 | Market share % 2021 |
|---|---|---|---|---|---|---|---|
| Total - bread and bakery products | 20,107.6 | 22,091.2 | 23,345.0 | 23,672.0 | 27,157.0 | 7.8 | 100.0 |
| 1. United States | 3,200.4 | 3,615.0 | 3,942.3 | 4,215.2 | 5,126.1 | 12.5 | 18.9 |
| 2. United Kingdom | 1,733.8 | 1,912.5 | 2,126.4 | 2,150.4 | 2,048.0 | 4.3 | 7.5 |
| 3. Germany | 1,454.6 | 1,602.5 | 1,692.2 | 1,752.3 | 2,029.7 | 8.7 | 7.5 |
| 4. France | 1,264.1 | 1,414.7 | 1,435.8 | 1,472.5 | 1,707.9 | 7.8 | 6.3 |
| 5. Canada | 1,116.0 | 1,168.3 | 1,235.7 | 1,270.0 | 1,334.5 | 4.6 | 4.9 |
| 6. Netherlands | 797.8 | 918.6 | 969.4 | 987.2 | 1,186.2 | 10.4 | 4.4 |
| 7. Belgium | 718.5 | 768.1 | 762.8 | 688.7 | 929.5 | 6.7 | 3.4 |
| 8. Australia | 439.7 | 480.7 | 523.9 | 542.3 | 632.7 | 9.5 | 2.3 |
| 9. Italy | 581.5 | 626.7 | 597.3 | 567.9 | 625.1 | 1.8 | 2.3 |
| 10. Spain | 468.1 | 538.5 | 576.0 | 495.5 | 606.6 | 6.7 | 2.2 |
| Subtotal - top 10 importers | 11,774.6 | 13,045.5 | 13,861.6 | 14,141.9 | 16,226.5 | 8.3 | 59.8 |
|
Source: Global Trade Tracker, 2022 *CAGR: Compound Annual Growth Rate |
|||||||
| Country | 2017 | 2018 | 2019 | 2020 | 2021 | CAGR* % 2017-2021 | Market share % 2021 |
|---|---|---|---|---|---|---|---|
| Total - bread and bakery products | 7,091,432 | 7,509,224 | 8,052,515 | 8,112,080 | 8,697,613 | 5.2 | 100.0 |
| 1. United States | 971,027 | 1,063,298 | 1,139,718 | 1,198,239 | 1,373,720 | 9.1 | 15.8 |
| 2. Germany | 543,403 | 576,952 | 637,456 | 642,193 | 706,063 | 6.8 | 8.1 |
| 3. United Kingdom | 668,182 | 706,132 | 785,319 | 795,084 | 670,714 | 0.1 | 7.7 |
| 4. France | 451,733 | 461,559 | 480,876 | 504,242 | 573,572 | 6.2 | 6.6 |
| 5. Netherlands | 300,238 | 318,109 | 394,289 | 449,267 | 480,746 | 12.5 | 5.5 |
| 6. Canada | 386,470 | 396,970 | 404,768 | 391,519 | 382,473 | −0.3 | 4.4 |
| 7. Belgium | 296,724 | 303,697 | 297,470 | 261,206 | 343,122 | 3.7 | 3.9 |
| 8. Italy | 215,494 | 226,697 | 234,789 | 219,144 | 233,972 | 2.1 | 2.7 |
| 9. Spain | 164,350 | 172,980 | 199,231 | 183,641 | 210,275 | 6.4 | 2.4 |
| 10. Austria | 162,590 | 175,179 | 195,371 | 182,476 | 194,187 | 4.5 | 2.2 |
| Subtotal - top 10 importers | 4,160,211 | 4,401,573 | 4,769,287 | 4,827,011 | 5,168,844 | 5.6 | 59.4 |
| 12. Australia | 111,452 | 117,731 | 129,707 | 137,875 | 145,112 | 7.2 | 1.5 |
|
Source: Global Trade Tracker, 2022 *CAGR: Compound Annual Growth Rate |
|||||||
In 2021, Mexico imported a total value of US$198.5 million (72.1 thousand tonnes) of bread and bakery food products from the world. Leading suppliers to Mexico were the United States at a market share of 79.2% (US$157.2 million), Canada at 4.7% (US$9.4 million), and Guatemala at 3.1% (US$6.2 million). Canada as the 2nd largest import market from Mexico has been growing at a CAGR of 25.0% (2017-2021).
The total Mexican bread and bakery import sector grew by a CAGR of 8.6% between 2017 and 2021. Growing value import markets from Mexico with high CAGRs during this period (≥29%) includes Turkey, Romania, Vietnam, France, Peru, and Spain.
| Country | 2017 | 2018 | 2019 | 2020 | 2021 | CAGR* % 2017-2021 | Market share % 2021 |
|---|---|---|---|---|---|---|---|
| Total - bread and bakery products | 142.6 | 161.5 | 185.6 | 168.0 | 198.5 | 8.6 | 100.0 |
| 1. United States | 123.5 | 137.7 | 149.6 | 143.9 | 157.2 | 6.2 | 79.2 |
| 2. Canada | 3.8 | 3.8 | 4.1 | 3.7 | 9.4 | 25.0 | 4.7 |
| 3. Guatemala | 7.7 | 7.5 | 7.9 | 4.7 | 6.2 | −5.3 | 3.1 |
| 4. Romania | 0.0 | 0.160 | 0.069 | 1.4 | 6.1 | 235.6 | 3.0 |
| 5. France | 1.0 | 1.8 | 3.6 | 3.6 | 5.1 | 48.5 | 2.6 |
| 6. Spain | 1.4 | 2.8 | 3.1 | 3.3 | 3.9 | 29.0 | 2.0 |
| 7. Italy | 2.2 | 3.3 | 2.7 | 2.7 | 3.1 | 9.4 | 1.6 |
| 8. Turkey | 0.0 | 0.026 | 0.149 | 0.071 | 1.8 | 2,699.8 | 0.9 |
| 9. Peru | 0.263 | 0.925 | 1.2 | 0.744 | 0.914 | 36.5 | 0.5 |
| 10. Vietnam | 0.058 | 0.071 | 0.086 | 0.255 | 0.627 | 81.6 | 0.3 |
| Subtotal - top 10 suppliers | 140.0 | 158.0 | 172.6 | 164.5 | 194.4 | 8.5 | 97.9 |
|
Source: Global Trade Tracker, 2022 *CAGR: Compound Annual Growth Rate |
|||||||
| Country | 2017 | 2018 | 2019 | 2020 | 2021 | CAGR* % 2017-2021 | Market share % 2021 |
|---|---|---|---|---|---|---|---|
| Total - bread and bakery products | 58,262 | 58,616 | 66,668 | 62,324 | 72,090 | 5.5 | 100.0 |
| 1. United States | 52,320 | 51,428 | 56,388 | 55,603 | 60,367 | 3.6 | 83.7 |
| 2. Guatemala | 3,239 | 3,131 | 3,289 | 2,015 | 2,704 | −4.4 | 3.8 |
| 3. Canada | 730 | 740 | 833 | 747 | 2,396 | 34.6 | 3.3 |
| 4. Romania | 0 | 54 | 20 | 482 | 1,961 | 231.2 | 2.7 |
| 5. Spain | 411 | 814 | 1,008 | 941 | 1,177 | 30.1 | 1.6 |
| 6. France | 262 | 387 | 841 | 792 | 958 | 38.3 | 1.3 |
| 7. Turkey | 0 | 10 | 59 | 24 | 661 | 304.3 | 0.9 |
| 8. Italy | 403 | 625 | 504 | 491 | 491 | 5.1 | 0.7 |
| 9. Peru | 139 | 421 | 540 | 343 | 391 | 29.5 | 0.5 |
| 10. China | 341 | 329 | 366 | 172 | 215 | −10.9 | 0.3 |
| Subtotal - top 10 suppliers | 57,845 | 57,939 | 63,848 | 61,610 | 71,321 | 5.4 | 98.9 |
| 12. Vietnam | 18 | 23 | 29 | 74 | 109 | 56.9 | 0.2 |
|
Source: Global Trade Tracker, 2022 *CAGR: Compound Annual Growth Rate |
|||||||
Retail sales and trends - bread and bakery products
Baked goods retail sales in Mexico have increased at a CAGR of 7.9% from 2016 to 2021, reaching US$21.2 billion in 2021. The sector is expected to remain relatively stable in growth at a CAGR of 7.9% from 2021 to 2026, reaching US$31.0 billion in 2026. Bread was the best performing category at a market share of 71.9%, followed by pastries (19.4%), cakes (6.3%), dessert mixes (2.0%), and frozen baked goods, dessert cakes, sweet pies and tarts (0.4%) in 2021.
The government's measures to try to contain price increases on basic goods and services to curb the impact of inflation have impacted the baked goods category in 2022. As the Mexican government tries to reach agreements with suppliers to maintain the prices on basic products such as leavened bread and flat bread, manufacturers of baked goods continue to suffer as a result of issues like rising energy and key ingredient prices, supply shortages, and the impact of climate changes on harvests.Footnote 1
Foodservice volume sales of baked goods have continued to recover in 2022 with the lifting of COVID-19 restrictions, particularly for flat bread, which is a key component used in many dishes through the foodservice channel. However, the channel still has limited growth with consumers being forced to reduce their non-essential spending as many households are facing widespread financial challenges.Footnote 1
| Category | 2016 | 2021 | CAGR* % 2016-2021 | 2022 | 2026 | CAGR* % 2021-2026 |
|---|---|---|---|---|---|---|
| Total - baked goods | 14,466.8 | 21,161.5 | 7.9 | 23,801.0 | 30,972.6 | 7.9 |
| Bread | 10,098.3 | 15,225.3 | 8.6 | 17,265.1 | 22,479.2 | 8.1 |
| Cakes | 1,072.7 | 1,338.8 | 4.5 | 1,458.0 | 1,804.1 | 6.1 |
| Dessert mixes | 270.4 | 430.3 | 9.7 | 457.4 | 551.5 | 5.1 |
| Frozen baked goods | 16.2 | 24.1 | 8.3 | 26.8 | 37.6 | 9.3 |
| Frozen dessert cakes, sweet pies and tarts | 26.3 | 32.2 | 4.1 | 36.0 | 50.6 | 9.5 |
| Pastries | 2,983.0 | 4,110.8 | 6.6 | 4,557.6 | 6,049.5 | 8.0 |
|
Source: Euromonitor, 2022 *CAGR: Compound Annual Growth Rate |
||||||
| Category | 2016 | 2021 | CAGR* % 2016-2021 | 2022 | 2026 | CAGR* % 2021-2026 |
|---|---|---|---|---|---|---|
| Total - baked goods | 12,275.2 | 13,736.5 | 2.3 | 13,630.9 | 14,795.5 | 1.5 |
| Bread | 11,299.7 | 12,710.6 | 2.4 | 12,599.0 | 13,700.9 | 1.5 |
| Cakes | 170.0 | 164.8 | −0.6 | 164.7 | 167.4 | 0.3 |
| Dessert mixes | 79.3 | 97.3 | 4.2 | 94.6 | 95.1 | −0.5 |
| Frozen baked goods | 3.7 | 4.1 | 2.1 | 4.2 | 4.6 | 2.3 |
| Frozen dessert cakes, sweet pies and tarts | 4.0 | 3.8 | −1.0 | 3.9 | 4.4 | 3.0 |
| Pastries | 718.5 | 756.0 | 1.0 | 764.6 | 823.0 | 1.7 |
|
Source: Euromonitor, 2022 *CAGR: Compound Annual Growth Rate |
||||||
In 2021, leading bakery companies and top brand(s) in the Mexican market included Grupo Bimbo SAB de CV (Bimbo, Tía Rosa, Marinela) at a total of US$3.3 billion or 15.5% value share, Kraft Heinz Company (Jell-O) at US$115.1 million (0.5%), and D'Gari SA de CV (D'Gari) at US$105.6 million (0.5%). Artisanal companies held the largest value sales share at 79.1%, while private labels held a 0.6% share at a value of US$119.7 million in 2021.
Grupo Bimbo is expected to maintain its lead in baked goods in 2022, yet has been losing share due to growing competition from artisanal products. Bimbo dominates and benefits most from a broad product portfolio within packaged flat and leavened bread options, while artisanal players account for all sales in the unpackaged flat and leavened bread categories sold through local bakeries and tortilla shops.Footnote 1
| Company | Brand(s) | Retail sales (US$ million) | Market share % 2021 |
|---|---|---|---|
| Grupo Bimbo SAB de CV | Bimbo, Tía Rosa, Marinela, Suandy, Milpa Real, Wonder, Oroweat | 3,286.7 | 15.5 |
| Kraft Heinz Company | Jell-O | 115.1 | 0.5 |
| D'Gari SA de CV | D'Gari | 105.6 | 0.5 |
| Con Alimentos SA de CV | Pronto | 31.4 | 0.1 |
| General Mills Inc | Betty Crocker | 31.3 | 0.1 |
| Artisanal | Artisanal | n/a | 79.1 |
| Private label | Private label | 119.7 | 0.6 |
| Others | Others | 17,471.6 | 3.5 |
| Total - market share | 21,161.5 | 100.0 | |
|
Source: Euromonitor, 2022 *CAGR: Compound Annual Growth Rate n/a: not available |
|||
Bread
Bread is the best performing category within the baked goods sector, with retail value sales increasing by 13.4% over last year in current terms to reach US$17.3 billion in 2022. Flat bread (that is, Pita, Naan, Chapati, Roti, Arepa etc.) saw the most growth with unpackaged flat bread growing the fastest, at a CAGR of 9.4% from 2016 to 2021, reaching US$7.5 billion in 2021. Sales of pre-packaged (produced industrially) and unpackaged (produced artisanally) leavened bread (that is, sourdough, bagels, English muffin, Panbrioche, Pumpernickel and Rye bread etc.) increased by a CAGR of 7.8% over the same period. Bread overall is expected to continue to grow in value sales over 2021-2026, although growth rates are set to slow in volume terms in all bakery categories - representative of price increases in baked goods largely due to the rising costs of raw materials, energy, oil and packaging.
Tortillas (flat bread) is the most popular and affordable staple in Mexico, where tortillas are often the only source of food for the poorest consumers, alongside some beans. Given its importance to the local diet, with the observed consistent price increases due to the rising costs of ingredients, the government intervened by buying over half-a-million tons of white corn flour early in 2022 in efforts to keep prices relatively stable.Footnote 1
| Category | 2016 | 2017 | 2018 | 2019 | 2020 | 2021 |
|---|---|---|---|---|---|---|
| Total - bread | 10,098.3 | 10,716.2 | 11,443.4 | 12,047.8 | 14,489.6 | 15,225.3 |
| Subtotal - flat bread | 5,120.7 | 5,306.7 | 5,623.5 | 5,900.6 | 7,188.0 | 7,984.0 |
| Packaged flat bread | 337.3 | 365.7 | 392.2 | 410.7 | 465.0 | 475.1 |
| Unpackaged flat bread | 4,783.4 | 4,940.9 | 5,231.4 | 5,489.9 | 6,723.0 | 7,508.9 |
| Subtotal - leavened bread | 4,977.6 | 5,409.6 | 5,819.8 | 6,147.2 | 7,301.6 | 7,241.3 |
| Packaged leavened | 866.0 | 929.6 | 986.4 | 1,027.6 | 1,161.2 | 1,215.7 |
| Unpackaged leavened | 4,111.6 | 4,480.0 | 4,833.4 | 5,119.6 | 6,140.4 | 6,025.6 |
|
Source: Euromonitor International, 2022 *CAGR: Compound Annual Growth Rate |
||||||
| Category | Annual growth % 2021/2020 | CAGR* % 2016-2021 | Total growth % 2016-2021 |
|---|---|---|---|
| Total - bread | 5.1 | 8.6 | 50.8 |
| Subtotal - flat bread | 11.1 | 9.3 | 55.9 |
| Packaged flat bread | 2.2 | 7.1 | 40.9 |
| Unpackaged flat bread | 11.7 | 9.4 | 57.0 |
| Subtotal - leavened bread | −0.8 | 7.8 | 45.5 |
| Packaged leavened | 4.7 | 7.0 | 40.4 |
| Unpackaged leavened | −1.9 | 7.9 | 46.6 |
|
Source: Euromonitor International, 2022 *CAGR: Compound Annual Growth |
|||
| Category | 2021 | 2022 | 2023 | 2024 | 2025 | 2026 |
|---|---|---|---|---|---|---|
| Total - bread | 15,225.3 | 17,265.1 | 18,534.2 | 19,858.9 | 21,161.0 | 22,479.2 |
| Subtotal - flat bread | 7,984.0 | 9,245.4 | 9,948.5 | 10,683.6 | 11,377.8 | 12,066.7 |
| Packaged flat bread | 475.1 | 542.5 | 592.2 | 639.9 | 685.6 | 730.6 |
| Unpackaged flat bread | 7,508.9 | 8,702.8 | 9,356.3 | 10,043.7 | 10,692.2 | 11,336.0 |
| Subtotal - leavened bread | 7,241.3 | 8,019.8 | 8,585.7 | 9,175.2 | 9,783.2 | 10,412.6 |
| Packaged leavened | 1,215.7 | 1,353.0 | 1,454.9 | 1,557.0 | 1,661.7 | 1,763.6 |
| Unpackaged leavened | 6,025.6 | 6,666.7 | 7,130.8 | 7,618.2 | 8,121.4 | 8,649.0 |
|
Source: Euromonitor International, 2022 *CAGR: Compound Annual Growth Rate |
||||||
| Category | Annual growth % 2022/2021 | CAGR* % 2021-2026 | Total growth % 2021-2026 |
|---|---|---|---|
| Total - bread | 13.4 | 8.1 | 47.6 |
| Subtotal - flat bread | 15.8 | 8.6 | 51.1 |
| Packaged flat bread | 14.2 | 9.0 | 53.8 |
| Unpackaged flat bread | 15.9 | 8.6 | 51.0 |
| Subtotal - leavened bread | 10.8 | 7.5 | 43.8 |
| Packaged leavened | 11.3 | 7.7 | 45.1 |
| Unpackaged leavened | 10.6 | 7.5 | 43.5 |
|
Source: Euromonitor International, 2022 *CAGR: Compound Annual Growth |
|||
In 2021, the leading bread company (top brands) in the Mexican market was Grupo Bimbo SAB de CV (Bimbo, Tía Rosa, Milpa Real, Wonder, Oroweat) at a sales total of US$1.6 billion or 10.2% value share in its category. Meanwhile, artisanal companies held the majority 88.9% market share of the bread sector in Mexico in 2021.
| Company | Brand(s) | Retail sales (US$ million) | Market share % 2021 |
|---|---|---|---|
| Grupo Bimbo SAB de CV | Bimbo, Tía Rosa, Milpa Real, Wonder, Oroweat | 1,557.5 | 10.2 |
| Artisanal | Artisanal | n/a | 88.9 |
| Others | Others | 13,667.8 | 0.9 |
| Total - market share | 15,225.3 | 100.0 | |
|
Source: Euromonitor, 2022 *CAGR: Compound Annual Growth Rate n/a: not available |
|||
Cakes
In 2021, retail sales of both packaged cakes (US$962.5) and unpackaged cakes, incl. muffins (US$376.3 million) totaled US$1.3 billion in Mexico. Between 2016 and 2021, unpackaged cakes (prepared artisanally/baked in-store) grew at a higher CAGR of 6.7% over pre-packaged cakes (3.8%) that accounted for 71.9% of the sales value in the cake category in 2021. With the cost of living rising in Mexico, however, more expensive indulgences such as packaged cakes may be impacted more as further significant price hikes occur over the next 5-year period. Nevertheless, with COVID-19 restrictions on gatherings being lifted and tourism returning this should help to offset and alleviate losses - whereby the cake category is expected to grow at a combined CAGR of 6.1% (2021-2026) to reach US$1.8 billion in 2026.Footnote 1
| Category | 2016 | 2017 | 2018 | 2019 | 2020 | 2021 |
|---|---|---|---|---|---|---|
| Total - cakes | 1,072.7 | 1,140.4 | 1,181.9 | 1,218.3 | 1,303.9 | 1,338.8 |
| Packaged cakes | 799.9 | 843.6 | 863.9 | 882.6 | 917.9 | 962.5 |
| Unpackaged cakes | 272.7 | 296.8 | 318.0 | 335.7 | 386.0 | 376.3 |
|
Source: Euromonitor International, 2022 *CAGR: Compound Annual Growth Rate |
||||||
| Category | Annual growth % 2021/2020 | CAGR* % 2016-2021 | Total growth % 2016-2021 |
|---|---|---|---|
| Total - cakes | 2.7 | 4.5 | 24.8 |
| Packaged cakes | 4.9 | 3.8 | 20.3 |
| Unpackaged cakes | −2.5 | 6.7 | 38.0 |
|
Source: Euromonitor International, 2022 *CAGR: Compound Annual Growth |
|||
| Category | 2021 | 2022 | 2023 | 2024 | 2025 | 2026 |
|---|---|---|---|---|---|---|
| Total - cakes | 1,338.8 | 1,458.0 | 1,548.7 | 1,634.2 | 1,718.3 | 1,804.1 |
| Packaged cakes | 962.5 | 1,038.7 | 1,096.1 | 1,149.7 | 1,203.7 | 1,260.0 |
| Unpackaged cakes | 376.3 | 419.3 | 452.6 | 484.4 | 514.6 | 544.2 |
|
Source: Euromonitor International, 2022 *CAGR: Compound Annual Growth Rate |
||||||
| Category | Annual growth % 2022/2021 | CAGR* % 2021-2026 | Total growth % 2021-2026 |
|---|---|---|---|
| Total - cakes | 8.9 | 6.1 | 34.8 |
| Packaged cakes | 7.9 | 5.5 | 30.9 |
| Unpackaged cakes | 11.4 | 7.7 | 44.6 |
|
Source: Euromonitor International, 2022 *CAGR: Compound Annual Growth |
|||
In 2021, the leading cake company (top brands) in the Mexican market was also, Grupo Bimbo SAB de CV (Marinela, Bimbo, Suandy) at a total value of US$835.2 million or 62.4% value share in its category. Artisanal companies held a 28.1% market share in value terms in 2021.
| Company | Brand(s) | Retail sales (US$ million) | Market share % 2021 |
|---|---|---|---|
| Grupo Bimbo SAB de CV | Marinela, Bimbo, Suandy | 835.2 | 62.4 |
| Artisanal | Artisanal | n/a | 28.1 |
| Others | Others | 503.6 | 9.5 |
| Total - market share | 1,338.8 | 100.0 | |
|
Source: Euromonitor, 2022 *CAGR: Compound Annual Growth Rate n/a: not available |
|||
Dessert mixes and frozen baked goods
In Mexico in 2021, retail sales of dessert mixes (US$430.3 million) and frozen baked goods (US$56.3 million) totaled US$486.6 million, growing at a CAGR of 9.2% (2016-2021). Dessert mixes consisted of 88.4% of value sales, followed by frozen dessert cakes, sweet pies and tarts (excluding ice cream desserts) at 6.6%, and other frozen baked goods, excluding cakes (that is, frozen croissants, waffles, pizza crusts, pie/pastry shells, garlic bread etc.) at 5.0% in 2021.
Frozen baked goods (9.3%), including frozen dessert cakes, sweet pies and tarts (9.5%) are expected to report the highest CAGRs between 2021 and 2026 - to reach combined sales values of US$88.2 million in 2026.
| Category | 2016 | 2017 | 2018 | 2019 | 2020 | 2021 |
|---|---|---|---|---|---|---|
| Total - dessert mixes and frozen baked goods | 312.9 | 338.3 | 364.2 | 392.3 | 448.7 | 486.6 |
| Dessert mixes | 270.4 | 294.8 | 317.5 | 342.7 | 397.2 | 430.3 |
| Frozen baked goods | 16.2 | 17.9 | 19.3 | 20.5 | 22.0 | 24.1 |
| Frozen dessert cakes, sweet pies and tarts | 26.3 | 25.6 | 27.4 | 29.1 | 29.5 | 32.2 |
|
Source: Euromonitor International, 2022 *CAGR: Compound Annual Growth Rate |
||||||
| Category | Annual growth % 2021/2020 | CAGR* % 2016-2021 | Total growth % 2016-2021 |
|---|---|---|---|
| Total - dessert mixes and frozen baked goods | 8.4 | 9.2 | 55.5 |
| Dessert mixes | 8.3 | 9.7 | 59.1 |
| Frozen baked goods | 9.5 | 8.3 | 48.8 |
| Frozen dessert cakes, sweet pies and tarts | 9.2 | 4.1 | 22.4 |
|
Source: Euromonitor International, 2022 *CAGR: Compound Annual Growth |
|||
| Category | 2021 | 2022 | 2023 | 2024 | 2025 | 2026 |
|---|---|---|---|---|---|---|
| Total - dessert mixes and frozen baked goods | 486.6 | 520.2 | 544.7 | 572.8 | 604.5 | 639.7 |
| Dessert mixes | 430.3 | 457.4 | 476.0 | 498.0 | 523.3 | 551.5 |
| Frozen baked goods | 24.1 | 26.8 | 29.3 | 31.9 | 34.6 | 37.6 |
| Frozen dessert cakes, sweet pies and tarts | 32.2 | 36.0 | 39.4 | 42.9 | 46.6 | 50.6 |
|
Source: Euromonitor International, 2022 *CAGR: Compound Annual Growth Rate |
||||||
| Category | Annual growth % 2022/2021 | CAGR* % 2021-2026 | Total growth % 2021-2026 |
|---|---|---|---|
| Total - dessert mixes and frozen baked goods | 6.9 | 5.6 | 31.5 |
| Dessert mixes | 6.3 | 5.1 | 28.2 |
| Frozen baked goods | 11.2 | 9.3 | 56.0 |
| Frozen dessert cakes, sweet pies and tarts | 11.8 | 9.5 | 57.1 |
|
Source: Euromonitor International, 2022 *CAGR: Compound Annual Growth |
|||
In 2021, leading companies (top brand) with the highest sales in the Mexican market within the dessert mixes category included The Kraft Heinz Co. (Jell-O) at a total of US$115.1 million or 26.7% value share in its category, D'Gari SA de CV (D'Gari) at US$105.6 million (24.5%), and Con Alimentos SA de CV (Pronto) at US$31.4 million (7.3%). Private labels held a 3.1% market share at a value of US$13.3 million in 2021.
Last year, leading companies (top brand) in the Mexican market within the frozen baked goods category included The Kellogg Company (Kellogg's Eggo) at a total of US$10.9 million or 45.3% value share in its category, General Mills Inc. (Pillsbury) at US$2.1 million (8.7%), and Deli & Bagel SA de CV (New York Bagels) at US$1.3 million (5.6%). There were no private labels registered in this category in 2021.
In 2021, the leading company (top brand) with the highest sales in the Mexican market within the frozen desserts (incl. cakes, sweet pies and tarts) category was Sara Lee Frozen Bakery (Sara Lee) at a total of US$5.8 million or 18.0% value share in its category. Private labels held the majority 45.9% market share at a value of US$14.8 million in 2021.
| Category | Company | Brand | Retail sales (US$ million) | Market share % 2021 |
|---|---|---|---|---|
| Dessert mixes | Kraft Heinz Company | Jell-O | 115.1 | 26.7 |
| D'Gari SA de CV | D'Gari | 105.6 | 24.5 | |
| Con Alimentos SA de CV | Pronto | 31.4 | 7.3 | |
| General Mills Inc. | Betty Crocker | 29.2 | 6.8 | |
| ConAgra Brands Inc. | Duncan Hines | 17.3 | 4.0 | |
| Private label | Private label | 13.3 | 3.1 | |
| Others | Others | 101.3 | 23.5 | |
| Dessert mixes total - market share | 430.3 | 100.0 | ||
| Frozen baked goods | Kellogg Company | Kellogg's Eggo | 10.9 | 45.3 |
| General Mills Inc. | Pillsbury | 2.1 | 8.7 | |
| Deli & Bagel SA de CV | New York Bagels | 1.3 | 5.6 | |
| Toaster SA de CV | Toaster | 0.4 | 1.8 | |
| Others | Others | 9.3 | 38.6 | |
| Frozen baked goods total - market share | 24.1 | 100.0 | ||
| Frozen dessert, cakes, sweet pies and tarts | Sara Lee Frozen Bakery | Sara Lee | 5.8 | 18.0 |
| Private label | Private label | 14.8 | 45.9 | |
| Others | Others | 11.6 | 36.2 | |
| Frozen dessert, cakes, sweet pies and tarts total - market share | 32.2 | 100.0 | ||
|
Source: Euromonitor, 2022 *CAGR: Compound Annual Growth Rate |
||||
Pastries
In Mexico, retail sales of both packaged pastries (US$1.3 billion) and unpackaged pastries (US$2.8 billion) totaled US$4.1 billion in 2021. Both packaged and unpackaged cakes (that is, pain au chocolat, croissants, buns, viennoiserie, scones, brioche, doughnuts, sweet waffles, crèpes, baklava, savoury pastries like tiropita etc.) grew at approximately the same rate at a combined CAGR of 6.6% (2016-2021) and is expected to grow at a rate of 8.0% (2021-2026) to reach US$6.0 billion in 2026.
| Category | 2016 | 2017 | 2018 | 2019 | 2020 | 2021 |
|---|---|---|---|---|---|---|
| Total - pastries | 2,983.0 | 3,228.2 | 3,460.1 | 3,620.7 | 3,844.8 | 4,110.8 |
| Packaged pastries | 938.6 | 997.0 | 1,069.9 | 1,119.4 | 1,206.9 | 1,285.3 |
| Unpackaged pastries | 2,044.4 | 2,231.3 | 2,390.2 | 2,501.3 | 2,637.9 | 2,825.4 |
|
Source: Euromonitor International, 2022 *CAGR: Compound Annual Growth Rate |
||||||
| Category | Annual growth % 2021/2020 | CAGR* % 2016-2021 | Total growth % 2016-2021 |
|---|---|---|---|
| Total - pastries | 6.9 | 6.6 | 37.8 |
| Packaged pastries | 6.5 | 6.5 | 36.9 |
| Unpackaged pastries | 7.1 | 6.7 | 38.2 |
|
Source: Euromonitor International, 2022 *CAGR: Compound Annual Growth |
|||
| Category | 2021 | 2022 | 2023 | 2024 | 2025 | 2026 |
|---|---|---|---|---|---|---|
| Total - pastries | 4,110.8 | 4,557.6 | 4,927.5 | 5,304.7 | 5,679.3 | 6,049.5 |
| Packaged pastries | 1,285.3 | 1,427.0 | 1,545.8 | 1,667.0 | 1,783.2 | 1,897.6 |
| Unpackaged pastries | 2,825.4 | 3,130.6 | 3,381.7 | 3,637.7 | 3,896.2 | 4,152.0 |
|
Source: Euromonitor International, 2022 *CAGR: Compound Annual Growth Rate |
||||||
| Category | Annual growth % 2022/2021 | CAGR* % 2021-2026 | Total growth % 2021-2026 |
|---|---|---|---|
| Total - pastries | 10.9 | 8.0 | 47.2 |
| Packaged pastries | 11.0 | 8.1 | 47.6 |
| Unpackaged pastries | 10.8 | 8.0 | 47.0 |
|
Source: Euromonitor International, 2022 *CAGR: Compound Annual Growth |
|||
In 2021, the leading pastry company (top brands) in the Mexican market was the Grupo Bimbo SAB de CV (Tía Rosa, Bimbo) at a total of US$894 million or 21.7% value share in its category. Artisanal companies held the highest market share at 68.7%, while private labels held a 2.2% share at a value of US$91.6 million over the year.
| Company | Brand(s) | Retail sales (US$ million) | Market share % 2021 |
|---|---|---|---|
| Grupo Bimbo SAB de CV | Tía Rosa, Bimbo | 894.0 | 21.7 |
| Artisanal | Artisanal | n/a | 68.7 |
| Private Label | Private Label | 91.6 | 2.2 |
| Others | Others | 3,125.2 | 7.3 |
| Total - market share | 4,110.8 | 100.0 | |
|
Source: Euromonitor, 2022 *CAGR: Compound Annual Growth Rate n/a: not available |
|||
Distribution channels of bakery products (off-trade)
In Mexico, distribution of bakery products in terms of value share did not change much amongst outlet channels between 2016 and 2021. Store-based grocery retailer outlets had the largest sales (98.7%) at a value of US$20.9 billion in 2021 (share down 0.6 percentage points) since 2016, followed by non-store e-commerce and vending retailers at US$145.4 million (remained stable at 0.7% share), and store-based/non-grocery health and beauty specialists at US$124.9 million (up from 0% to 0.6% share).
Bakeries (food/drink/tobacco specialists) remains the leading retail distribution channel (US$8 billion) with most of the baked goods purchased in Mexico going toward artisanal players, especially with some consumers returning to their local bakeries over shopping in larger grocery retailers now that the fears of COVID-19 have resided.Footnote 1 Other leading channel outlets were small local grocers (US$4.9 billion), discounter grocery retailers (US$2.6 billion) and hypermarket grocer outlets (US$2.4 billion) in 2021.
| Outlet Type | 2016 | 2021 | ||
|---|---|---|---|---|
| Value | Share (%) | Value | Share (%) | |
| Total - retail channels | 14,466.8 | 100.0 | 21,161.5 | 100.0 |
| Store-based retail | 14,372.7 | 99.4 | 21,016.2 | 99.3 |
| Total - grocery retailers | 14,366.8 | 99.3 | 20,891.3 | 98.7 |
| Convenience retail | 587.0 | 4.1 | 879.0 | 4.2 |
| Convenience stores | 553.1 | 3.8 | 826.1 | 3.9 |
| Forecourt retailers | 33.8 | 0.2 | 52.8 | 0.2 |
| Discounters | 1,772.8 | 12.3 | 2,623.8 | 12.4 |
| Food/drink/tobacco specialists | 5,570.5 | 38.5 | 8,000.7 | 37.8 |
|
Hypermarkets |
1,668.9 | 11.5 | 2,442.5 | 11.5 |
| Small local grocers | 3,409.6 | 23.6 | 4,928.5 | 23.3 |
| Supermarkets | 1,125.4 | 7.8 | 1,648.1 | 7.8 |
| Warehouse clubs | 232.6 | 1.6 | 368.7 | 1.7 |
| Total - non-grocery specialists | 5.9 | 0.0 | 124.9 | 0.6 |
| Health and beauty specialists | 5.9 | 0.0 | 124.9 | 0.6 |
| Non-store retailing | 94.1 | 0.7 | 145.4 | 0.7 |
| Retail E-Commerce | 14.3 | 0.1 | 47.6 | 0.2 |
| Vending | 79.8 | 0.6 | 97.8 | 0.5 |
| Source: Euromonitor International, 2022 | ||||
Product launch and trend analysis: bread and bakery products
Mintel's Global New Products Database (GNPD) indicates that there were 998 new bread and bakery products launched (including new variety/range extension, packaging, formulation or relaunched) in Mexico between January 2017 and November 2, 2022.
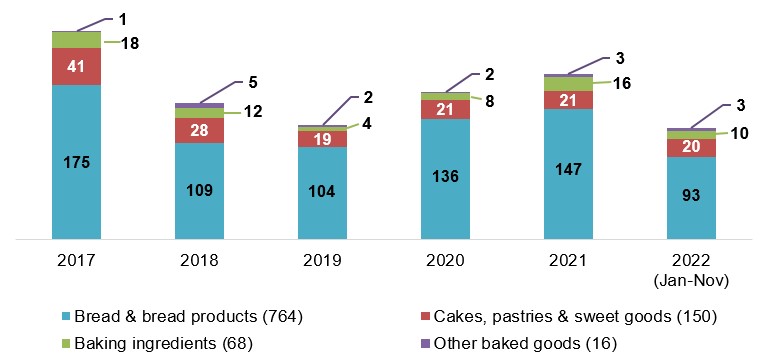
Description of above image
| 2017 | 2018 | 2019 | 2020 | 2021 | 2022 (January-November) | Total | |
|---|---|---|---|---|---|---|---|
| Bread and bread products | 175 | 109 | 104 | 136 | 147 | 93 | 764 |
| Cakes, pastries and sweet goods | 41 | 28 | 19 | 21 | 21 | 20 | 150 |
| Baking ingredients | 18 | 12 | 4 | 8 | 16 | 10 | 68 |
| Other baked goods | 1 | 5 | 2 | 2 | 3 | 3 | 16 |
Source: Mintel, 2022
Top parent companies launching bread and bakery products in Mexico between 2017 and 2022 (Jan. - Nov.) were Grupo Bimbo (581), Walmart (55), Supermercados Internacionales H-E-B (55), Gruma (24), and Mission Foods (24). More recently between Q4-2021 vs. Q4-2022, top companies launching a total of 171 new products were Grupo Bimbo (48), Walmart (8), Tiendas Tres B/Chedraui (8), Deli Dips and Snacks (7), and Distribuidora New York Deli & Bagel (6).
Top bread and bakery brands (January 2017 to November 2022) included Bimbo (Nito/Medias Noches) (91), Great Value (21), Tía Rosa (Tortillinas/Rosa Bigotes) (46), Libanius (16), and Hill Country Fare (15). Recent new brands launched into the Mexican market (October 2022) were Rialto Rústica Tostada (round toasted Biscottinas with olive oil and salt), Santo Apetito (corn Tortillas), Pedrito Bakery (wholegrain sweet bread), and Dora3 Linea Classica (puff pastry croissant with strawberry filling).
Leading manufacturer locations for these bread and bakery products over the 6 year period (2017-2022) were Mexico (740), the United States (92), Spain (29), Italy (26) and the Canada (9). The latest Canadian brands launched in the Mexican market back in December and April 2021 was Dare Boulangerie Grissol (original Melba toast) from Dare Foods and Furlani Texas Toast (Garlic bread) manufactured by Furlani's Food.
Popular or top growing flavours (including blends) were Sesame (+200%), and unflavoured/plain (+3.7%) [Q4-2020 and Q4-2022]. Declining flavours during this period were Oregano (−100%), seed (−50%), and chocolate (−33.3%). New ingredients within the last 12 months included Ganache, cream flavour, Polysorbate, cheese sauce, Emmental cheese, soft cheese, wheat grit, elderberry juice concentrate. Top packaging materials/types for these bread and bakery products from the last 2 years (Q3-2021 vs. Q3-2022) were flexible stand-up pouch (+500%) and plastic LDPE/unspecified (+28%) with declining packaging combinations of flexible (−26%) and plastic PP (−60%).
Meanwhile, top related claim combinations associated with these bread and bakery products used the most during the last three months were Kosher (23.3%), low/no/reduced allergen (16.3%), gluten free (16.3%), no additives/preservatives (9.3%), high/added fibre (7%), and digestive health (4.7%). Trending claims were gluten free (+450%), ease of use (+400%), low/no/reduced allergens (+267%), low/no/reduced cholesterol (+200%), and dairy free (+100%); with declining claims by 100% being plant-based, vitamin/mineral fortified, all natural product and premium (−80%) between Q3-2021 and Q3-2022.
| Product attributes | Yearly launch counts | ||||||
|---|---|---|---|---|---|---|---|
| 2017 | 2018 | 2019 | 2020 | 2021 | 2022 | Total | |
| Yearly product launches | 235 | 154 | 129 | 167 | 187 | 126 | 998 |
| Top launch types | |||||||
| New packaging | 126 | 58 | 59 | 98 | 122 | 75 | 538 |
| New variety/range extension | 62 | 49 | 31 | 45 | 40 | 34 | 261 |
| New product | 36 | 39 | 28 | 18 | 11 | 12 | 144 |
| Relaunch | 10 | 8 | 9 | 5 | 14 | 5 | 51 |
| New formulation | 1 | 0 | 2 | 1 | 0 | 0 | 4 |
| Top sub-categories | |||||||
| Bread and bread products | 175 | 109 | 104 | 136 | 147 | 93 | 764 |
| Cakes, pastries and sweet goods | 41 | 28 | 19 | 21 | 21 | 20 | 150 |
| Baking Ingredients | 18 | 12 | 4 | 8 | 16 | 10 | 68 |
| Sweet biscuits/cookies | 1 | 4 | 1 | 1 | 1 | 0 | 8 |
| Savoury biscuits/crackers | 0 | 0 | 0 | 1 | 0 | 3 | 4 |
| Top five companies / parent | |||||||
| Grupo Bimbo | 139 | 110 | 56 | 102 | 99 | 75 | 581 |
| Supermercados Internacionales (H-E-B) | 27 | 3 | 10 | 2 | 13 | 0 | 55 |
| Walmart | 16 | 12 | 10 | 7 | 2 | 8 | 55 |
| Gruma | 6 | 3 | 3 | 5 | 5 | 2 | 24 |
| Mission Foods | 6 | 3 | 3 | 5 | 5 | 2 | 24 |
| Top five brands | |||||||
| Bimbo (Nito/Medias Noches) | 24 | 16 | 10 | 19 | 14 | 8 | 91 |
| Tía Rosa (Tortillinas/Rosa Bigotes) | 14 | 5 | 5 | 13 | 7 | 2 | 46 |
| Great Value | 3 | 5 | 3 | 4 | 1 | 5 | 21 |
| Libanius | 1 | 1 | 4 | 2 | 5 | 3 | 16 |
| Hill Country Fare | 6 | 2 | 3 | 0 | 4 | 0 | 15 |
| Import status (if reported) | |||||||
| Imported | 43 | 34 | 25 | 24 | 33 | 21 | 180 |
| Not imported | 167 | 110 | 99 | 128 | 140 | 96 | 740 |
| Top five related claims | |||||||
| Kosher | 39 | 17 | 24 | 29 | 35 | 26 | 170 |
| No Additives/Preservatives | 41 | 15 | 23 | 34 | 25 | 29 | 167 |
| Low/No/Reduced Allergen | 25 | 26 | 19 | 24 | 14 | 19 | 127 |
| Wholegrain | 25 | 23 | 11 | 23 | 26 | 16 | 124 |
| Gluten Free | 25 | 24 | 16 | 23 | 13 | 19 | 120 |
| Top five flavours (including blend) | |||||||
| Unflavoured/Plain | 151 | 93 | 82 | 112 | 111 | 80 | 629 |
| Chocolate | 10 | 6 | 5 | 5 | 4 | 6 | 36 |
| Sesame | 6 | 1 | 2 | 6 | 6 | 5 | 26 |
| Butter | 5 | 9 | 2 | 2 | 6 | 1 | 25 |
| Cactus/Nopal | 4 | 2 | 0 | 5 | 3 | 3 | 17 |
| Top package types | |||||||
| Flexible (stand-up pouch/sachet) | 226 | 148 | 121 | 156 | 178 | 123 | 952 |
| Skinpack | 6 | 2 | 3 | 6 | 3 | 0 | 20 |
| Tray | 2 | 0 | 4 | 1 | 1 | 1 | 9 |
| Clam-pack | 1 | 1 | 1 | 1 | 2 | 1 | 7 |
| Tub | 0 | 1 | 0 | 2 | 1 | 0 | 4 |
| Source: Mintel; Global New Product Database, 2022 | |||||||
Product examples
Corn Tortillas

Source: Mintel, 2022
| Company | Productos Santo Apetito |
|---|---|
| Brand | Santo Apetito |
| Sub-category | Bakery, bread products |
| Country | Manufactured in Mexico, not imported |
| Related ingredients / claims | Corn flour, calcium hydroxide |
| Store name / type | OXXO, convenience store |
| Store location | León, Guanajuato 37270 |
| Launch type | New product |
| Date published | October 2022 |
| Price in US dollars | 1.22 |
This product free from health warnings according to the Secretariat of Health of Mexico and retails in an 800 gram pack.
White Bread with Butter

Source: Mintel, 2022
| Company | Nyati Mexico |
|---|---|
| Brand | Yema & Co |
| Sub-category | Bakery, bread and bread products |
| Country | Manufactured in Mexico, not imported |
| Related ingredients / claims | No artificial additives / preservatives, low/ no / reduced sodium, no added sugar |
| Store name / type | Yema.mx, internet / mail order |
| Store location | Cuernavaca 62370 |
| Launch type | New product |
| Date published | January 2021 |
| Price in US dollars | 2.82 |
This artisan product has been made with sourdough, contains no added sugar and is said to feature a smooth texture and delicious flavor. It has been made according to an original recipe, is free from artificial additives and is low in sodium. It retails in a 300 gram pack containing 12 units.
Pull Apart Cheese Bread

Source: Mintel, 2022
| Company / brand | Tipiak |
|---|---|
| Distributor / importer | La Boulangerie des Gourmets / Mexideli |
| Sub-category | Bakery, bread products |
| Country | Manufactured France, market Mexico |
| Store name / type | Costco, club store |
| Store location | Mexico City 01180 |
| Launch type | New product |
| Date published | September 2022 |
| Price in US dollars | 15.38 |
Tipiak Pan con Salsa de 3 Quesos (Pull Apart Cheese Bread) retails in a 640 gram pack containing two units. This product is high in saturated fat and sodium according to the Mexican Secretariat of Health. Filled with emmental, mozzarella and brie cheese - 43% cheese sauce.
Small Sweet Bread Filled with Condensed Milk

Source: Mintel, 2022
| Company | Tiendas Tres B |
|---|---|
| Brand | El Molino Blanco de Mateo |
| Sub-category | Bakery / cakes, pastries and sweet goods |
| Country | Manufactured in Mexico, not imported |
| Store name / type | Tiendas 3B, mass merchandise / hypermarket |
| Store location | Mexico City 03020 |
| Launch type | New product |
| Date published | October 2022 |
| Price in US dollars | 0.57 |
This product retails in a 76 gram pack containing two units. Contains excess amounts of calories and sugars, according to the Secretariat of Health of Mexico.
Potato Rolls

Source: Mintel, 2022
| Company | Martin's Famous Pastry Shoppe |
|---|---|
| Brand | Martin's |
| Distributor / importer | RD Amerimex |
| Sub-category | Bakery, bread products |
| Country | Manufactured in the United States, market Mexico |
| Related ingredients / claims | No additives / preservatives, Kosher, low / no / reduced transfat, free from added / artificial colourings |
| Store name / type | La Comer, supermarket |
| Store location | Mexico City 04929 |
| Launch type | New product |
| Date published | December 2020 |
| Price in US dollars | 6.35 |
The enriched product features sugar and sodium excess, is made with unbleached flour and features a buttery taste. Moreover, it is said to be soft, and is free from high fructose corn syrup, artificial dyes, trans fats and GMO. The kosher certified product retails in a 723 gram pack, including 12 sliced units.
Sprouted Wholegrain Flax Thin Bagel Bread

Source: Mintel, 2022
| Company / brand | O'Doughs |
|---|---|
| Importer | Master Agrofoods |
| Sub-category | Bakery, bread products |
| Country | Manufactured in Canada, market Mexico |
| Related ingredients / claims | Low / no / reduced cholesterol / transfat / saturated fat / allergen / sugar; gluten free, wholegrain |
| Store name / type | Chedraui supermarket |
| Store location | Mexico City 04870 |
| Launch type | New product |
| Date published | April 2018 |
| Price in US dollars | 7.78 |
This product is made with sprouted wholegrain flax and is a source of fiber and Omega 3. This bagel provides 100 calories and is low in sugar. It is said to be free from gluten, cholesterol, trans fat and saturated fat. It is suitable for freezing and is made with Salba Chia. It retails in a 300 gram pack.
For more information
The Canadian Trade Commissioner Service:
International Trade Commissioners can provide Canadian industry with on-the-ground expertise regarding market potential, current conditions and local business contacts, and are an excellent point of contact for export advice.
More agri-food market intelligence:
International agri-food market intelligence
Discover global agriculture and food opportunities, the complete library of Global Analysis reports, market trends and forecasts, and information on Canada's free trade agreements.
Agri-food market intelligence service
Canadian agri-food and seafood businesses can take advantage of a customized service of reports and analysis, and join our email subscription service to have the latest reports delivered directly to their inbox.
More on Canada's agriculture and agri-food sectors:
Canada's agriculture sectors
Information on the agriculture industry by sector. Data on international markets. Initiatives to support awareness of the industry in Canada. How the department engages with the industry.
For additional information on upcoming flagship trade shows in Mexico, you can contact:
Ben Berry, Deputy Director
Trade Show Strategy and Delivery
Agriculture and agri-food Canada
ben.berry@agr.gc.ca
Resources
- Euromonitor, 2022. Data statistics (2016-2026)
- Euromonitor | November 2022. Country Report: Baked Goods in Mexico
- Global Trade Tracker, 2022
- Mintel Global New Products Database, 2022
Customized Report Services – Ingredient focus: Products containing cocoa or chocolate chips in selected markets
Global Analysis Report
Prepared by: Erin-Ann Chauvin, Senior Market Analyst
© His Majesty the King in Right of Canada, represented by the Minister of Agriculture and Agri-Food (2023).
Photo credits
All photographs reproduced in this publication are used by permission of the rights holders.
All images, unless otherwise noted, are copyright His Majesty the King in Right of Canada.
To join our distribution list or to suggest additional report topics or markets, please contact:
Agriculture and Agri-Food Canada, Global Analysis1341 Baseline Rd, Tower 5, 3rd floor
Ottawa ON K1A 0C5
Canada
Email: aafc.mas-sam.aac@agr.gc.ca
The Government of Canada has prepared this report based on primary and secondary sources of information. Although every effort has been made to ensure that the information is accurate, Agriculture and Agri-Food Canada (AAFC) assumes no liability for any actions taken based on the information contained herein.
Reproduction or redistribution of this document, in whole or in part, must include acknowledgement of agriculture and agri-food Canada as the owner of the copyright in the document, through a reference citing AAFC, the title of the document and the year. Where the reproduction or redistribution includes data from this document, it must also include an acknowledgement of the specific data source(s), as noted in this document.
Agriculture and Agri-Food Canada provides this document and other report services to agriculture and food industry clients free of charge.