

Note: This report includes forecasting data that is based on baseline historical data.
Executive summary
Confectionery in South Korea is a measurable sector in the global market. South Korea was the eighteenth largest market for confectionery with imports valued at US$587.2 million, (95.1 million kilograms) in 2021. South Korea experienced a CAGR of 2.0% as imports increased from US$542.6 million in 2017.
The South Korean confectionery market is developing alongside changes in consumer preferences and perceptions. Given the anticipated growth potential in the confectionery sector in South Korea, Canadian producers have an opportunity to expand their exports and products within the South Korean confectionery market.
Canada was ranked South Korea's twentieth largest confectionery supplier providing US$4.9 million, (457,215 kilograms) in 2021, representing a moderate increase in CAGR of 4.7% from US$4.1 million registered in 2017.
South Korea was Canada's eighth largest export market for confectionery with values of US$2.1 million in 2021, representing a decline in CAGR of 10.1% from exports valued at US$3.2 million in 2017.
The top three suppliers of confectionery to South Korea were the U.S (US$111.6 million, 11.8 million kilograms ), China (US$82.3 million, 16.1 million kilograms) and Germany (US$73.0 million and 12.1 million kilograms) in 2021.
South Korea experienced a slight decline in CAGR of 2.0% as retail sales decreased from US$1.5 billion in 2017, however, the country is expected to moderately recover with a CAGR of 3.4% in the forecast period as retail sales are expected to increase to US$1.6 billion by 2026.
Sugar confectionery is the largest category in confectionery in South Korea with retail sales valued at US$627.4 million in 2021, representing an increase in CAGR of 0.6% from retail sales of US$611.9 million in 2017.
Global trade overview of confectionery
The global market for confectionery has experienced an increase in CAGR (compound annual growth rate) of 3.8% from US$36.1 billion in 2017 to US$41.9 billion in 2021. The United States (U.S) was the largest global market for confectionery in 2021 with imports valued at US$5.6 billion, (1,521.5 million kilograms), followed by Germany with imports valued at US$3.4 billion (708.0 million kilograms) and the United Kingdom (U.K) with import values of US$3.0 billion (668.8 million kilograms).
South Korea was the eighteenth largest market for confectionery with global imports valued at US$587.2 million, (95.1 million kilograms) in 2021. South Korea experienced a CAGR of 2.0% as imports increased from US$542.6 million in 2017, while volume of confectionery product imports declined slightly by a CAGR of 0.1% from 95.6 million kilograms 2017. Canada in comparison, was the sixth largest market for confectionery, accounting for 4.0% of the total world market share in 2021 with values of US$1.6 billion, (380.3 million kilograms), representing an increase in CAGR of 3.2% from imports valued at US$1.4 billion in 2017.
| Country | 2017 | 2018 | 2019 | 2020 | 2021 | CAGR* % 2017-2021 | Market share % 2021 |
|---|---|---|---|---|---|---|---|
| Global total | 36,130.0 | 37,856.3 | 38,233.6 | 37,242.3 | 41,857.5 | 3.8 | 100.0 |
| United States | 4,602.4 | 4,715.7 | 4,964.7 | 4,886.9 | 5,619.7 | 5.1 | 13.4 |
| Germany | 3,076.5 | 3,205.4 | 3,199.6 | 3,173.9 | 3,368.7 | 2.3 | 8.0 |
| United Kingdom | 2,593.9 | 2,746.9 | 2,714.6 | 2,853.9 | 3,027.3 | 3.9 | 7.2 |
| France | 2,603.4 | 2,667.6 | 2,589.0 | 2,616.3 | 2,997.2 | 3.6 | 7.2 |
| Netherlands | 1,688.1 | 1,792.1 | 1,741.8 | 1,805.1 | 2,074.7 | 5.3 | 5.0 |
| Canada (6) | 1,446.3 | 1,470.6 | 1,437.5 | 1,415.6 | 1,638.3 | 3.2 | 3.9 |
| Poland | 996.3 | 1,096.9 | 1,098.2 | 1,200.7 | 1,373.5 | 8.4 | 3.3 |
| Belgium | 1,149.8 | 1,287.9 | 1,315.8 | 1,373.7 | 1,371.1 | 4.5 | 3.3 |
| China | 538.2 | 694.3 | 766.0 | 743.2 | 1,042.9 | 18.0 | 2.5 |
| Spain | 786.0 | 831.3 | 791.4 | 735.0 | 876.9 | 2.8 | 2.1 |
| South Korea (18) | 542.6 | 560.1 | 563.2 | 549.1 | 587.2 | 2.0 | 1.4 |
|
Source: Global Trade Tracker, 2022 *CAGR: Compound Annual Growth Rate Note: For the purpose of this report, 'confectionery' is defined by HS code 1704 (sugar confectionery, not containing cocoa, including white chocolate) and 1806 (chocolate and other food preparations containing cocoa). |
|||||||
| Country | 2017 | 2018 | 2019 | 2020 | 2021 | CAGR* % 2017-2021 | Market share % 2021 |
|---|---|---|---|---|---|---|---|
| Global total | 8,636.7 | 8,967.8 | 9,287.5 | 8,978.0 | 9,558.6 | 2.6 | 100.0 |
| United States | 1,296.8 | 1,341.9 | 1,393.4 | 1,386.6 | 1,521.5 | 4.1 | 15.9 |
| Germany | 638.9 | 660.1 | 705.6 | 675.6 | 708.0 | 2.6 | 7.4 |
| United Kingdom | 648.9 | 643.4 | 650.1 | 680.8 | 668.8 | 0.8 | 7.0 |
| France | 546.5 | 565.4 | 570.3 | 567.4 | 663.2 | 5.0 | 6.9 |
| Netherlands | 394.6 | 410.6 | 415.0 | 407.2 | 428.6 | 2.1 | 4.5 |
| Canada (6) | 355.4 | 356.8 | 355.2 | 341.9 | 380.3 | 1.7 | 4.0 |
| Belgium | 282.6 | 334.9 | 368.1 | 344.6 | 332.9 | 4.2 | 3.5 |
| Poland | 246.8 | 272.2 | 277.8 | 297.5 | 328.3 | 7.4 | 3.4 |
| Russia | 170.7 | 193.7 | 205.0 | 195.7 | 225.4 | 7.2 | 2.4 |
| China | 102.1 | 151.4 | 182.9 | 157.0 | 207.2 | 19.4 | 2.2 |
| South Korea (22) | 95.6 | 97.0 | 97.3 | 92.1 | 95.1 | −0.1 | 1.0 |
|
Source: Global Trade Tracker, 2022 *CAGR: Compound Annual Growth Rate |
|||||||
South Korea's confectionery market
South Korea has a diverse supply network for confectionery. The top three suppliers of confectionery to South Korea were the U.S (US$111.6 million, 11.8 million kilograms ), China (US$82.3 million, 16.1 million kilograms) and Germany (US$73.0 million and 12.1 million kilograms) in 2021. Canada was ranked South Korea's twentieth largest supplier of confectionery providing US$4.9 million, (457,215 kilograms) in 2021 representing a moderate increase in CAGR of 4.7% from US$4.1 million registered in 2017. Of note, Turkey experienced the largest increase in CAGR (59.2%) as their confectionery supplies to South Korea grew from US$3.6 million in 2017 to US$22.8 million in 2021. Turkey is a net exporter of confectionery products with exports of US$1.3 billion in 2021. Top confectionery exports were sugar confectionery not containing cocoa and chocolate and other preparations containing cocoa (HS codes 170490 and 180690, Global Trade Tracker, 2022) in 2021. Turkey's exports of sugar and chocolate confectionery has increased steadily between 2009 and 2017 due to recent modernization and technological improvements realized in the sector.Footnote 1
| Country | 2017 | 2018 | 2019 | 2020 | 2021 | CAGR* % 2017-2021 | Market share % 2021 |
|---|---|---|---|---|---|---|---|
| Global total | 542.6 | 560.1 | 563.2 | 549.1 | 587.2 | 2.0 | 100.0 |
| United States | 102.3 | 114.1 | 112.8 | 100.3 | 111.6 | 2.2 | 19.0 |
| China | 85.9 | 81.8 | 79.1 | 68.7 | 82.3 | −1.1 | 14.0 |
| Germany | 61.1 | 65.7 | 78.7 | 83.4 | 73.0 | 4.6 | 12.4 |
| Belgium | 36.6 | 40.0 | 40.3 | 38.7 | 44.2 | 4.9 | 7.5 |
| Italy | 30.7 | 32.5 | 32.6 | 34.1 | 37.9 | 5.4 | 6.4 |
| Malaysia | 33.6 | 34.4 | 33.9 | 31.9 | 32.0 | −1.2 | 5.5 |
| Singapore | 24.5 | 23.9 | 24.8 | 27.4 | 29.3 | 4.6 | 5.0 |
| Turkey | 3.6 | 5.0 | 8.2 | 13.7 | 22.8 | 59.2 | 3.9 |
| France | 21.2 | 20.6 | 18.4 | 15.6 | 18.6 | −3.2 | 3.2 |
| Vietnam | 17.3 | 16.1 | 12.1 | 12.2 | 16.4 | −1.2 | 2.8 |
| Canada (20) | 4.1 | 6.2 | 6.1 | 6.8 | 4.9 | 4.7 | 0.8 |
|
Source: Global Trade Tracker, 2022 *CAGR: Compound Annual Growth Rate |
|||||||
| Country | 2017 | 2018 | 2019 | 2020 | 2021 | CAGR* % 2017-2021 | Market share % 2021 |
|---|---|---|---|---|---|---|---|
| Global total | 95.6 | 97.0 | 97.3 | 92.1 | 95.1 | −0.1 | 100.0 |
| China | 15.7 | 15.0 | 14.9 | 13.5 | 16.1 | 0.5 | 16.9 |
| Germany | 11.1 | 12.1 | 14.4 | 14.9 | 12.1 | 2.2 | 12.7 |
| United States | 14.4 | 14.3 | 14.1 | 11.3 | 11.8 | −4.8 | 12.4 |
| Singapore | 6.4 | 6.5 | 6.9 | 7.6 | 7.6 | 4.3 | 8.0 |
| Belgium | 6.7 | 7.2 | 7.4 | 7.0 | 7.5 | 2.9 | 7.9 |
| Malaysia | 5.8 | 6.0 | 6.1 | 5.5 | 5.7 | −0.7 | 6.0 |
| Turkey | 1.1 | 1.6 | 2.4 | 3.7 | 5.2 | 47.0 | 5.5 |
| Italy | 3.1 | 3.3 | 3.5 | 3.4 | 3.8 | 5.6 | 4.0 |
| Netherlands | 4.2 | 3.9 | 3.8 | 3.1 | 3.8 | −2.4 | 4.0 |
| Vietnam | 2.7 | 2.6 | 1.9 | 2.0 | 2.6 | −1.0 | 2.8 |
| Canada (24) | 0.4 | 0.6 | 0.6 | 0.6 | 0.5 | 1.3 | 0.5 |
|
Source: Global Trade Tracker, 2022 *CAGR: Compound Annual Growth Rate |
|||||||
Top imported confectionery to South Korea were sugar confectionery not containing cocoa (HS code 170490) valued at US$228.1 million, 43.6 million kilograms, followed by chocolate and other cocoa preparations in packings of <= 2 kilograms (HS Code 180690) valued at US$144.3 million, 15.7 million kilograms and chocolate and other cocoa preparations in blocks, slabs or bars weighing > 2 kilograms (HS code 180620) valued at US$104.8 million, 21.9 million kilograms in 2021.
| HS Code | Description | 2017 | 2018 | 2019 | 2020 | 2021 | CAGR* % 2017-2021 |
|---|---|---|---|---|---|---|---|
| Confectionery product total | 542.6 | 560.1 | 563.2 | 549.1 | 587.2 | 2.0 | |
| 170490 | sugar confectionery not containing cocoa, including white chocolate (excluding chewing gum) | 216.3 | 227.3 | 233.1 | 219.8 | 228.1 | 1.3 |
| 180690 | chocolate and other cocoa preparations, in packings of <= 2 kilograms (excluding in blocks, slabs or bars and cocoa powder) | 140.7 | 146.2 | 147.6 | 142.3 | 144.3 | 0.6 |
| 180620 | chocolate and other cocoa preparations, in blocks, slabs or bars weighing > 2 kilograms or in liquid, paste, powder, granular or other bulk form, in packings of a content > 2 kilograms (excluding cocoa powder) | 80.8 | 83.5 | 83.6 | 85.4 | 104.8 | 6.7 |
| 180631 | chocolate and other preparations containing cocoa, in blocks, slabs or bars of <= 2 kilograms, filled | 59.7 | 58.6 | 52.9 | 51.3 | 53.6 | −2.7 |
| 180632 | chocolate and other preparations containing cocoa, in blocks, slabs or bars of <= 2 kilograms (excluding filled) | 38.0 | 36.1 | 37.7 | 43.0 | 48.5 | 6.3 |
| 180610 | cocoa powder, sweetened | 4.8 | 4.8 | 5.9 | 4.8 | 5.4 | 2.8 |
| 170410 | chewing gum, whether or not sugar-coated | 2.3 | 3.6 | 2.3 | 2.6 | 2.5 | 2.5 |
|
Source: Global Trade Tracker, 2022 *CAGR: Compound Annual Growth Rate |
|||||||
| HS Codes | Description | 2017 | 2018 | 2019 | 2020 | 2021 | CAGR* % 2017-2021 |
|---|---|---|---|---|---|---|---|
| Confectionery product total | 95.6 | 97.0 | 97.3 | 92.1 | 95.1 | −0.1 | |
| 170490 | sugar confectionery not containing cocoa, including white chocolate (excluding chewing gum) | 45.3 | 46.5 | 46.0 | 43.0 | 43.6 | −1.0 |
| 180620 | chocolate and other cocoa preparations, in blocks, slabs or bars weighing > 2 kilograms or in liquid, paste, powder, granular or other bulk form, in packings > 2 kilograms (excluding cocoa powder) | 19.5 | 19.9 | 19.8 | 19.1 | 21.9 | 3.0 |
| 180690 | chocolate and cocoa preparations, in packings of <= 2 kilograms (excluding in blocks, slabs or bars and cocoa powder) | 16.4 | 16.5 | 17.6 | 16.5 | 15.7 | −1.0 |
| 180631 | chocolate and other preparations containing cocoa, in blocks, slabs or bars of <= 2 kilograms, filled | 8.0 | 7.6 | 7.1 | 6.7 | 6.5 | −4.9 |
| 180632 | chocolate and other preparations, in blocks, slabs or bars of <= 2 kilograms (excluding filled) | 4.5 | 4.4 | 4.7 | 4.9 | 5.5 | 5.0 |
| 180610 | cocoa powder, sweetened | 1.5 | 1.6 | 1.8 | 1.4 | 1.5 | −0.3 |
| 170410 | chewing gum, whether or not sugar-coated | 0.3 | 0.5 | 0.3 | 0.3 | 0.2 | −8.4 |
|
Source: Global Trade Tracker, 2022 *CAGR: Compound Annual Growth Rate |
|||||||
| HS code | Description | Import value (US$ millions) | Top suppliers and market share % | Canada's share % | ||
|---|---|---|---|---|---|---|
| 1 | 2 | 3 | ||||
| Confectionery product total | 587.2 | United States: 19.0 | China: 14.0 | Germany: 12.4 | 0.8 | |
| 170490 | sugar confectionery not containing cocoa, including white chocolate (excluding chewing gum) | 228.1 | China: 2.9 | Germany: 21.4 | Turkey: 7.7 | 04 |
| 180690 | chocolate and other cocoa preparations, in packings of <= 2 kilograms (excluding in blocks, slabs or bars and cocoa powder) | 144.3 | United States: 41.3 | China: 13.1 | Australia: 5.3 | 1.8 |
|
180620 |
chocolate and other cocoa preparations, in blocks, slabs or bars weighing > 2 kilograms or in liquid, paste, powder, granular or other bulk form, in packings of a content > 2 kilograms (excluding cocoa powder) | 104.8 | Singapore: 21.3 | Belgium: 17.8 | United States: 16.9 | 0.7 |
| 180631 | chocolate and other preparations containing cocoa, in blocks, slabs or bars of <= 2 kilograms, filled | 53.6 | Italy: 43.5 | China: 15.4 | Germany: 12.0 | 0.2 |
| 180632 | chocolate and other preparations containing cocoa, in blocks, slabs or bars of <= 2 kilograms (excluding filled) | 48.5 | Malaysia: 28.6 | United States: 23.3 | Belgium: 10.7 | 1.1 |
| 180610 | cocoa powder, sweetened | 5.4 | Singapore: 27.5 | United States: 27.3 | Taiwan: 20.1 | 0.0 |
| 170410 | chewing gum, whether or not sugar-coated | 2.5 | United States: 40.7 | China: 24.5 | Japan: 12.5 | 1.0 |
|
Source: Global Trade Tracker, 2022 *CAGR: Compound Annual Growth Rate |
||||||
Canada's performance
Canada was ranked the twentieth largest confectionery supplier to South Korea with values of US$4.9 million, 457,215 kilograms in 2021 representing a moderate value increase in CAGR (4.7%) from imports valued at US$4.1 million registered in 2017. Volume of confectionery product imports from Canada also increased in CAGR by 1.3% from 433,963 kilograms in 2017.
South Korea's top confectionery product imports from Canada were chocolate and other cocoa preparations in packings of <= 2 kilograms (HS code 180690) valued at US$2.6 million, 222.4 thousand kilograms, sugar confectionery not containing cocoa, excluding chewing gum (HS code 170490) worth US$0.9 million , 54.0 thousand kilograms and chocolate and other cocoa preparations, in blocks, slabs or bars weighing > 2 kilograms (HS code 180620) valued at US$0.8 million, 134.5 thousand kilograms in 2021. Of note, chocolate and other cocoa preparations, > 2 kilograms (HS code 180620) also experienced the second largest CAGR of 43.7% as imports increased from US$177.2 thousand in 2017.
| HS Code | Description | 2017 | 2018 | 2019 | 2020 | 2021 | CAGR* % 2017-2021 |
|---|---|---|---|---|---|---|---|
| Confectionery product total | 4.1 | 6.2 | 6.1 | 6.8 | 4.9 | 4.7 | |
| 180690 | chocolate and other cocoa preparations, in packings of <= 2 kilograms (excluding in blocks, slabs or bars and cocoa powder) | 1.3 | 3.3 | 3.1 | 2.6 | 2.6 | 18.0 |
| 170490 | sugar confectionery not containing cocoa, including white chocolate (excluding chewing gum) | 0.4 | 0.9 | 0.7 | 0.5 | 0.9 | 19.5 |
| 180620 | chocolate and other cocoa preparations, in blocks, slabs or bars weighing > 2 kilograms or in liquid, paste, powder, granular or other bulk form, in packings of a content > 2 kilograms (excluding cocoa powder) | 0.2 | 0.2 | 0.3 | 1.0 | 0.8 | 43.7 |
| 180632 | chocolate and other preparations containing cocoa, in blocks, slabs or bars of <= 2 kilograms (excluding filled) | 1.8 | 1.5 | 1.6 | 2.3 | 0.5 | −26.6 |
| 180631 | chocolate and other preparations containing cocoa, in blocks, slabs or bars of <= 2 kilograms, filled | 0.2 | 0.2 | 0.4 | 0.2 | 0.1 | −18.8 |
| 170410 | chewing gum, whether or not sugar-coated | 0.1 | 0.1 | 0.1 | 0.1 | 0.0 | −29.3 |
| 180610 | cocoa powder, sweetened | 0.000 | 0.000 | 0.001 | 0.002 | 0.002 | 76.7 |
|
Source: Global Trade Tracker, 2022 *CAGR: Compound Annual Growth Rate |
|||||||
| HS Code | Description | 2017 | 2018 | 2019 | 2020 | 2021 | CAGR* % 2017-2021 |
|---|---|---|---|---|---|---|---|
| Confectionery product total | 434.0 | 604.7 | 627.0 | 637.8 | 457.2 | 1.3 | |
| 180690 | chocolate and other cocoa preparations, in packings of <= 2 kilograms (excluding in blocks, slabs or bars and cocoa powder) | 134.8 | 282.4 | 259.4 | 215.9 | 222.4 | 13.3 |
| 180620 | chocolate and other cocoa preparations, in blocks, slabs or bars weighing > 2 kilograms or in liquid, paste, powder, granular or other bulk form, in packings of a content > 2 kilograms (excluding cocoa powder) | 63.9 | 59.6 | 80.7 | 150.5 | 134.5 | 20.4 |
| 170490 | sugar confectionery not containing cocoa, including white chocolate (excluding chewing gum) | 36.5 | 124.8 | 133.3 | 72.7 | 54.0 | 10.3 |
| 180632 | chocolate and other preparations containing cocoa, in blocks, slabs or bars of <= 2 kilograms (excluding filled) | 162.9 | 110.6 | 113.7 | 169.6 | 38.5 | −30.3 |
| 180631 | chocolate and other preparations containing cocoa, in blocks, slabs or bars of <= 2 kilograms, filled | 13.4 | 12.1 | 25.7 | 14.9 | 6.5 | −16.4 |
| 170410 | chewing gum, whether or not sugar-coated | 22.5 | 15.2 | 14.1 | 14.0 | 1.1 | −52.5 |
| 180610 | cocoa powder, sweetened | 0.0 | 0.0 | 0.1 | 0.1 | 0.2 | 47.9 |
|
Source: Global Trade Tracker, 2022 *CAGR: Compound Annual Growth Rate |
|||||||
| Category | 2017 | 2018 | 2019 | 2020 | 2021 | *CAGR % 2017-2021 |
|---|---|---|---|---|---|---|
| South Korea's imports from the World | 542.6 | 560.1 | 563.2 | 549.1 | 587.2 | 2.0 |
| South Korea's imports from Canada | 4.1 | 6.2 | 6.1 | 6.8 | 4.9 | 4.7 |
| Supply gap | 538.5 | 553.9 | 557.1 | 542.3 | 582.3 | 2.0 |
|
Source: Global Trade Tracker, 2022 *CAGR: Compound Annual Growth Rate |
||||||
Canada's confectionery global export market
In 2021, Canada exported US$2.2 billion of confectionery to global markets, representing an increase in CAGR of 3.0% from exports valued at US$1.9 billion in 2017. The U.S was the largest export market for Canadian confectionery (94.9% market share) valued at US$2.1 billion, followed by Mexico (3.1% market share) with values of US$69.1 million and representing the second largest increase in CAGR of 55.1% from US$12.0 million recorded in 2017, and Australia (0.5% market share) valued at US$10.4 million in 2021. Of interest, South Korea was Canada's eighth largest export market for confectionery with values of US$2.1 million in 2021, representing a decline in CAGR of 10.1% from exports valued at US$3.2 million in 2017.
| Country | 2017 | 2018 | 2019 | 2020 | 2021 | CAGR* % 2017-2021 |
|---|---|---|---|---|---|---|
| Global total | 1,984.2 | 1,953.3 | 2,059.3 | 2,042.9 | 2,235.7 | 3.0 |
| United States | 1,933.1 | 1,886.0 | 1,959.9 | 1,939.2 | 2,122.1 | 2.4 |
| Mexico | 12.0 | 22.4 | 52.8 | 63.5 | 69.1 | 55.1 |
| Australia | 4.9 | 7.1 | 9.9 | 9.4 | 10.4 | 20.6 |
| United Kingdom | 2.8 | 3.7 | 4.2 | 4.8 | 5.4 | 17.6 |
| Chile | 1.5 | 1.7 | 2.1 | 2.5 | 5.2 | 36.5 |
| China | 2.2 | 2.4 | 2.3 | 2.6 | 3.8 | 14.8 |
| Japan | 5.0 | 4.7 | 6.2 | 4.2 | 3.0 | −12.0 |
| South Korea (8) | 3.2 | 4.8 | 4.7 | 3.6 | 2.1 | −10.1 |
| Hong Kong | 3.5 | 3.0 | 2.2 | 1.6 | 2.1 | −12.0 |
| Saudi Arabia | 0.2 | 1.1 | 0.6 | 1.1 | 2.0 | 85.7 |
|
Source: Global Trade Tracker, 2022 *CAGR: Compound Annual Growth Rate |
||||||
Global retail sales of confectionery
Global retail sales of confectionery increased at a CAGR of 2.1% from US$175.4 billion in 2017 to US$190.2 billion in 2021 (−1.1% from US$185.7 billion in 2019 to US$183.6 billion in 2020), and are expected to continue to increase at a larger CAGR of 4.5% to US$237.8 billion by 2026. The United States was the largest retail sale market of confectionery with values of US$36.8 billion (19.4% market share), followed by China with values of US$14.2 billion (7.4% market share) and Germany valued at US$12.9 billion (6.8% market share) in 2021.
South Korea was the twenty-seventh largest global retail sales market of confectionery, after South Africa and Austria, with retail values of US$1.4 billion, representing a 0.7% market share in 2021. South Korea experienced a slight decline in CAGR of 2.0% as retail sales decreased from US$1.5 billion in 2017, however, the country is expected to moderately recover with a CAGR of 3.4% in the forecast period as retail sales are expected to increase to US$1.6 billion by 2026. In comparison, Canada was the eleventh largest retail sales market of confectionery, accounting for a 2.0% retail sale market share with values of US$3.8 billion in 2021. Similarly, Canada is also expected to achieve a moderate CAGR of 3.8% in the forecast period as retail sales are anticipated to increase to US$4.6 billion by 2026.
| Country | 2017 | 2021 | CAGR* % 2017-2021 | 2022 | 2026 | CAGR* % 2022-2026 |
|---|---|---|---|---|---|---|
| World | 175,381.9 | 190,242.9 | 2.1 | 199,599.8 | 237,763.3 | 4.5 |
| United States | 34,006.1 | 36,847.7 | 2.0 | 39,063.0 | 44,872.1 | 3.5 |
| China | 14,045.1 | 14,169.5 | 0.2 | 14,641.2 | 16,189.2 | 2.5 |
| Germany | 12,310.6 | 12,941.3 | 1.3 | 13,369.0 | 14,915.0 | 2.8 |
| United Kingdom | 11,648.9 | 12,215.2 | 1.2 | 12,443.6 | 13,647.8 | 2.3 |
| Japan | 11,120.8 | 10,209.1 | −2.1 | 10,386.3 | 11,212.0 | 1.9 |
| Russia | 8,006.8 | 8,446.9 | 1.3 | 8,586.5 | 9,656.3 | 3.0 |
| France | 7,583.0 | 7,710.1 | 0.4 | 7,827.6 | 8,308.9 | 1.5 |
| Brazil | 4,999.9 | 5,009.2 | 0.0 | 5,379.4 | 6,867.0 | 6.3 |
| Mexico | 3,386.2 | 3,894.2 | 3.6 | 4,168.6 | 5,384.6 | 6.6 |
| Italy | 4,082.5 | 3,856.0 | −1.4 | 3,930.5 | 4,131.8 | 1.3 |
| Canada (11) | 3,499.9 | 3,774.1 | 1.9 | 3,928.3 | 4,557.0 | 3.8 |
| South Korea (27) | 1,495.3 | 1,381.0 | −2.0 | 1,420.3 | 1,621.5 | 3.4 |
|
Source: Euromonitor International, 2022 *CAGR: Compound Annual Growth Rate Note: For the purpose of this report, retail sales of confectionery consist of chocolate confectionery, gum and sugar confectionery (Euromonitor International). |
||||||
Retail sales of confectionery in South Korea
Overall, retail sales of confectionery in South Korea decreased at a CAGR of 2.0% as retail sales declined from US$1.5 billion, 108.8 thousand tonnes in 2017 to US$1.4 billion, 102.4 thousand tonnes in 2021. Sugar confectionery was the largest category of confectionery with retail sales valued at US$627.4 million, (representing a 45.4% market share), 61.0 thousand tonnes, followed by chocolate confectionery valued at US$576.8 million (representing a 41.8% market share), 34.9 thousand tonnes and gum, valued at US$176.9 million (representing a 12.8% market share), 6.3 thousand tonnes in 2021.
During the forecast period of 2022 to 2026, confectionery retail sales are expected to improve and increase in value by a CAGR of 3.4% from US$1.4 billion, 103.1 thousand tonnes in 2022 to US$1.6 billion, 108.4 thousand tonnes in 2026. Sugar confectionery will remain the largest category of confectionery with a 46.4% market share as retail sales are expected to attain US$752.1 million, 65.9 thousand tonnes by 2026. Of note, all categories of confectionery are expected to increase in value as CAGR's for chocolate confectionery and gum recover to attain 1.7% and 7.0% respectively, while sugar confectionery continues its positive growth by increasing 3.9% in CAGR in the forecast period.
| Category | 2017 | 2018 | 2019 | 2020 | 2021 | CAGR* % 2017-2021 |
|---|---|---|---|---|---|---|
| Value sales in US$ millions, fixed 2021 exchange rate | ||||||
| Confectionery (total) | 1,495.3 | 1,475.7 | 1,458.9 | 1,374.8 | 1,381.0 | −2.0 |
| Sugar confectionery | 611.9 | 629.9 | 649.7 | 622.0 | 627.4 | 0.6 |
| Chocolate confectionery | 628.0 | 602.5 | 575.8 | 572.5 | 576.8 | −2.1 |
| Gum | 255.3 | 243.3 | 233.4 | 180.3 | 176.9 | −8.8 |
| Volume sales in '000 tonnes | ||||||
| Confectionery (total) | 108.8 | 107.5 | 106.5 | 102.4 | 102.4 | −1.6 |
| Sugar confectionery | 61.0 | 61.5 | 62.6 | 60.8 | 61.0 | 0.0 |
| Chocolate confectionery | 38.6 | 37.3 | 35.5 | 35.1 | 34.9 | −2.5 |
| Gum | 9.2 | 8.7 | 8.3 | 6.4 | 6.3 | −9.0 |
|
Source: Euromonitor International, 2022 *CAGR: Compound Annual Growth Rate |
||||||
| Category | 2022 | 2023 | 2024 | 2025 | 2026 | CAGR* % 2022-2026 |
|---|---|---|---|---|---|---|
| Value sales in US$ millions, fixed 2021 exchange rate | ||||||
| Confectionery (total) | 1,420.3 | 1,492.5 | 1,539.0 | 1,582.1 | 1,621.5 | 3.4 |
| Sugar confectionery | 646.5 | 680.4 | 705.1 | 729.0 | 752.1 | 3.9 |
| Chocolate confectionery | 595.1 | 618.5 | 626.6 | 632.2 | 635.5 | 1.7 |
| Gum | 178.7 | 193.6 | 207.3 | 220.8 | 234.0 | 7.0 |
| Volume sales in '000 tonnes | ||||||
| Confectionery (total) | 103.1 | 106.0 | 107.1 | 107.9 | 108.4 | 1.3 |
| Sugar confectionery | 61.7 | 63.4 | 64.4 | 65.2 | 65.9 | 1.7 |
| Chocolate confectionery | 35.2 | 35.9 | 35.8 | 35.5 | 35.0 | −0.1 |
| Gum | 6.2 | 6.6 | 6.9 | 7.2 | 7.5 | 4.9 |
|
Source: Euromonitor International, 2022 *CAGR: Compound Annual Growth Rate |
||||||
Competitive landscape
Company shares
The top three confectionery companies in South Korea controlled 53.3% of the retail market share while private label companies represented a 1.3% market share in 2021 (−9.1% from a previous market share of 1.9% held in 2017. Lotte Group and Crown Confectionery Co Ltd maintained their prominent positions as top companies with a combined market share presence of 44.7% in 2021, despite their recent declines in CAGR's of 3.1% and 2.7% respectively, while Mars Inc experienced the largest CAGR of 8.1% from a 5.5% market share in 2017 to a 7.5% market share in 2021.
| Company | 2017 | 2018 | 2019 | 2020 | 2021 | CAGR* % 2017-2021 |
|---|---|---|---|---|---|---|
| Total | 100.0 | 100.0 | 100.0 | 100.0 | 100.0 | 0.0 |
| Lotte Group | 35.1 | 35.7 | 34.6 | 31.8 | 30.9 | −3.1 |
| Crown Confectionery Co Ltd | 15.4 | 14.5 | 14.4 | 14.0 | 13.8 | −2.7 |
| Ferrero & related parties | 7.4 | 6.7 | 6.9 | 8.1 | 8.6 | 3.8 |
| Mars Inc | 5.5 | 5.7 | 6.0 | 7.3 | 7.5 | 8.1 |
| Orion Group | 6.7 | 7.4 | 7.1 | 6.2 | 6.7 | 0.0 |
| Haribo GmbH & Co kilograms | 3.8 | 4.1 | 4.2 | 4.5 | 4.6 | 4.9 |
| Hershey Co, The | 5.0 | 4.5 | 4.3 | 4.2 | 4.4 | −3.1 |
| CJ Corp | 2.6 | 2.7 | 2.9 | 3.2 | 3.3 | 6.1 |
| Trolli GmbH | 1.5 | 1.3 | 1.5 | 1.7 | 1.8 | 4.7 |
| Perfetti Van Melle Group | 1.6 | 1.6 | 1.6 | 1.4 | 1.5 | −1.6 |
| Others | 7.6 | 8.0 | 9.1 | 10.2 | 10.3 | 7.9 |
| Private Label | 1.9 | 1.8 | 1.6 | 1.5 | 1.3 | −9.1 |
|
Source: Euromonitor International, 2022 *CAGR: Compound Annual Growth Rate |
||||||
Brand shares
Lotte was the largest confectionery brand in South Korea with retail sales of US$90.0 million in 2021, despite its moderate decrease in CAGR of 6.2% from retail sales of US$116.4 achieved in 2017. Haribo and Ferrero Rocher were the second and third largest brands attaining US$63.6 million and US$62.1 million respectively in 2021, while Ferrero Rocher also experienced the largest increase in CAGR of 10.9% in the historic period as retail sales increased from US$41.0 million in 2017.
Four of the top five confectionery brands in South Korea, Lotte, Ferrero, Kinder and Ghana are owned by Lotte Group and Ferrero & related parties and held a combined market share of 23.4% in 2021. Private label brands that held a 1.3% market share in 2021 also experienced the largest decline in CAGR of 10.8% within the historic period as retail sales decreased from US$28.4 million in 2017 to US$18.0 million in 2021.
| Brand | 2017 | 2018 | 2019 | 2020 | 2021 | CAGR* % 2017-2021 |
|---|---|---|---|---|---|---|
| Total | 1,495.3 | 1,475.7 | 1,458.9 | 1,374.8 | 1,381.0 | −2.0 |
| Lotte (Lotte Group) | 116.4 | 113.6 | 112.5 | 91.4 | 90.0 | −6.2 |
| Haribo (Haribo GmbH & Co kilograms) | 56.8 | 60.6 | 61.2 | 62.4 | 63.6 | 2.9 |
| Ferrero Rocher (Ferrero & related parties) | 41.0 | 41.7 | 53.0 | 58.4 | 62.1 | 10.9 |
| Kinder (Ferrero & related parties) | 70.2 | 57.6 | 47.7 | 53.1 | 56.0 | −5.5 |
| Ghana (Lotte Group) | 66.7 | 72.5 | 66.4 | 55.6 | 51.6 | −6.2 |
| Crunky (Lotte Group) | 40.7 | 38.8 | 39.3 | 42.2 | 46.9 | 3.6 |
| Free Time (Crown Confectionery Co Ltd) | 52.3 | 49.8 | 48.7 | 47.2 | 46.6 | −2.8 |
| My Chew (Crown Confectionery Co Ltd) | 55.9 | 52.3 | 51.0 | 47.4 | 46.2 | −4.7 |
| Petitzel (CJ Corp) | 38.2 | 39.7 | 42.4 | 44.6 | 46.0 | 4.8 |
| Jellycious (Lotte Group) | 29.3 | 30.8 | 31.9 | 33.2 | 4.3 | |
| Others | 237.0 | 218.1 | 226.7 | 223.2 | 225.9 | −1.2 |
| Private label | 28.4 | 26.8 | 23.7 | 20.0 | 18.0 | −10.8 |
|
Source: Euromonitor International, 2022 *CAGR: Compound Annual Growth Rate |
||||||
Market segmentation
Sugar confectionery
Sugar confectionery is the largest category in confectionery in South Korea with retail sales valued at US$627.4 million in 2021, representing an increase in CAGR of 0.6% from retail sales of US$611.9 million in 2017. According to Euromonitor International, the emergence of covid-19 and the continued regulations regarding the wearing of face masks, did serve to decrease retail sales of sugar confectionery in 2020 and further hinder sales in 2021, especially those offerings positioned as mouth refreshments. In the forecast period however, the sugar confectionery category is expected to remain the largest of the confectionery categories attaining a moderate CAGR of 3.9% and retail sales valued at US$752.1 million by 2026.
In value terms, pastilles, gums, jellies and chews were the largest subcategory of sugar confectionery in South Korea with retail sales of US$370.0 million in 2021, increasing in a CAGR of 1.7% from retail sales of US$345.4 million in 2017. Due to the emergence of the pandemic however, the subcategory did experience a slight decline in retail value sales that is expected to recover through the development of new products offered by domestic players in collaboration with various convenience stores. For example, new products presented through Hyper-realism (the way in which a product is packaged and shaped) or the realistic product, presents the product in a unique and fun format, like a hamburger shaped jelly, which is comprised of different flavours distinctive to each element of the burger; the buns, patty and toppings, recently released by the convenience store 7-Eleven.Footnote 2
Other sugar confectionery was the second largest subcategory of sugar confectionery in South Korea with retail sales of US$104.1 million in 2021, representing the largest increase in CAGR of 8.8% from retail sales of 74.4 million in 2017. The remaining sugar confectionery subcategories attained lower retail sales and experienced declines in CAGR's ranging from 2.0% to 9.1% in the historic period, however, all subcategories of sugar confectionery are expected to achieve higher retail sales with positive CAGR's in the forecast period with the medicated confectionery subcategory attaining the largest CAGR of 7.6% as retail sale values increase to US$58.4 million by 2026. Mints (standard mints) are also expected to achieve a moderate increase in CAGR of 6.9% as retail sale values grow to US$33.6 million by 2026. Medicated confectionery and standard mints are expected to experience a growth in demand in the forecast period particularly as regulations regarding mask wearing are gradually reduced. Further, a consumer preference for mints over gum as a mouth freshener is anticipated due to growing concerns related to the negative impact of repetitively chewing gum on the jawline.Footnote 2
| Category | 2017 | 2018 | 2019 | 2020 | 2021 | CAGR* % 2017-2021 |
|---|---|---|---|---|---|---|
| Sugar Confectionery | 611.9 | 629.9 | 649.7 | 622.0 | 627.4 | 0.6 |
| Pastilles, Gums, Jellies and Chews | 345.4 | 357.5 | 367.5 | 362.8 | 370.0 | 1.7 |
| Other Sugar Confectionery[1] | 74.4 | 85.7 | 95.2 | 100.6 | 104.1 | 8.8 |
| Medicated Confectionery[2] | 51.6 | 52.6 | 53.5 | 45.1 | 43.4 | −4.2 |
| Boiled Sweets[3] | 57.1 | 53.4 | 48.8 | 40.9 | 39.0 | −9.1 |
| Lollipops | 40.0 | 40.2 | 40.5 | 33.5 | 32.8 | −4.8 |
| Mints | 27.6 | 24.8 | 28.9 | 26.0 | 25.5 | −2.0 |
| Standard Mints | 27.6 | 24.8 | 28.9 | 26.0 | 25.5 | −2.0 |
| Toffees, Caramels and Nougat | 15.8 | 15.6 | 15.3 | 13.3 | 12.6 | −5.5 |
|
Source: Euromonitor International, 2022 *CAGR: Compound Annual Growth Rate 1: Other sugar confectionery - any sugar confectionery product not included above, eg marshmallow or sweet liquid concentrates sold as candies, etc. 2: Medicated confectionery - any sugar confectionery product (not limited to sweets made from boiled sugar) containing herbs and/or plants extracts. Medicated mints fall into this subsector. 3: Boiled sweets - any flavoured candies made from boiled sugar and resulting in hard or soft drops; mints and lollipops are excluded |
||||||
| Category | 2022 | 2023 | 2024 | 2025 | 2026 | CAGR* % 2022-2026 |
|---|---|---|---|---|---|---|
| Sugar Confectionery | 646.5 | 680.4 | 705.1 | 729.0 | 752.1 | 3.9 |
| Pastilles, Gums, Jellies and Chews | 385.0 | 403.2 | 417.5 | 430.9 | 443.5 | 3.6 |
| Other Sugar Confectionery | 107.8 | 110.9 | 114.5 | 118.4 | 122.8 | 3.3 |
| Medicated Confectionery | 43.5 | 48.0 | 51.7 | 55.2 | 58.4 | 7.6 |
| Boiled Sweets | 39.1 | 41.0 | 40.9 | 40.9 | 40.9 | 1.1 |
| Lollipops | 32.9 | 35.6 | 37.0 | 38.2 | 39.5 | 4.7 |
| Mints | 25.7 | 28.4 | 30.4 | 32.1 | 33.6 | 6.9 |
| Standard Mints | 25.7 | 28.4 | 30.4 | 32.1 | 33.6 | 6.9 |
| Toffees, Caramels and Nougat | 12.5 | 13.2 | 13.2 | 13.3 | 13.3 | 1.6 |
|
Source: Euromonitor International, 2022 *CAGR: Compound Annual Growth Rate |
||||||
South Korea's top five sugar confectionery companies represented a 66.4% market share in 2021 with Lotte Group occupying the largest market share of 22.3% in 2021, despite a recent decline in CAGR of 4.1% as the company's market share decreased from 26.4% in 2017.
| Company | 2017 | 2018 | 2019 | 2020 | 2021 | CAGR* % 2017-2021 |
|---|---|---|---|---|---|---|
| Total | 100.0 | 100.0 | 100.0 | 100.0 | 100.0 | 0.0 |
| Lotte Group | 26.4 | 26.9 | 25.2 | 23.5 | 22.3 | −4.1 |
| Crown Confectionery Co Ltd | 19.8 | 17.9 | 17.3 | 16.7 | 16.4 | −4.6 |
| Orion Group | 9.6 | 10.7 | 10.1 | 9.2 | 10.3 | 1.8 |
| Haribo GmbH & Co kilograms | 9.3 | 9.6 | 9.4 | 10.0 | 10.1 | 2.1 |
| CJ Corp | 6.2 | 6.3 | 6.5 | 7.2 | 7.3 | 4.2 |
| Others | 7.8 | 9.2 | 11.6 | 14.2 | 14.4 | 16.6 |
| Private Label | 2.5 | 2.1 | 1.9 | 1.8 | 1.7 | −9.2 |
|
Source: Euromonitor International, 2022 *CAGR: Compound Annual Growth Rate |
||||||
Chocolate confectionery
Euromonitor International notes that the emergence of the pandemic changed traditional chocolate consumption patterns in South Korea. The sales season for chocolate confectionery was primarily focused on the winter season and Valentine's Day, while sales tended to contract during the summer season because of the warmer temperatures. Since the pandemic however, chocolate consumption did increase during summer 2021 as consumers craved sweet chocolates to help overcome feelings of depression and/or helplessness related to prolonged restrictions and lockdown.Footnote 3 In addition, a certain level of seasonal sales were maintained due to e-commerce. For example, young consumers continued to use exchange coupons or order delivery services through 'Kakaotalk Gift', a gift-giving function in mobile messenger. Through this service, consumers were able to send chocolates to celebrate Valentine's Day, and this shift to mobile commerce likely helped seasonal chocolate sustain a positive current value trajectory in 2021.Footnote 3 Further, e-commerce is expected to maintain continued growth in the forecast period through messenger-based commerce platforms like 'Kakaotalk Gift', as this platform has received a positive reception in South Korea, especially amongst the younger generation.
Chocolate confectionery was the second largest category of confectionery in South Korea with retail sales of US$576.8 million in 2021, representing a decrease of 2.1% in CAGR from retail sales of US$628.0 million in 2017. The chocolate confectionery category is expected to recover and attain a CAGR of 1.7% as retail sales increase to US$635.5 million by 2026. Chocolate confectionery is expected to continue in growth due to the release of various products, such as protein-fortified chocolate balls, by both large and small manufacturers.Footnote 3 Orion Corp for example, a leading manufacturer in protein/energy bars, recently extended its protein-enriched line-up to include chocolate balls to capture those consumers seeking healthy and guilt-free options and improved taste.
Chocolate pouches and bags, boxed assortments and seasonal chocolate subcategories experienced relative positive growth in the historic period while all subcategories of chocolate confectionery are expected to increase marginally in CAGR's ranging from 0.2% to 3.8%, with the exception of the chocolate with toys subcategory, which is anticipated to decline at a lower CAGR of 0.4% (−8.4% in the historic period) in the forecast period.
In value terms, chocolate pouches and bags were the largest subcategory of chocolate confectionery during both periods, with retail sales of US$183.9 million in 2021, increasing in CAGR of 2.6% from retail sales of US$166.2 million in 2017, and are expected to increase in CAGR by 0.2% to achieve US$194.0 million by 2026. Countlines were the second largest subcategory in chocolate confectionery during both periods, with retail sales of US$135.9 million in 2021, despite a decline in CAGR of 4.5% from retail sales of US$163.6 million in 2017. Countlines and tablets, typically positioned for on-the-go consumption, did experience declines in CAGR's of 4.5% and 5.3% respectively in the historic period, specifically during 2020-21 as the general consumption pattern shifted to the home realm during the pandemic, whereas previously, these products were purchased on impulse for consumption, at convenience stores.Footnote 3 Both countlines and tablets are expected to recover and increase in CAGR by 3.8% and 1.9% respectively by 2026, as the impacts of the pandemic are expected to eventually subside.
| Category | 2017 | 2018 | 2019 | 2020 | 2021 | CAGR* % 2017-2021 |
|---|---|---|---|---|---|---|
| Chocolate Confectionery | 628.0 | 602.5 | 575.8 | 572.5 | 576.8 | −2.1 |
| Chocolate Pouches and Bags | 166.2 | 163.5 | 155.7 | 175.6 | 183.9 | 2.6 |
| Countlines[1] | 163.6 | 160.3 | 151.5 | 140.1 | 135.9 | −4.5 |
| Tablets[2] | 151.2 | 147.4 | 140.5 | 123.6 | 121.8 | −5.3 |
| Boxed Assortments | 43.2 | 41.0 | 44.7 | 46.3 | 46.7 | 2.0 |
| Chocolate with Toys | 64.0 | 51.9 | 41.5 | 43.8 | 45.1 | −8.4 |
| Seasonal Chocolate | 36.7 | 35.6 | 39.4 | 40.4 | 40.8 | 2.7 |
| Other Chocolate Confectionery | 3.1 | 2.8 | 2.5 | 2.6 | 2.6 | −4.3 |
|
Source: Euromonitor International, 2022 *CAGR: Compound Annual Growth Rate 1: Countlines - chocolate bars eaten as snacks; many are filled and unsegmented, not pre-cut into smaller pieces/segments. 2: Tablets - moulded and segmented chocolate bars in a wide range of sizes ranging from bite-size to family bars |
||||||
| Category | 2022 | 2023 | 2024 | 2025 | 2026 | CAGR* % 2022-2026 |
|---|---|---|---|---|---|---|
| Chocolate Confectionery | 595.1 | 618.5 | 626.6 | 632.2 | 635.5 | 1.7 |
| Chocolate Pouches and Bags | 192.2 | 197.8 | 198.6 | 197.3 | 194.0 | 0.2 |
| Countlines | 137.0 | 143.5 | 148.8 | 153.9 | 158.9 | 3.8 |
| Tablets | 126.7 | 135.3 | 136.1 | 136.4 | 136.4 | 1.9 |
| Boxed Assortments | 48.1 | 49.9 | 50.1 | 50.4 | 50.9 | 1.4 |
| Chocolate with Toys | 46.3 | 45.4 | 45.4 | 45.4 | 45.6 | −0.4 |
| Seasonal Chocolate | 42.0 | 43.9 | 45.0 | 46.0 | 46.9 | 2.8 |
| Other Chocolate Confectionery | 2.7 | 2.7 | 2.7 | 2.7 | 2.7 | 0.0 |
|
Source: Euromonitor International, 2022 *CAGR: Compound Annual Growth Rate |
||||||
South Korea's top five chocolate confectionery companies dominated the market representing a 84.1% market share in 2021. Lotte Group was the largest company occupying a market share of 26.0% in 2021, despite a recent decline in CAGR of 1.8% as their market share decreased from 28.0% in 2017. Of note, Mars Inc, the third largest chocolate confectionery company with a 16.8% market share in 2021, experienced the largest CAGR of 6.2% in the historic period as their market share increased from 13.2% held in 2017.
| Company | 2017 | 2018 | 2019 | 2020 | 2021 | CAGR* % 2017-2021 |
|---|---|---|---|---|---|---|
| Total | 100.0 | 100.0 | 100.0 | 100.0 | 100.0 | 0.0 |
| Lotte Group | 28.0 | 29.2 | 28.8 | 26.7 | 26.0 | −1.8 |
| Ferrero & related parties | 17.7 | 16.5 | 17.5 | 19.5 | 20.5 | 3.7 |
| Mars Inc | 13.2 | 13.9 | 14.2 | 16.6 | 16.8 | 6.2 |
| Crown Confectionery Co Ltd | 13.0 | 12.6 | 12.7 | 12.4 | 12.1 | −1.8 |
| Hershey Co, The | 9.9 | 9.1 | 8.8 | 8.4 | 8.7 | −3.2 |
| Others | 8.7 | 8.3 | 8.3 | 7.8 | 7.8 | −2.7 |
| Private Label | 1.4 | 1.6 | 1.4 | 1.2 | 1.0 | −8.1 |
|
Source: Euromonitor International, 2022 *CAGR: Compound Annual Growth Rate |
||||||
Gum
The gum industry according to Euromonitor International, has also been effected by the presence of the pandemic due to the discomfort in consumption experienced while wearing a face mask, despite the expectation that wearing a mask would increase sales to relieve bad breath.Footnote 4 Further, the main consumer group, male consumers in their 30s and 40s whose typical consumption occurred in the office, have decreased their gum consumption as more continue to work from home.Footnote 4 The recovery of gum is anticipated in the forecast period as restrictions loosen and more consumers spend less time wearing face masks however, growth will be inhibited due to the consumer's use of substitutes, such as standard mints, to negate the growing concerns of the impact of repetitive gum chewing on the jawline.Footnote 4 To mitigate for such product substitutions, gum manufacturers will continue to use cross-industry collaborations to appeal to younger generations in the forecast period, like Lotte Confectionery, who chose K-pop band BTS to endorse their gum brand, Lotte Xylitol, mid-2021.
Gum is the smallest category in confectionery in South Korea with retail sales of US$176.9 million in 2021, representing a moderate decrease of 8.8% in CAGR from US$255.3 million in 2017. The gum category is expected to recover and attain a significant CAGR of 7.0% as retail sales are anticipated to increase to US$234.0 million in 2026.
Chewing gum is the larger subcategory within gum confectionery with retail sales of US$153.9 million in 2021, representing a notable decrease in CAGR of 8.4% from US$218.5 million in 2017. Bubble gum as a secondary subcategory, experienced a larger decline in CAGR of 11.1% as retail sales decreased from US$36.8 million in 2017 to U$23.0 million in 2021. In the forecast period however, gum, chewing and bubble, are expected to achieve larger retail sale values and experience positive CAGR's of 5.9% and 7.1% respectively.
| Category | 2017 | 2018 | 2019 | 2020 | 2021 | CAGR* % 2017-2021 |
|---|---|---|---|---|---|---|
| Gum | 255.3 | 243.3 | 233.4 | 180.3 | 176.9 | −8.8 |
| Chewing Gum | 218.5 | 208.7 | 201.2 | 156.7 | 153.9 | −8.4 |
| Bubble Gum | 36.8 | 34.6 | 32.2 | 23.6 | 23.0 | −11.1 |
|
Source: Euromonitor International, 2022 *CAGR: Compound Annual Growth Rate |
||||||
| Category | 2022 | 2023 | 2024 | 2025 | 2026 | CAGR* % 2022-2026 |
|---|---|---|---|---|---|---|
| Gum | 178.7 | 193.6 | 207.3 | 220.8 | 234.0 | 7.0 |
| Chewing Gum | 155.6 | 168.2 | 180.4 | 192.7 | 204.8 | 7.1 |
| Bubble Gum | 23.2 | 25.4 | 26.9 | 28.2 | 29.2 | 5.9 |
|
Source: Euromonitor International, 2022 *CAGR: Compound Annual Growth Rate |
||||||
South Korea's top gum confectionery company, Lotte Group, held a 77.7% market share followed by Crown Confectionery Co Ltd with an 9.9% market share in 2021. Of note, Lotte Group was the only company to achieve a positive increase in CAGR of 1.5% as their market share increased from 73.2% in 2017. Private label gum confectionery companies experienced the largest decline in CAGR of 12.4% as their market share declined from 1.7% held in 2017 to 1.0% in 2021.
Lotte Group, as a gum confectionery company, has been successful in maintaining their market share through product innovation and new marketing approaches. In particular, the company launched Mouthwater gum, an offering that prevents dry mouth by helping with the production of saliva, and have also repackaged another of their products, their refreshing gum brand Flavono,Footnote 4 into a container in order to help strengthen consumer interest.
| Company | 2017 | 2018 | 2019 | 2020 | 2021 | CAGR* % 2017-2021 |
|---|---|---|---|---|---|---|
| Total | 100.0 | 100.0 | 100.0 | 100.0 | 100.0 | 0.0 |
| Lotte Group | 73.2 | 74.7 | 75.1 | 77.0 | 77.7 | 1.5 |
| Crown Confectionery Co Ltd | 10.8 | 10.1 | 10.4 | 10.1 | 9.9 | −2.2 |
| Orion Group | 9.8 | 9.4 | 9.0 | 7.5 | 7.4 | −6.8 |
| Others | 4.5 | 4.3 | 4.0 | 4.1 | 4.0 | −2.9 |
| Private Label | 1.7 | 1.5 | 1.4 | 1.3 | 1.0 | −12.4 |
|
Source: Euromonitor International, 2022 *CAGR: Compound Annual Growth Rate |
||||||
Retail distribution channels; confectionery product sector (off-trade)
The majority of South Korea's confectionery market is distributed through store-based retailing versus non-store retailing during the historic period, specifically 93.5% (store-based) and 6.5% (non-store retailing) in 2021. Grocery retailers distribute most of the confectionery in South Korea representing a market share of 87.3% while the remainder of confectionery is distributed through non-grocery specialists, 1.2%, mixed retailers, 4.9% sand non-store retailing, 6.5% (specifically e-commerce, 6.2% in 2021).
Modern grocery retailers as a sub-outlet type of grocery retailers, represent the largest distribution channel for confectionery representing a 75.6% market share versus traditional grocery retailers that held a 11.7% market share in 2021. Of those modern grocery retailers, hypermarkets represented the largest (37.3% market share) for confectionery, followed by convenience stores (21.9% market share) and supermarkets (15.5% market share) in 2021.
Independent small grocers, as a sub-outlet of traditional grocery retailers, attained the largest market share of 8.7% in 2021 and also declined in CAGR by 1.9% from a market share of 9.4% held in 2017. Of note, non-grocery specialists attained the largest CAGR of 41.4% as their market share increased from 0.3% in 2017 to 1.2% in 2021, with health and beauty specialist retailers attaining the larger market share of 0.8% in comparison to a 0.5% market share held by other foods non-grocery specialists also in 2021. Within the non-store retailing market share of 6.5%, e-commerce as a sub-outlet, experienced the third largest increase in CAGR (25.5%) in the historic period as e-commerce grew from a market share of 2.5% held in 2017 to 6.2% in 2021.
| Outlet Type | 2017 | 2018 | 2019 | 2020 | 2021 | CAGR* % 2017-2021 |
|---|---|---|---|---|---|---|
| Total store-based and non-store based retailing | 100.0 | 100.0 | 100.0 | 100.0 | 100.0 | 0.0 |
| Store-Based Retailing | 97.1 | 96.4 | 95.6 | 94.2 | 93.5 | −0.9 |
| Grocery Retailers | 93.2 | 92.2 | 91.0 | 88.7 | 87.3 | −1.6 |
| Modern Grocery Retailers | 80.7 | 79.9 | 79.0 | 77.2 | 75.6 | −1.6 |
| Convenience Stores | 18.7 | 19.4 | 20.7 | 21.8 | 21.9 | 4.0 |
| Discounters | 0.5 | 0.8 | 0.7 | 0.8 | 0.7 | 8.8 |
| Forecourt Retailers | 0.1 | 0.1 | 0.1 | 0.1 | 0.1 | 0.0 |
| Hypermarkets | 43.6 | 42.1 | 40.2 | 38.3 | 37.3 | −3.8 |
| Supermarkets | 17.9 | 17.5 | 17.2 | 16.2 | 15.5 | −3.5 |
| Traditional Grocery Retailers | 12.4 | 12.3 | 12.0 | 11.5 | 11.7 | −1.4 |
| Food/drink/tobacco specialists | 2.2 | 2.3 | 2.2 | 2.1 | 2.1 | −1.2 |
| Independent Small Grocers | 9.4 | 9.3 | 9.1 | 8.6 | 8.7 | −1.9 |
| Other Grocery Retailers | 0.8 | 0.8 | 0.7 | 0.8 | 1.0 | 5.7 |
| Non-Grocery Specialists | 0.3 | 0.4 | 0.6 | 0.7 | 1.2 | 41.4 |
| Health and Beauty Specialist Retailers | 0.3 | 0.4 | 0.6 | 0.7 | 0.8 | 27.8 |
| Other Foods Non-Grocery Specialists | 0.0 | 0.0 | 0.5 | N/C | ||
| Mixed Retailers | 3.6 | 3.8 | 4.0 | 4.8 | 4.9 | 8.0 |
| Non-Store Retailing | 2.9 | 3.6 | 4.4 | 5.8 | 6.5 | 22.4 |
| Vending | 0.4 | 0.4 | 0.4 | 0.2 | 0.3 | −6.9 |
| E-Commerce | 2.5 | 3.3 | 4.0 | 5.6 | 6.2 | 25.5 |
|
Source: Euromonitor International, 2022 *CAGR: Compound Annual Growth Rate N/C: not calculable |
||||||
Product trend analysis
Sugar and gum confectionery in South Korea
According to Mintel, the covid-19 pandemic has encouraged more Asian consumers to adopt healthier lifestyles and diets. Although indulgent foods like sweets remain a popular treat, consumers are increasingly looking for tasty offerings which also pack a nutrient-rich boost. As a result, launch activity in Asia has seen brands striving to deliver indulgence alongside a healthier and nutritional boost in attempts to satisfy consumers' needs. For example, more sugar and gum confectionery products are being fortified with vitamins and minerals prevalent in pastilles, gums, jellies and chews.Footnote 5
Functional claims also rose reaching 11% in 2020/21 and remained predominant in medicated confectionery commonly enriched with herbal extracts, menthol or vitamins and minerals to deliver additional health benefits.Footnote 5
Post-covid, consumers' desire for food with a functional purpose continues to be strong however, the pandemic has also hastened the move towards low/no sugar in a range of products.Footnote 6 In particular, in the mint sector, sugar-free varieties accounted for 86% of total product launches in 2021, while sucralose and aspartame were the most common sweeteners used in standard and power mints.
Mintel also notes that gum confectionery launch activity remained modest in Asia, accounting for only 6% of total launches in the sugar and gum confectionery category in 2021. As such, brands have been adopting various innovation strategies such as supplementing sugar-free and breath-freshening claims with novel flavours, formats and functions, to maintain consumer engagement.
Chocolate confectionery in South Korea
According to Mintel, as Asia's chocolate market matures, and consumer tastes become more sophisticated, more brands are focusing on innovation, particularly in flavours, textures, and colours to encourage consumption. In addition, products that stimulate the senses are also likely to drive interest and keep consumers engaged.Footnote 7
In terms of product launches of chocolate confectionery in the APAC region, from February 2020 to January 2021; crunchy was the most common texture (31% of chocolate countlines launched) , while launches with a smooth texture (23% of chocolate tablet launches) were increasing in profile.
Premium chocolate products made with high-quality ingredients are also in demand among Asian consumers with launches in the APAC region, specifically in South Korea and Sri Lanka, seeing a slight increase also from February 2020 to January 2021.Footnote 7
Product launch analysis
According to Mintel's Global New Products Database (GNPD), there were 1,130 new confectionery products launched in South Korea between January 2017 and December 2021. The number of yearly product launches has declined in growth by a CAGR of 5.6% from 256 confectionery products in 2017 to the most recent launch of 203 confectionery products in 2021. Of note, the largest number of new confectionery products released (264) occurred in 2018, then declined in CAGR by 31.8% to 180 new confectionery products launched in 2019, increasing to 227 new products in 2020 representing a rise in CAGR of 26.1%.
Pastilles, gums, jellies & chews, non-individually, and individually wrapped chocolate pieces were the top sub-categories of newly released confectionery product launches while vitamin/mineral fortified, premium and sugar free, were top claims associated with new confectionery products released during the prescribed period.
Flexible, flexible stand-up pouch and cartons were the leading package types released while new product, new variety/range extension and new packaging were the main launch types of new confectionery products released between January 2017 and December 2021 .
Unflavoured/plain, strawberry and grape were top flavours (including blends), while white sugar, food acids and glucose syrup were top ingredients identified during this period.
| Product attributes | Yearly launch counts | |||||
|---|---|---|---|---|---|---|
| 2017 | 2018 | 2019 | 2020 | 2021 | Total | |
| Yearly product launches | 256 | 264 | 180 | 227 | 203 | 1,130 |
| Top five sub-categories | ||||||
| Pastilles, gums, jellies and chews | 82 | 82 | 67 | 50 | 63 | 344 |
| Non-individually wrapped chocolate pieces | 44 | 36 | 37 | 51 | 30 | 198 |
| Individually wrapped chocolate pieces | 26 | 37 | 22 | 24 | 26 | 135 |
| Chocolate tablets | 18 | 39 | 22 | 36 | 19 | 134 |
| Gum | 25 | 14 | 15 | 13 | 16 | 83 |
| Top five claims | ||||||
| Vitamin/mineral fortified | 15 | 11 | 24 | 22 | 18 | 90 |
| Premium | 19 | 6 | 11 | 23 | 22 | 81 |
| Sugar free | 20 | 16 | 17 | 16 | 11 | 80 |
| Children (5-12) | 29 | 22 | 9 | 5 | 4 | 69 |
| Social media | 18 | 17 | 15 | 4 | 8 | 62 |
| Imported Status | ||||||
| Not imported | 4 | 1 | 2 | 2 | 4 | 13 |
| Imported | 49 | 45 | 29 | 37 | 36 | 196 |
| Top packaged types | ||||||
| Flexible | 111 | 136 | 96 | 114 | 118 | 575 |
| Flexible stand-up pouch | 55 | 48 | 31 | 32 | 40 | 206 |
| Carton | 22 | 23 | 13 | 31 | 13 | 102 |
| Flexible sachet | 16 | 29 | 28 | 13 | 10 | 96 |
| Jar | 9 | 8 | 4 | 3 | 11 | 35 |
| Top launch types | ||||||
| New product | 138 | 146 | 105 | 131 | 92 | 612 |
| New variety/range extension | 91 | 89 | 57 | 74 | 77 | 388 |
| New packaging | 24 | 22 | 12 | 19 | 28 | 105 |
| Relaunch | 3 | 7 | 4 | 2 | 6 | 22 |
| New formulation | 0 | 0 | 2 | 1 | 0 | 3 |
| Top five flavours (including blend) | ||||||
| Unflavoured/plain | 35 | 39 | 29 | 49 | 25 | 177 |
| Strawberry | 11 | 19 | 11 | 4 | 8 | 53 |
| Grape | 6 | 15 | 6 | 4 | 8 | 39 |
| Peach | 7 | 9 | 6 | 7 | 3 | 32 |
| Lemon | 12 | 10 | 1 | 2 | 7 | 32 |
| Top five ingredients | ||||||
| White sugar | 211 | 224 | 131 | 185 | 154 | 905 |
| Food acids | 125 | 134 | 84 | 84 | 83 | 510 |
| Glucose syrop | 108 | 125 | 79 | 101 | 91 | 504 |
| Cocoa fat | 83 | 100 | 66 | 98 | 71 | 418 |
| Artificial flavouring substance | 102 | 85 | 59 | 76 | 91 | 413 |
| Top five companies | ||||||
| Lotte confectionery | 39 | 29 | 22 | 32 | 39 | 161 |
| Emart | 28 | 14 | 19 | 10 | 3 | 74 |
| Orion confectionery | 8 | 15 | 8 | 15 | 15 | 61 |
| Haitai confectionery and foods | 15 | 9 | 5 | 4 | 5 | 38 |
| Crown confectionery | 10 | 5 | 8 | 6 | 7 | 36 |
| Source: Mintel; Global New Product Database, 2022 | ||||||
Examples of new products
Roastable Garlic Bread Flavoured Chocolate
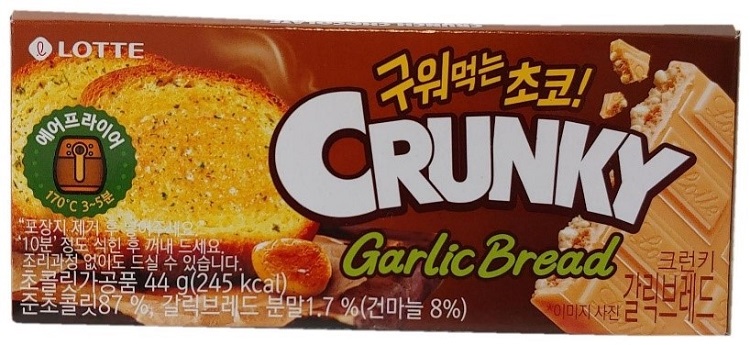
Source: Mintel, 2022
| Company | Lotte Confectionery |
|---|---|
| Brand | Lotte Crunky |
| Category | Chocolate confectionery |
| Sub-category | Chocolate Tablets |
| Market | South Korea |
| Store type | Convenience store |
| Date published | October 2021 |
| Launch type | New variety / range extension |
| Price in US dollars | 1.27 |
Lotte Crunky Roastable Garlic Bread Flavoured Chocolate is made with 87% quasi-milk chocolate and 1.7% garlic bread powder. This product can be consumed just as it is or prepared in an air-fryer for three to five minutes, and retails in a 44 gram pack.
Jelly Block
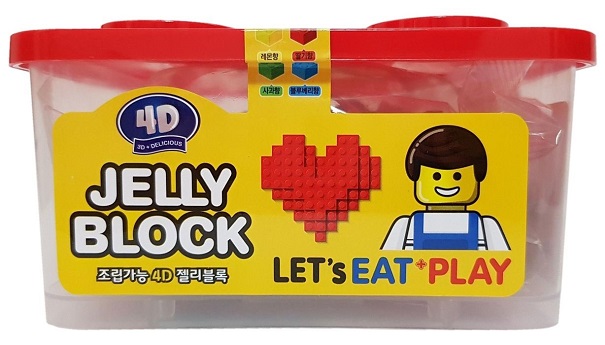
Source: Mintel, 2022
| Company | Amos Sweets |
|---|---|
| Brand | 4D |
| Category | Sugar and gum confectionery |
| Sub-category | Pastilles, gums, jellies and chews |
| Market | South Korea |
| Store type | Supermarket |
| Date published | August 2020 |
| Launch type | New product |
| Price in US dollars | 5.70 |
4D Jelly Block has been added to the range. This product can be assembled to make various shapes and provides four flavours: lemon; strawberry; apple; and blueberry. It retails in a 500 gram pack.
Zero Sugar 50% High Cacao Chocolate
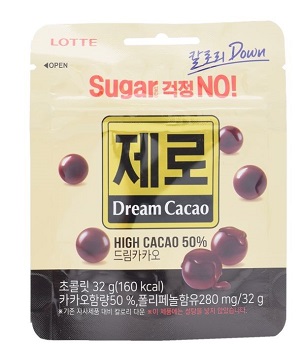
Source: Mintel, 2022
| Company | Lotte Confectionery |
|---|---|
| Brand | Lotte Dream Cacao |
| Category | Chocolate confectionery |
| Sub-category | Non-individually wrapped chocolate pieces |
| Market | South Korea |
| Store type | Convenience store |
| Date published | May 2019 |
| Launch type | New variety / range extension |
| Price in US dollars | 1.32 |
Lotte Dream Cacao Zero Sugar 50% High Cacao Chocolate has been added to the range. The sugar-free product features reduced calorie, contains 50% cacao and 280 milligrams polyphenol and retails in a 32 gram pack.
Fresh Mint Flavoured Chewing Gum
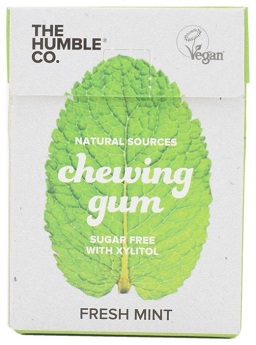
Source: Mintel, 2022
| Company | The Humble Co. |
|---|---|
| Brand | The Humble Co. |
| Category | Sugar and gum confectionery |
| Sub-category | Gum |
| Market | South Korea |
| Store type | Internet / mail order |
| Date published | October 2018 |
| Launch type | New product |
| Price in US dollars | 3.45 |
The Humble Co. Fresh Mint Flavoured Chewing Gum is made from naturally sourced ingredients. This vegan and diabetic-friendly product is made from tree, is sugar free with xylitol, has been developed by dentists, and is claimed to be eco-friendly and socially responsible. It is said to be naturally good for the teeth and breath, and retails in a 19 gram pack containing 12 pieces. The manufacturer claims to donate to The Humble Smile Foundation, which delivers professional and sustainable healthcare projects where they are most needed around the world.
Green Tea Chocolate
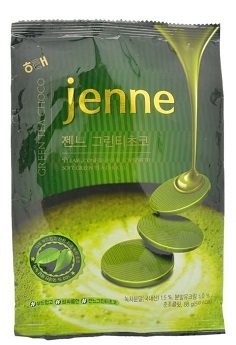
Source: Mintel, 2022
| Company | Haitai Confectionery & Foods |
|---|---|
| Brand | Haitai Jenne |
| Category | Chocolate confectionery |
| Sub-category | Individually wrapped chocolate pieces |
| Market | South Korea |
| Store type | Supermarket |
| Date published | May 2017 |
| Launch type | New product |
| Price in US dollars | 2.82 |
Haitai Jenne Green Tea Chocolate is made with real chocolate and 100% Korean green tea from Haenam. This slim chocolate has a 2.8 millimetre thickness and is said to melt in mouth softly. The on-the-go product retails in an 88 gram pack.
Opportunities for Canada
Confectionery in South Korea is a measurable sector in the global market. South Korea was the eighteenth largest global market for confectionery with imports valued at US$587.2 million, (95.1 million kilograms) in 2021. South Korea experienced a CAGR of 2.0% as imports increased from US$542.6 million in 2017.
Canada was ranked South Korea's twentieth largest supplier of confectionery providing US$4.9 million, (457,215 kilograms) in 2021 representing a moderate increase in CAGR of 4.7% from US$4.1 million registered in 2017.
In terms of retail confectionery sales, South Korea was the twenty-seventh largest global retail sales market with retail values of US$1.4 billion, representing a 0.7% market share in 2021. South Korea experienced a slight decline in CAGR of 2.0% as retail sales decreased from US$1.5 billion in 2017, however, the country is expected to moderately recover with a CAGR of 3.4% in the forecast period as retail sales are expected to increase to US$1.6 billion by 2026.
Sugar confectionery is the largest category in confectionery in South Korea with retail sales valued at US$627.4 million in 2021, representing an increase in CAGR of 0.6% from retail sales of US$611.9 million in 2017. Chocolate confectionery was the second largest category of confectionery in South Korea with retail sales of US$576.8 million in 2021, representing a decrease of 2.1% in CAGR from retail sales of US$628.0 million in 2017. The chocolate confectionery category is expected to recover and attain a CAGR of 1.7% as retail sales increase to US$635.5 million by 2026.
The South Korean confectionery market is developing alongside changes in consumer preferences and perceptions. Given the anticipated growth potential in the confectionery sector in South Korea, Canadian producers have an opportunity to expand their exports and products within the South Korean confectionery market. That said, it is important for Canadian suppliers to work closely with their importing partners and trade commissioners to ensure that South Korea's import requirements for their specific products are met.
The Canada-South Korea Free Trade Agreement (CKFTA) provides Canadian exporters preferential tariff treatment in the form of reduced tariffs, and access to one of the world's largest economies. The tariff treatment of a good exported to Korea depends on its specific tariff classification as determined by the Korea Customs Service. To benefit from tariff preferences in Korea, Canadian exporters must ensure goods meet applicable rules of origin. The importer must have a valid certificate of origin in her or his possession at the time of importation.
Canadian exporters may consult the Canada Tariff Finder to explore tariff information for the Korean market under the CKFTA, and other foreign markets with which Canada has a free trade agreement. Tariff preferences for key Canadianprocessed food products exported to Korea:
Tariffs preferences for key Canadian processed food products exported to Korea were eliminated in 2019 for:
- Sweet biscuits
- Sugar confectionary:
- Hard candies
- Chocolate and chocolate confectionary
- Chewing gum
For more information
The Canadian Trade Commissioner Service:
International Trade Commissioners can provide Canadian industry with on-the-ground expertise regarding market potential, current conditions and local business contacts, and are an excellent point of contact for export advice.
More agri-food market intelligence:
International agri-food market intelligence
Discover global agriculture and food opportunities, the complete library of Global Analysis reports, market trends and forecasts, and information on Canada's free trade agreements.
Agri-food market intelligence service
Canadian agri-food and seafood businesses can take advantage of a customized service of reports and analysis, and join our email subscription service to have the latest reports delivered directly to their inbox.
More on Canada's agriculture and agri-food sectors:
Canada's agriculture sectors
Information on the agriculture industry by sector. Data on international markets. Initiatives to support awareness of the industry in Canada. How the department engages with the industry.
For additional information on the SFH – Seoul Food & Hotel trade show, please contact:
Ben Berry, Deputy Director
Trade Show Strategy and Delivery
Agriculture and agri-food Canada
ben.berry@agr.gc.ca
Resources
- Euromonitor International, Country Report: Chocolate confectionery in South Korea, July 2021
- Euromonitor International, Country Report: Gum in South Korea, July 2021
- Euromonitor International, Country Report: Sugar confectionery in South Korea, July 2021
- Global Trade Tracker, 2022
- Mintel, A year of innovation in sugar and gum confectionery, 2021
- Mintel, A year of innovation in sugar confectionery, 2022
- Mintel, A year of innovation in chocolate confectionery, 2021
- Mintel Global New Products Database, 2022
- Republic of Turkey - Ministry of Trade; Sugar and chocolate confectionery, page 2, 2019
- Tariff preferences for Canadian exports to Korea, Global Affairs Canada
Sector Trend Analysis – Confectionery in South Korea
Global Analysis Report
Prepared by: Laurie Bernardi, International Market Research Analyst
© Her Majesty the Queen in Right of Canada, represented by the Minister of Agriculture and Agri-Food (2022).
Photo credits
All photographs reproduced in this publication are used by permission of the rights holders.
All images, unless otherwise noted, are copyright Her Majesty the Queen in Right of Canada.
To join our distribution list or to suggest additional report topics or markets, please contact:
Agriculture and Agri-Food Canada, Global Analysis1341 Baseline Rd, Tower 5, 3rd floor
Ottawa ON K1A 0C5
Canada
Email: aafc.mas-sam.aac@agr.gc.ca
The Government of Canada has prepared this report based on primary and secondary sources of information. Although every effort has been made to ensure that the information is accurate, Agriculture and Agri-Food Canada (AAFC) assumes no liability for any actions taken based on the information contained herein.
Reproduction or redistribution of this document, in whole or in part, must include acknowledgement of agriculture and agri-food Canada as the owner of the copyright in the document, through a reference citing AAFC, the title of the document and the year. Where the reproduction or redistribution includes data from this document, it must also include an acknowledgement of the specific data source(s), as noted in this document.
Agriculture and Agri-Food Canada provides this document and other report services to agriculture and food industry clients free of charge.