

Note: This report includes forecasting data that is based on baseline historical data.
Executive summary
South Korea's robust middle class plays a pivotal role in driving economic growth and stability, benefitting from steady incomes and substantial discretionary spending power.
Korea was the nineteenth largest global market for confectionery with import values of US$659.3 million (1.3% market share) in 2023, representing a 3.3% annual increase from imports of US$560.1 million in 2018.
Top imported confectionery products were sugar confectionery with US$299.9 million (45.5% market share) and chocolate and other cocoa preparations with US$149.4 million (22.7% market share) in 2023.
Korea was the eighth largest export market for Canadian confectionery with values of US$2.6 million in 2023, representing a decline in annual growth of 11.3% from US$4.8 million in 2018. Canada's primary confectionery (product) exported to Korea was chocolate and other cocoa preparations with values of US$2.6 million (99.9% market share) in 2023.
South Korea was the thirtieth largest global retail sales market for confectionery with retail sales of US$1.3 billion (0.6% market share) in 2023, declining slightly by 0.3% from US$1.3 billion in 2018. In the forecast period, South Korea is expected to grow an additional 3.3% to attain retail sales of US$1.5 billion by 2028.
Sugar confectionery was South Korea's largest category of confectionery with retail sales of US$575.9 million (46.1% market share), followed by chocolate confectionery with values of US$535.0 million (42.8% market share), in 2023.
According to Mintel's Global New Products Database (GNPD), there were 1,200 new confectionery products launched in South Korea from January 2018 to December 2023. Of these 1,200 new products, 611 were chocolate confectionery products and 589 were categorized as sugar and gum confectionery product launches.
The South Korean consumer market
The population of South Korea has experienced a slight decline over recent years, attaining a total population of 51.6 million in 2022, as birth rates and urbanisation remain stagnate. By 2040, South Korea is expected to reach a total population of 50.2 million (South Korea: Consumer Profile, pgs. 9, 10 and 12, May 2023). In the forecast period, between 2022 - 2040, rapid ageing will persist as birth rates continue to decrease and life expectancy increases. The median age of the population will be 54.6 years and life expectancy will increase by two years to 89 years of age for females and 83 years of age for males, by 2040 (South Korea: Consumer Profile, pages 45 and 12, May 2023).
The country's household demographics have evolved as singletons have surpassed couples with children, attributed primarily to population ageing, the increasing number of seniors (without spouses) living alone, postponing marriage to later in life, and the desire to live child-free. In the future, more households are also expected to be led by females pursuing higher education and entering the workforce, resulting in heightened independence and economic empowerment. By 2040, half of South Korean households will be led by individuals aged 60+, with a sizable portion remaining economically active and employed, contributing to substantial income accumulation among households (75.0% of households are projected to surpass an income threshold of US$75,000 by 2040), while the middle class in South Korea will account for 31.8% of total households (South Korea: Consumer Profile, pages 19, 22 and 30, May 2023).
Saving is deeply engrained in the cultural fabric of the country, with a strong focus on financial security (higher savings and less debt) and managing expenses as a means of safeguarding against future economic uncertainties. However, cultural focus on outward appearances, coupled with the desire to maintain a specific social status, increase the consumer's willingness to pay a premium for reputable and well-known brands, as well as personalized and tailored products (South Korea: Consumer Profile, pages 38 and 45, May 2023).
Baby Boomers (born between 1946 and 1964) and Generation X (aged 60 to 75) consumers typically research products and services before choosing and remain devoted to preferred brands; while Generation X in particular, are more likely to embrace premiumization and opt for branded goods. By 2040, Millennials (aged 45 to 60) are anticipated to emerge as a crucial consumer group, collectively representing more than half of all consumers, while Generation X is poised to remain as the most influential consumer segment, on account of its sizable population and rising disposable incomes (South Korea: Consumer Profile, pages 11, 7 and 13, May 2023).
South Korea's robust middle class plays a pivotal role in driving economic growth and stability, benefitting from steady incomes and substantial discretionary spending power. The country's per capita disposable income is anticipated to grow at a faster pace compared to the average of developed countries, surpassing US$25,000, while gross income per capita will reach US$36,699 by 2040. Further, the number of consumers with annual incomes exceeding US$250,000 is expected to increase by 50.0% by 2040, propelled by the country's robust economic growth and strong innovation capacity. (South Korea: Consumer Profile, pages 33, 6 and 31, May 2023).
Seoul is poised to remain South Korea's largest consumer market (representing over half of the country's private spending), due to its large population and highest per capita disposable income, estimated to reach nearly US$40,000 by 2040 (South Korean per capita disposable income is estimated to reach US$26,067 in 2040). Seoul is also anticipated to have nearly half a million affluent households (those with disposable income exceeding US$150,000) by 2040, further contributing to its positioning as an influential consumer market. (South Korea: Consumer Profile, pages 32 and 30, May 2023).
In 2023, South Korea's real GDP growth decelerated to 1.3%, following a 2.6% increase in 2022. A decrease in export demand (particularly semiconductors), ongoing geopolitical issues, and a decline in domestic demand contributed to the economic slowdown. During 2023 to 2028, South Korea's economy is forecast to expand at a CAGR of 2.2% in real terms, as stronger than anticipated global expansion and a reduction in geopolitical tensions could enhance the economic prospects for the export-reliant South Korean economy (Euromonitor International; Economy, Finance and Trade, May 2024). In addition, in January 2022, the Regional Comprehensive Economic Partnership (RCEP) came into force, creating a new trading bloc among the 10 ASEAN (Association of Southeast Asian Nations) countries, Australia, China, Japan, New Zealand and South Korea. The trade deal became effective for South Korea from February 2022 and is expected to foster stronger trading relationships among members by reducing tariffs and simplifying trading rules, as around half of South Korean exports are directed towards RCEP member countries. According to the South Korea Institute for International Economic Policy (KIEP), the reduced tariffs could contribute to a growth effect of 0.4% to 0.6% for the South Korean economy, along with a US$4.2 billion to US$6.8 billion boost to the consumer market (Euromonitor International; Economy, Finance and Trade, May 2024).
Despite recent economic and geopolitical considerations, South Korea maintains a higher level of savings and relatively low inflation managed by government support (Central Bank's recent monetary policy rate restriction to help contain inflation) (Euromonitor International; PEST Analysis: South Korea, October 2023), and various government initiatives such as the energy support and vouchers (issued January 2023), in support of mitigating the inflationary impact on low-income families, enabling them to spend more on discretionary categories throughout the year (South Korea: Consumer Profile, page 28, May 2023).
Global trade overview of confectionery imports
The global market for confectionery has experienced positive value growth with a compound annual growth rate (CAGR) of 5.2% as imports increased from US$39.4 billion, (9.4 billion kilograms) in 2018 to US$50.9 billion, (10.0 billion kilograms) in 2023. The United States (U.S) was the largest global market for confectionery in 2023 with imports valued at US$7.3 billion (14.3% market share), 1.6 billion kilograms, representing a moderate increase in CAGR of 9.1% from US$4.7 billion in 2018, followed by the United Kingdom (U.K) with imports valued at US$4.1 billion (8.1% market share), 772.7 million kilograms, representing an increase in CAGR of 9.5% from US$2.6 billion in 2018 and Germany, with import values of US$4.0 billion (7.9% market share), 736.4 million kilograms, in 2023.
South Korea was the nineteenth largest market for confectionery with import values of US$659.3 million (1.3% market share), 106.7 million kilograms in 2023, representing a 3.3% annual increase from imports of US$560.1 million in 2018. Canada in comparison, was the sixth largest global market for confectionery with import values of US$1.9 billion (3.8% market share), 374.2 million kilograms in 2023, representing a moderate increase in CAGR of 5.6% from imports of US$1.5 billion in 2018.
| Country | 2018 | 2019 | 2020 | 2021 | 2022 | 2023 | CAGR* % 2018-2023 | Market share % in 2023 |
|---|---|---|---|---|---|---|---|---|
| Global total | 39,446.7 | 40,033.6 | 38,425.4 | 43,977.7 | 46,692.4 | 50,908.5 | 5.2 | 100.0 |
| United States | 4,715.7 | 4,964.7 | 4,886.9 | 5,620.8 | 6,806.9 | 7,298.2 | 9.1 | 14.3 |
| United Kingdom | 2,624.7 | 2,614.9 | 2,757.3 | 3,028.9 | 3,433.8 | 4,130.5 | 9.5 | 8.1 |
| Germany | 3,205.4 | 3,199.6 | 3,173.9 | 3,404.1 | 3,288.2 | 4,027.8 | 4.7 | 7.9 |
| France | 2,667.6 | 2,589.6 | 2,617.2 | 3,005.7 | 2,914.9 | 3,355.4 | 4.7 | 6.6 |
| Netherlands | 1,792.1 | 1,741.8 | 1,805.1 | 2,072.1 | 2,103.7 | 2,495.6 | 6.9 | 4.9 |
| Canada (6) | 1,470.6 | 1,437.5 | 1,415.6 | 1,634.4 | 1,800.1 | 1,930.8 | 5.6 | 3.8 |
| Belgium | 1,287.9 | 1,315.2 | 1,378.9 | 1,485.2 | 1,431.0 | 1,744.1 | 6.3 | 3.4 |
| Poland | 1,096.9 | 1,098.2 | 1,200.7 | 1,373.5 | 1,378.4 | 1,572.8 | 7.5 | 3.1 |
| Spain | 831.3 | 791.4 | 735.0 | 876.9 | 897.7 | 1,068.0 | 5.1 | 2.1 |
| Italy | 760.9 | 776.6 | 774.6 | 874.3 | 870.9 | 1,037.0 | 6.4 | 2.0 |
| South Korea (19) | 560.1 | 563.2 | 549.1 | 587.3 | 614.8 | 659.3 | 3.3 | 1.3 |
|
Source: Global Trade Tracker, 2024 1: For the purpose of this report, "confectionery" is defined by HS codes 1704 (sugar confectionery, not containing cocoa, including white chocolate) and 1806 (chocolate and other food preparations containing cocoa). *CAGR: Compound Annual Growth Rate |
||||||||
| Country | 2018 | 2019 | 2020 | 2021 | 2022 | 2023 | CAGR* % 2018-2023 | Market share % in 2023 |
|---|---|---|---|---|---|---|---|---|
| Global total | 9,382.6 | 9,802.9 | 9,317.0 | 10,201.3 | 10,855.0 | 10,038.7 | 1.4 | 100.0 |
| United States | 1,341.9 | 1,393.4 | 1,386.5 | 1,521.3 | 1,678.4 | 1,578.4 | 3.3 | 15.7 |
| United Kingdom | 610.9 | 622.9 | 656.2 | 668.9 | 770.6 | 772.7 | 4.8 | 7.7 |
| Germany | 660.1 | 705.6 | 675.6 | 715.6 | 710.3 | 736.4 | 2.2 | 7.3 |
| France | 565.4 | 570.3 | 567.5 | 665.1 | 700.1 | 636.1 | 2.4 | 6.3 |
| Netherlands | 410.6 | 415.0 | 407.2 | 434.2 | 475.4 | 469.9 | 2.7 | 4.7 |
| Canada (6) | 356.8 | 355.2 | 342.0 | 380.3 | 407.6 | 374.2 | 1.0 | 3.7 |
| Belgium | 334.9 | 367.9 | 344.8 | 350.3 | 460.6 | 360.8 | 1.5 | 3.6 |
| Poland | 272.2 | 277.8 | 297.5 | 328.3 | 332.2 | 323.1 | 3.5 | 3.2 |
| Spain | 199.9 | 193.8 | 173.9 | 197.6 | 206.2 | 211.1 | 1.1 | 2.1 |
| Italy | 164.2 | 165.1 | 159.3 | 178.3 | 196.7 | 189.5 | 2.9 | 1.9 |
| South Korea (24) | 97.0 | 97.3 | 92.1 | 95.1 | 100.3 | 106.7 | 1.9 | 1.1 |
|
Source: Global Trade Tracker, 2024 *CAGR: Compound Annual Growth Rate |
||||||||
South Korean trade overview of confectionery imports
South Korea has a diverse network of confectionery suppliers. In 2023, the top three suppliers of confectionery to South Korea were China with values of US$98.7 million (15.0% market share), 21.4 million kilograms, followed by the U.S with values of US$92.8 million (14.1% market share), 8.0 million kilograms and declining in annual growth by 4.0% from US$114.1 million in 2018, and Germany with values of US$85.3 million (12.9% market share), 13.7 million kilograms. Of interest, Türkiye experienced the greatest performance, increasing their supplies by 46.9% annually from US$5.0 million in 2018 to US$34.3 million (5.2% market share) in 2023. The advantage of being a producer and supplier of various agricultural products, combined with modern technology and tradition production methods, has served to increase Türkiye's confectionery production capacity and variety (Republic of Türkiye - Ministry of Trade, 2022). Canada in comparison, supplied South Korea with US$3.8 million of confectionery in 2023 (0.6% market share), declining 9.1% annually from US$6.2 million in 2018.
| Country | 2018 | 2019 | 2020 | 2021 | 2022 | 2023 | CAGR* % 2018-2023 | Market share % in 2023 |
|---|---|---|---|---|---|---|---|---|
| Global total | 560.1 | 563.2 | 549.1 | 587.3 | 614.8 | 659.3 | 3.3 | 100.0 |
| China | 81.8 | 79.1 | 68.7 | 82.3 | 91.5 | 98.7 | 3.8 | 15.0 |
| United States | 114.1 | 112.8 | 100.3 | 111.6 | 99.6 | 92.8 | −4.0 | 14.1 |
| Germany | 65.7 | 78.7 | 83.4 | 73.0 | 70.9 | 85.3 | 5.4 | 12.9 |
| Belgium | 40.0 | 40.3 | 38.7 | 44.2 | 47.8 | 53.4 | 6.0 | 8.1 |
| Italy | 32.5 | 32.6 | 34.1 | 37.9 | 43.4 | 37.6 | 2.9 | 5.7 |
| Singapore | 23.9 | 24.8 | 27.4 | 29.3 | 31.6 | 34.4 | 7.6 | 5.2 |
| Türkiye | 5.0 | 8.2 | 13.7 | 22.8 | 25.8 | 34.3 | 46.9 | 5.2 |
| Malaysia | 34.4 | 33.9 | 31.9 | 32.0 | 37.2 | 31.2 | −1.9 | 4.7 |
| Japan | 33.0 | 20.5 | 9.0 | 12.0 | 18.2 | 28.4 | −2.9 | 4.3 |
| Viet-Nam | 16.1 | 12.1 | 12.2 | 16.4 | 18.7 | 26.2 | 10.2 | 4.0 |
| Canada (20) | 6.2 | 6.1 | 6.8 | 4.9 | 5.5 | 3.8 | −9.1 | 0.6 |
|
Source: Global Trade Tracker, 2024 *CAGR: Compound Annual Growth Rate |
||||||||
| Country | 2018 | 2019 | 2020 | 2021 | 2022 | 2023 | CAGR* % 2018-2023 | Market share % in 2023 |
|---|---|---|---|---|---|---|---|---|
| Global total | 97.0 | 97.3 | 92.1 | 95.1 | 100.3 | 106.7 | 1.9 | 100.0 |
| China | 15.0 | 14.9 | 13.5 | 16.1 | 17.9 | 21.4 | 7.4 | 20.1 |
| Germany | 12.1 | 14.4 | 14.9 | 12.1 | 12.4 | 13.7 | 2.6 | 12.8 |
| Singapore | 6.5 | 6.9 | 7.6 | 7.6 | 7.8 | 8.7 | 6.1 | 8.2 |
| Belgium | 7.2 | 7.4 | 7.0 | 7.5 | 8.2 | 8.2 | 2.9 | 7.7 |
| United States | 14.3 | 14.1 | 11.3 | 11.8 | 10.3 | 8.0 | −11.0 | 7.5 |
| Türkiye | 1.6 | 2.4 | 3.7 | 5.2 | 6.3 | 7.9 | 37.6 | 7.4 |
| Malaysia | 6.0 | 6.1 | 5.5 | 5.7 | 6.0 | 5.5 | −1.7 | 5.2 |
| Italy | 3.3 | 3.5 | 3.4 | 3.8 | 4.9 | 3.9 | 3.7 | 3.7 |
| Vietnam | 2.6 | 1.9 | 2.0 | 2.6 | 2.9 | 3.7 | 7.7 | 3.5 |
| Spain | 2.5 | 3.0 | 3.5 | 2.5 | 3.1 | 3.5 | 7.4 | 3.3 |
| Canada (23) | 0.6 | 0.6 | 0.6 | 0.5 | 0.5 | 0.4 | −8.1 | 0.4 |
|
Source: Global Trade Tracker, 2024 *CAGR: Compound Annual Growth Rate |
||||||||
South Korea is a net importer of confectionery. In 2023, South Korea's confectionery trade deficit was US$507.8 million as the country recorded imports of US$659.3 million and exports of US$151.5 million. In 2023, the country's top imported confectionery products were sugar confectionery (HS code 170490) with values of US$299.9 million (45.5% market share), followed by chocolate and other cocoa preparations (HS code 180690) with values of US$149.4 million (22.7% market share) and chocolate and other cocoa preparations, in slabs/bars (HS code 180620) with values of US$103.4 million (15.7% market share).
Of the top 3 imported confectionery products, sugar confectionery experienced the greatest performance increasing 5.7% annually from US$227.3 million in 2018, while in the remaining products, chocolate, in slabs/bars increased 6.0% annually from US$36.1 million in 2018 to US$48.3 million in 2023, while cocoa powder declined 6.7% annually during the same period.
| HS Code | Description | 2018 | 2019 | 2020 | 2021 | 2022 | 2023 | CAGR* % 2018-2023 | Market share % in 2023 |
|---|---|---|---|---|---|---|---|---|---|
| Confectionery total | 560.1 | 563.2 | 549.1 | 587.3 | 614.8 | 659.3 | 3.3 | 100.0 | |
| 170490 | sugar confectionery not containing cocoa, including white chocolate (excluding chewing gum) | 227.3 | 233.1 | 219.8 | 228.2 | 249.1 | 299.9 | 5.7 | 45.5 |
| 180690 | chocolate and other preparations containing cocoa, in packings of <= 2 kilograms (excluding in blocks, slabs or bars and cocoa powder) | 146.2 | 147.6 | 142.3 | 144.3 | 146.5 | 149.4 | 0.4 | 22.7 |
| 180620 | chocolate and other food preparations containing cocoa, in blocks, slabs or bars, weighing > 2 kilograms | 83.5 | 83.6 | 85.4 | 104.8 | 102.5 | 103.4 | 4.4 | 15.7 |
| 180631 | chocolate and other preparations containing cocoa, in blocks, slabs or bars of <= 2 kilograms, filled | 58.6 | 52.9 | 51.3 | 53.6 | 56.3 | 51.7 | −2.5 | 7.8 |
| 180632 | chocolate and other preparations containing cocoa, in blocks, slabs or bars of <= 2 kilograms (excluding filled) | 36.1 | 37.7 | 43.0 | 48.5 | 51.4 | 48.3 | 6.0 | 7.3 |
| 180610 | cocoa powder, sweetened | 4.8 | 5.9 | 4.8 | 5.4 | 6.5 | 3.4 | −6.7 | 0.5 |
| 170410 | chewing gum, whether or not sugar-coated | 3.6 | 2.3 | 2.6 | 2.5 | 2.6 | 3.2 | −2.4 | 0.5 |
|
Source: Global Trade Tracker, 2024 *CAGR: Compound Annual Growth Rate |
|||||||||
South Korea imported US$659.3 million, 106.7 million kilograms of confectionery in 2023, supplied primarily by China, the U.S and Germany. Of the country's confectionery imports, sugar confectionery (HS code: 170490) was the largest with values of US$299.9 million (45.5% market share), 56.9 million kilograms, supplied mainly by China and Germany, followed by chocolate and other cocoa preparations (HS code: 180690) with values of US$149.4 million (22.7% market share), 15.7 million kilograms provided mainly by the U.S and China, and chocolate and other cocoa preparations, in slabs/bars (HS code: 180620) with values of US$103.4 million (15.7% market share), 20.9 million kilograms, supplied primarily by Singapore and Belgium, in 2023.
Canada has attained measurable market representation in South Korea's confectionery imports particularly chocolate and other cocoa preparations imports, which Canada's supply represented 2.1% of the market share in 2023.
| HS Code | Description | Import value (US$M) | Import volume (million kilograms) | Top suppliers and market value share | Canada's value share | ||
|---|---|---|---|---|---|---|---|
| 1 | 2 | 3 | |||||
| Confectionery total | 659.3 | 106.7 | China: 15.0 | United States: 14.1 | Germany: 13.0 | 0.6 | |
| 170490 | sugar confectionery not containing cocoa, including white chocolate (excluding chewing gum) | 299.9 | 56.9 | China: 23.0 | Germany: 20.0 | Türkiye: 8.4 | 0.1 |
| 180690 | chocolate and other preparations containing cocoa, in packings of <= 2 kilograms (excluding in blocks, slabs or bars and cocoa powder) | 149.4 | 15.7 | United States: 37.0 | China: 12.0 | Malaysia: 8.0 | 2.1 |
| 180620 | chocolate and other food preparations containing cocoa, in blocks, slabs or bars, weighing > 2 kilograms | 103.4 | 20.9 | Singapore: 26.1 | Belgium: 18.8 | Netherlands: 11.8 | 0.3 |
| 180631 | chocolate and other preparations containing cocoa, in blocks, slabs or bars of <= 2 kilograms, filled | 51.7 | 6.3 | Italy: 40.6 | China: 19.2 | Germany: 15.0 | 0.1 |
| 180632 | chocolate and other preparations containing cocoa, in blocks, slabs or bars of <= 2 kilograms (excluding filled) | 48.3 | 5.6 | Belgium: 24.2 | Malaysia: 18.4 | United States: 10.0 | 0.0 |
| 180610 | cocoa powder, sweetened | 3.4 | 1.0 | Singapore: 42.9 | Brazil: 25.0 | United States: 17.0 | 0.1 |
| 170410 | chewing gum, whether or not sugar-coated | 3.2 | 0.3 | United States: 42.2 | China: 24.3 | Japan: 17.1 | 1.4 |
| Source: Global Trade Tracker, 2024 | |||||||
Canada's performance
Canada's export market
Canada, unlike South Korea, is a net exporter of confectionery (products). In 2023, Canada enjoyed a confectionery trade surplus of US$0.8 billion with imports of US$1.9 billion and exports valued at US$2.7 billion (+6.6% from exports of US$2.0 billion in 2018). Of interest, Canada was the sixth largest (after Poland and Italy) global exporter of confectionery in 2023.
Top export markets for Canadian confectionery in 2023 was primarily the U.S (97.0% market share) and Mexico (1.2% market share). South Korea was the eighth largest export market for Canadian confectionery, with values of US$2.6 million in 2023, representing a decline in annual growth of 11.3% from US$4.8 million in 2018.
Canada's primary confectionery (product) exported to South Korea was chocolate and other cocoa preparations (HS code: 180690) with values of US$2.6 million (99.9% market share) in 2023, representing the only growth (4.7%) annually from US$2.1 million in 2018.
| HS Code | Description | 2018 | 2019 | 2020 | 2021 | 2022 | 2023 | CAGR* % 2018-2023 | Market share % in 2023 |
|---|---|---|---|---|---|---|---|---|---|
| Confectionery total | 4.8 | 4.7 | 3.6 | 2.1 | 4.4 | 2.6 | −11.3 | 100.0 | |
| 180690 | chocolate and other preparations containing cocoa, in packings of <= 2 kilograms (excluding in blocks, slabs or bars and cocoa powder) | 2.1 | 2.4 | 1.7 | 1.8 | 4.3 | 2.6 | 4.7 | 99.9 |
| 170490 | sugar confectionery not containing cocoa, including white chocolate (excluding chewing gum) | 2.3 | 2.0 | 0.7 | 0.1 | 0.1 | 0.0 | −73.2 | 0.1 |
| 180632 | chocolate and other preparations containing cocoa, in blocks, slabs or bars of <= 2 kilograms (excluding filled) | 0.3 | 0.1 | 0.0 | −96.2 (2018-2021) | 0.0 | |||
| 180631 | chocolate and other preparations containing cocoa, in blocks, slabs or bars of <= 2 kilograms, filled | 0.0 | 0.0 | 0.0 | 0.0 | 0.0 | −68.4 (2018-2022) | 0.0 | |
| 180620 | chocolate and other food preparations containing cocoa, in blocks, slabs or bars, weighing > 2 kilograms | 0.9 | 0.2 | 0.1 | −65.0 (2020-2022) | 0.0 | |||
| 180610 | cocoa powder, sweetened | 0.0 | 0.0 | ||||||
| 170410 | chewing gum, whether or not sugar-coated | 0.0 | 0.1 | 0.3 | 0.0 | −0.2 (2018-2021) | 0.0 | ||
|
Source: Global trade tracker, 2024 *CAGR: Compound Annual Growth Rate |
|||||||||
Ontario was prominent in supplying confectionery to South Korea, occupying an 84.8% market share, followed by Québec with a 10.4% market share and British Columbia (B.C), representing an 4.8% market share in 2023. Ontario was also prominent in supplying Canada's largest confectionery export to South Korea, chocolate, and other cocoa preparations, providing an 85.0% market share, while B.C provided 99.8% of sugar confectionery to South Korea in 2023.
| HS Code | Description | Export value (US$) | Export volume (kilograms) | Top provincial suppliers and market value share | ||
|---|---|---|---|---|---|---|
| Confectionery total | 2,617,191 | 484,683 | Ontario: 84.8 | Quebec: 10.4 | British Columbia: 4.8 | |
| 180690 | chocolate and other preparations containing cocoa, in packings of <= 2 kilograms (excluding in blocks, slabs or bars and cocoa powder) | 2,613,977 | 483,844 | Ontario: 85.0 | Quebec: 10.4 | British Columbia: 4.7 |
| 170490 | sugar confectionery not containing cocoa, including white chocolate (excluding chewing gum) | 3,214 | 839 | British Columbia: 99.8 | Quebec: 0.2 | |
| Source: Global trade tracker, 2024 | ||||||
Global retail sales of confectionery
Global retail sales of confectionery have increased 5.2% yearly from US$163.6 billion in 2018 to US$211.0 billion in 2023 and are expected to increase by an additional 6.6% annually as retail sales reach US$291.0 billion by 2028.
The U.S was the largest global confectionery market with retail sales of US$48.8 billion (23.1% market share), followed by China with retail sales of US$12.8 billion (6.1% market share) and Germany with retail sales of US$12.5 billion (5.9% market share) in 2023.
South Korea was the thirtieth largest global retail sales market for confectionery with retail sales of US$1.3 billion (0.6% market share) in 2023, declining slightly by 0.3% from US$1.3 billion in 2018. In the forecast period, South Korea is expected to grow an additional 3.3% to attain retail sales of US$1.5 billion by 2028. Canada in comparison, was the tenth largest global retail sales market for confectionery, accounting for a 2.1% market share with values of US$4.5 billion in 2023. Canada is also expected to achieve positive growth with an increase in CAGR of 5.5% as retail sales are anticipated to reach US$5.8 billion by 2028.
| Geography | 2018 | 2023 | CAGR* % 2018-2023 | 2024 | 2028 | CAGR* % 2023-2028 |
|---|---|---|---|---|---|---|
| Global retail sales of confectionery (total) | 163,586.9 | 211,045.9 | 5.2 | 226,078.2 | 291,021.9 | 6.6 |
| United States | 34,547.3 | 48,843.6 | 7.2 | 51,847.4 | 61,135.7 | 4.6 |
| China | 13,996.3 | 12,832.1 | −1.7 | 13,219.7 | 14,454.9 | 2.4 |
| Germany | 10,739.6 | 12,453.0 | 3.0 | 12,857.3 | 14,395.0 | 2.9 |
| Russia | 7,961.3 | 11,773.7 | 8.1 | 12,716.1 | 16,980.0 | 7.6 |
| United Kingdom | 10,321.3 | 11,249.7 | 1.7 | 11,588.0 | 13,513.3 | 3.7 |
| Japan | 8,661.9 | 8,658.0 | 0.0 | 9,014.6 | 9,528.7 | 1.9 |
| France | 6,292.1 | 7,279.7 | 3.0 | 7,552.9 | 8,267.4 | 2.6 |
| Brazil | 5,528.0 | 7,209.3 | 5.5 | 7,972.7 | 10,803.6 | 8.4 |
| Mexico | 3,792.9 | 5,347.8 | 7.1 | 5,842.5 | 7,725.0 | 7.6 |
| Canada (10) | 3,450.8 | 4,454.0 | 5.2 | 4,725.7 | 5,821.1 | 5.5 |
| South Korea (30) | 1,271.6 | 1,250.4 | −0.3 | 1,313.6 | 1,469.1 | 3.3 |
|
Source: Euromonitor International, 2024 *CAGR: Compound Annual Growth Rate |
||||||
Retail sales of confectionery in South Korea
Retail sales of confectionery in South Korea decreased slightly in value by 0.3% annually from US$1,271.6 million, (114.0 million kilograms) in 2018 to US$1,250.4 million, (109.1 million kilograms) in 2023. Sugar confectionery was the largest category of confectionery with retail sales of US$575.9 million (46.1% market share), 65.6 million kilograms, followed by chocolate confectionery with values of US$535.0 million (42.8% market share), 37.8 million kilograms and gum, valued at US$139.5 million (11.2% market share), 5.7 million kilograms in 2023.
In the forecast period, confectionery retail sales are expected to recover and increase in value by 3.3% to attain US$1.5 billion (117.3 million kilograms) by 2026. All categories of confectionery are expected to improve as sugar confectionery in particular, will experience the greatest performance, increasing 4.6% annually to US$721.0 million by 2028.
| Category | 2018 | 2023 | CAGR* % 2018-2023 | 2024 | 2028 | CAGR* % 2023-2028 |
|---|---|---|---|---|---|---|
| Confectionery | 1,271.6 | 1,250.4 | −0.3 | 1,313.6 | 1,469.1 | 3.3 |
| Chocolate Confectionery | 543.7 | 535.0 | −0.3 | 551.6 | 602.2 | 2.4 |
| Gum | 203.7 | 139.5 | −7.3 | 151.5 | 145.8 | 0.9 |
| Sugar Confectionery | 524.2 | 575.9 | 1.9 | 610.5 | 721.0 | 4.6 |
|
Source: Euromonitor International, 2024 *CAGR: Compound Annual Growth Rate |
||||||
| Category | 2018 | 2023 | CAGR* % 2018-2023 | 2024 | 2028 | CAGR* % 2023-2028 |
|---|---|---|---|---|---|---|
| Confectionery | 114.0 | 109.1 | −0.9 | 112.2 | 117.3 | 1.5 |
| Chocolate Confectionery | 41.5 | 37.8 | −1.9 | 38.3 | 38.3 | 0.3 |
| Gum | 8.8 | 5.7 | −8.3 | 6.1 | 5.3 | −1.4 |
| Sugar Confectionery | 63.8 | 65.6 | 0.6 | 67.9 | 73.7 | 2.4 |
|
Source: Euromonitor International, 2024 1: Confectionery volume sales are primarily through retail channels (97.6% market share in 2023) versus foodservice channels. *CAGR: Compound Annual Growth Rate |
||||||
Competitive landscape
Lotte Group and Crown Confectionery Co Ltd were the two largest confectionery companies in South Korea representing a combined market share representation of 40.0% in 2023. In terms of retail sales, Lotte Group (top brand names; Lotte, Ghana, Crunky, Jellycious, Malrang, ABC, Mok, Flavono and Scotch) led sales, attaining values of US$338.8 million in 2023. Crown Confectionery Co Ltd (top brand names; Free Time, My Chew, Haitai and Secomdalcom), South Korea's second largest confectionery company, attained retail values of US$160.6 million in 2023. Private label companies in comparison, continue to show a measured presence in the confectionery market with retail sales of US$15.0 million (1.2% market share) in 2023.
| Company | Retail sales (US$ millions) | Market share % |
|---|---|---|
| Total | 1,250.4 | 100.0 |
| Lotte Group | 338.8 | 27.1 |
| Crown Confectionery Co Ltd | 160.8 | 12.9 |
| Ferrero & related parties | 102.8 | 8.2 |
| Mars Inc | 97.4 | 7.8 |
| Orion Group | 90.3 | 7.2 |
| Haribo GmbH & Co kilograms | 81.6 | 6.5 |
| Hershey Co, The | 48.4 | 3.9 |
| CJ Corp | 36.6 | 2.9 |
| Perfetti Van Melle Group | 26.8 | 2.1 |
| Trolli GmbH | 20.4 | 1.6 |
| Private Label | 15.0 | 1.2 |
| Others | 158.9 | 12.7 |
| Source: Euromonitor International, 2024 | ||
Distribution channels
The majority of South Korea's confectionery market is distributed through grocery retailers (retail offline), representing US$1.1 billion (86.6% market share), with hypermarkets and convenience stores attaining the majority of retail sales, US$450.7 million (36.0% market share) and US$291.7 million (23.3% market share) respectively, in 2023. Remaining sales are distributed through non-grocery retailers such as general merchandise stores, with values of US$49.7 million (4.0% market share), vending with retail sales of US$3.9 million (0.3% market share) and retail online (e-commerce) channels, representing US$94.5 million (7.6% market share) in 2023. Of note, e-commerce sales have experienced the greatest performance in the historic period, increasing 18.1% annually from US$41.2 million in 2018 (accelerated initially by the pandemic). The channel is expected to remain relevant in the forecast period as leading manufacturers continue to partner with prominent e-commerce companies in South Korea to sell their products and reinforce their online presence.
| Outlet type | 2018 | 2023 | ||
|---|---|---|---|---|
| Actual | Share % | Actual | Share % | |
| Distribution Channel (Total) | 1,271.6 | 100.0 | 1,250.4 | 100.0 |
| Retail Offline | 1,230.5 | 96.8 | 1,155.9 | 92.4 |
| Grocery Retailers | 1,181.8 | 92.9 | 1,082.5 | 86.6 |
| Convenience Retail | 244.5 | 19.2 | 293.4 | 23.5 |
| Convenience Stores | 243.1 | 19.1 | 291.7 | 23.3 |
| Forecourt Retailers | 1.4 | 0.1 | 1.6 | 0.1 |
| Supermarkets | 222.8 | 17.5 | 175.3 | 14.0 |
| Hypermarkets | 539.5 | 42.4 | 450.7 | 36.0 |
| Discounters | 5.7 | 0.4 | 7.5 | 0.6 |
| Warehouse Clubs | 14.4 | 1.1 | 23.2 | 1.9 |
| Food/drink/tobacco specialists | 29.1 | 2.3 | 30.9 | 2.5 |
| Small Local Grocers | 125.9 | 9.9 | 101.6 | 8.1 |
| Non-Grocery Retailers | 44.1 | 3.5 | 69.5 | 5.6 |
| General Merchandise Stores | 38.8 | 3.1 | 49.7 | 4.0 |
| Health and Beauty Specialists | 5.3 | 0.4 | 19.8 | 1.6 |
| Vending | 4.5 | 0.4 | 3.9 | 0.3 |
| Retail E-Commerce | 41.2 | 3.2 | 94.5 | 7.6 |
| Source: Euromonitor International, 2024 | ||||
Market segmentation
Sugar confectionery
Sugar confectionery is the largest category in the confectionery market in South Korea with retail sales of US$575.9 million in 2023, representing an increase in CAGR of 1.9% from retail sales of US$524.2 million in 2018. According to Euromonitor International, growth in sugar confectionery is projected to increase in most segments attributed to recent inflationary factors and the announcement of the ending of the pandemic and the lifting of the mask mandate, leading to a boost in consumption. (Euromonitor International; Sugar Confectionery, June 2023).
In value terms, pastilles, gums, jellies and chews were the largest segment of sugar confectionery in South Korea with retail sales of US$334.7 million (58.1% market share) in 2023 (+7.2% from US$312.2 million in 2022) and 11.8% in total growth.
Other sugar confectionery was the second largest segment of sugar confectionery in South Korea with retail sales of US$83.0 million (14.4% market share) in 2023. Of interest, the mint segment attained the greatest performance, increasing 13.6% annually from US$20.8 million in 2018 to US$39.4 million in 2023 (+11.3% from US$35.4 million in 2022), and the medicated confectionery segment recently increased 13.0% from US$28.4 million in 2022 to US$32.1 million in 2023), as both segments benefitted from recent mask-lifting environments. According to Euromonitor International, South Korean consumers prefer flavours with a moderate level of freshness, demonstrating a shift from gum usage (Euromonitor International; Sugar Confectionery, June 2023).
The toffees, caramels and nougat segment in contrast, experienced declines of 4.5% annually from US$13.0 million in 2018 to US$10.3 million in 2023 and has recently increased (4.0% from US$9.9 million in 2022.
| Category | 2018 | 2019 | 2020 | 2021 | 2022 | 2023 |
|---|---|---|---|---|---|---|
| Sugar Confectionery | 524.2 | 551.9 | 506.3 | 485.7 | 541.0 | 575.9 |
| Boiled Sweets | 44.7 | 42.0 | 34.8 | 32.0 | 36.8 | 39.9 |
| Lollipops | 33.7 | 35.0 | 30.5 | 28.0 | 33.2 | 36.4 |
| Medicated Confectionery | 40.9 | 42.0 | 32.5 | 26.6 | 28.4 | 32.1 |
| Mints | 20.8 | 32.7 | 30.8 | 30.1 | 35.4 | 39.4 |
| Standard Mints | 20.8 | 32.7 | 30.8 | 30.1 | 35.4 | 39.4 |
| Pastilles, Gummies, Jellies and Chews | 299.3 | 307.7 | 282.5 | 271.5 | 312.2 | 334.7 |
| Toffees, Caramels and Nougat | 13.0 | 12.8 | 10.6 | 9.3 | 9.9 | 10.3 |
| Other Sugar Confectionery[1] | 71.8 | 79.7 | 84.6 | 88.4 | 85.1 | 83.0 |
|
Source: Euromonitor International, 2024 1: Other sugar confectionery (as defined by Euromonitor International, 2024) - marshmallow or sweet liquid concentrates sold as candies, etc. Halva products are also included. These products are usually made from ground sesame seeds (tahini) and honey, sometimes with the addition of chopped dried fruit and pistachio nuts. |
||||||
| Category | Annual growth % 2022-2023 | CAGR* % 2018-2023 | Total growth % 2018-2023 |
|---|---|---|---|
| Sugar Confectionery | 6.5 | 1.9 | 9.9 |
| Boiled Sweets | 8.4 | −2.2 | −10.7 |
| Lollipops | 9.6 | 1.6 | 8.0 |
| Medicated Confectionery | 13.0 | −4.7 | −21.5 |
| Mints | 11.3 | 13.6 | 89.4 |
| Standard Mints | 11.3 | 13.6 | 89.4 |
| Pastilles, Gummies, Jellies and Chews | 7.2 | 2.3 | 11.8 |
| Toffees, Caramels and Nougat | 4.0 | −4.5 | −20.8 |
| Other Sugar Confectionery | −2.5 | 2.9 | 15.6 |
|
Source: Euromonitor International, 2024 *CAGR: Compound Annual Growth Rate |
|||
In the sugar confectionery competitive landscape, Lotte Group (Brand names: Jellycious, Malrang Cow, Mok and Scotch) led sales with a market share of 18.0%, followed by Crown Confectionery Co Ltd (Brand names: My Chew, Haitai, Secomdalcom and Crown), with a market share of 17.1% and Haribo GmbH & Co kilograms (Brand name: Haribo), with a market share of14.2% in 2023. Private label in comparison, held a 1.4% market share in 2023.
Recently, the reintroduction of animated characters such as Pokémon has extended to various snack categories, including jelly products, attracting the attention of both generation z and millennial consumers, who grew up with these characters. As a result, the incorporation of animated characters has become a significant factor contributing to the success and growth of sugar confectionery in South Korea (Euromonitor International; Sugar Confectionery, June 2023).
| Company | Retail Sales (US$ millions) | Market share % |
|---|---|---|
| Total | 575.9 | 100.0 |
| Lotte Group | 103.5 | 18.0 |
| Crown Confectionery Co Ltd | 98.7 | 17.1 |
| Haribo GmbH & Co kilograms | 81.6 | 14.2 |
| Orion Group | 57.2 | 9.9 |
| CJ Corp | 36.6 | 6.4 |
| Private Label | 8.0 | 1.4 |
| Others | 73.1 | 12.7 |
| Source: Euromonitor International, 2024 | ||
In the forecast period, sugar confectionery is expected to remain the largest of the confectionery categories attaining a moderate CAGR of 4.6% and retail sales of US$721.0 million by 2028. All segments of sugar confectionery are expected to experience positive growth, with the exception of boiled sweets, which is expected to decline slightly (0.5%) annually, by 2028 due to limited product innovation (Euromonitor International; June 2023), while medicated confectionery and the toffees, caramels and nougat segments are expected to recover, attaining annual growth of 5.7% and 1.5% respectively, by 2028. Relatedly, medicated confectionery and mints are expected to maintain consumer demand throughout the forecast period due to the consumers constant need for mouth freshness (Euromonitor International; June 2023).
The outlook for pastilles, gummies, jellies, and chews in particular, is promising as more consumers prefer confectionery options with diverse flavours and textures over traditional gum, prompting continuous and creative innovation to sustain and expand product development (Euromonitor International; June 2023).
In addition, the demand for zero and low sugar confectionery options has been increasing, however; concerns regarding the use of zero-sugar alternatives and their potential side-effects and safety, will need to be addressed by the packaged food industry to sustain product development (Euromonitor International; June 2023).
| Category | 2024 | 2025 | 2026 | 2027 | 2028 |
|---|---|---|---|---|---|
| Sugar Confectionery | 610.5 | 639.0 | 667.2 | 694.6 | 721.0 |
| Boiled Sweets | 42.0 | 41.5 | 40.9 | 40.0 | 39.0 |
| Lollipops | 38.4 | 39.7 | 40.7 | 41.4 | 41.9 |
| Medicated Confectionery | 35.2 | 37.1 | 39.0 | 40.7 | 42.3 |
| Mints | 42.7 | 45.0 | 47.5 | 50.6 | 54.0 |
| Standard Mints | 42.7 | 45.0 | 47.5 | 50.6 | 54.0 |
| Pastilles, Gummies, Jellies and Chews | 355.7 | 375.4 | 394.8 | 413.2 | 430.3 |
| Toffees, Caramels and Nougat | 10.7 | 10.9 | 11.0 | 11.1 | 11.1 |
| Other Sugar Confectionery | 85.9 | 89.3 | 93.3 | 97.7 | 102.7 |
| Source: Euromonitor International, 2024 | |||||
| Category | Annual growth % 2023-2024 | CAGR* % 2023-2028 | Total growth % 2023-2028 |
|---|---|---|---|
| Sugar Confectionery | 6.0 | 4.6 | 25.2 |
| Boiled Sweets | 5.3 | −0.5 | −2.3 |
| Lollipops | 5.5 | 2.9 | 15.1 |
| Medicated Confectionery | 9.7 | 5.7 | 31.8 |
| Mints | 8.4 | 6.5 | 37.1 |
| Standard Mints | 8.4 | 6.5 | 37.1 |
| Pastilles, Gummies, Jellies and Chews | 6.3 | 5.2 | 28.6 |
| Toffees, Caramels and Nougat | 3.9 | 1.5 | 7.8 |
| Other Sugar Confectionery | 3.5 | 4.4 | 23.7 |
|
Source: Euromonitor International, 2024 *CAGR: Compound Annual Growth Rate |
|||
Chocolate confectionery
Chocolate confectionery was the second largest category in South Korea's confectionery market with retail sales of US$535.0 million (42.8% market share in 2023). The category declined slightly by 0.3% during the 2018-2023 period, decreasing from retail sales of US$543.7 million in 2018. According to Euromonitor International, retail volume sales of chocolate confectionery was expected to stagnate while retail values sales remained positive and varied, due to inflationary factors in 2023. For instance, chocolate pouches and bags were anticipated to decline in retail value as the popularity of ball-shaped chocolates such as Maltesers has gradually diminished since 2021, while demand for small pouches and bags remains as an indulgent office snack (Euromonitor International; Chocolate Confectionery, June 2023).
Countlines were the largest segment of the category with retail value sales of US$171.3 million (32.0% market share) in 2023 (+6.3% from US$161.1 million in 2022), attributed to the recovery of on-the-go consumption of snacks, following the announcement of the end of the pandemic in May 2023 (Euromonitor International; Chocolate Confectionery, June 2023). Seasonal chocolate achieved the best performance, increasing 4.8% annually from retail sales of US$29.8 million in 2018 to US$37.7 million in 2023 (+8.6% from US$34.7 million in 2022), as South Korea commemorated the return of Valentine's day celebrations following the relaxation of mask regulations (Euromonitor International; Chocolate Confectionery, June 2023), while chocolate with toys and the tablet segments in particular, declined marginally by 2.3% and 1.7% respectively, from 2018 to 2023, and have since recovered, increasing 4.3% and 5.7% respectively since 2022. Boxed assortments also experienced moderate growth (4.5%) from US$34.4 million in 2018 to US$42.9 million in 2023 (+6.2% from US$40.4 million in 2022).
| Category | 2018 | 2019 | 2020 | 2021 | 2022 | 2023 |
|---|---|---|---|---|---|---|
| Chocolate Confectionery | 543.7 | 521.7 | 515.1 | 491.2 | 513.2 | 535.0 |
| Chocolate Pouches and Bags | 136.9 | 130.3 | 147.0 | 137.9 | 130.3 | 128.6 |
| Boxed Assortments | 34.4 | 37.4 | 38.8 | 37.1 | 40.4 | 42.9 |
| Chocolate with Toys | 43.4 | 34.7 | 36.9 | 36.3 | 37.1 | 38.7 |
| Countlines | 173.5 | 168.4 | 153.1 | 148.5 | 161.1 | 171.3 |
| Seasonal Chocolate | 29.8 | 33.0 | 33.2 | 31.5 | 34.7 | 37.7 |
| Tablets | 123.4 | 115.6 | 103.9 | 97.7 | 107.3 | 113.4 |
| Other Chocolate Confectionery | 2.3 | 2.1 | 2.2 | 2.2 | 2.3 | 2.4 |
| Source: Euromonitor International, 2024 | ||||||
| Category | Annual growth % 2022-2023 | CAGR* % 2018-2023 | Total growth % 2018-2023 |
|---|---|---|---|
| Chocolate Confectionery | 4.2 | −0.3 | −1.6 |
| Chocolate Pouches and Bags | −1.3 | −1.2 | −6.1 |
| Boxed Assortments | 6.2 | 4.5 | 24.7 |
| Chocolate with Toys | 4.3 | −2.3 | −10.8 |
| Countlines | 6.3 | −0.3 | −1.3 |
| Seasonal Chocolate | 8.6 | 4.8 | 26.5 |
| Tablets | 5.7 | −1.7 | −8.1 |
| Other Chocolate Confectionery | 4.3 | 0.9 | 4.3 |
|
Source: Euromonitor International, 2024 *CAGR: Compound Annual Growth Rate |
|||
In the chocolate confectionery competitive landscape, innovations incorporating unique collaborations and packaging revamps have been implemented by some manufacturers to cater to consumer preferences and create engaging experiences (Euromonitor International; Chocolate Confectionery, June 2023). For example, Crown Confectionery collaborated with YBM (a prominent English language academy in the country), launching a chocolate that contains taurine which is known for its ability to enhance focus and combat fatigue, while Mars South Korea partnered with the global K-pop group BTS for its Snickers brand by incorporating popular song lyrics from the group, on their packaging (Euromonitor International; Chocolate Confectionery, June 2023).
In addition, there remains growing awareness of the importance of incorporating healthy elements into chocolate confectionery products, prompting manufacturers to cater to the evolving needs and preferences of the South Korean consumer. For example, Lotte Wellfood recently introduced ABC chocolate, available in blueberry yoghurt flavour, incorporating fructooligosaccharides and probiotics, adding a distinctive taste and providing potential health benefits to consumers (Euromonitor International; Chocolate Confectionery, June 2023)
In terms of retail values, Lotte Group (Brand names: Ghana, Crunky and ABC) led sales with a market share of 23.5%, followed by Ferrero & related parties (Brand names: Ferrero Rocher and Kinder) with a market share of 19.2% and Mars Inc (Brand names: Snickers, M&M's, Twix and Maltesers) with a market share of 14.0% in 2023. Private label in comparison, held a 1.0% market share representation in 2023.
| Company | Retail sales (US$ millions) | Market share % |
|---|---|---|
| Total | 535.0 | 100.0 |
| Lotte Group | 125.6 | 23.5 |
| Ferrero and related parties | 102.8 | 19.2 |
| Mars Inc | 74.9 | 14.0 |
| Crown Confectionery Co Ltd | 59.2 | 11.1 |
| Hershey Co, The | 42.7 | 8.0 |
| Private Label | 5.1 | 1.0 |
| Others | 74.0 | 13.8 |
| Source: Euromonitor International, 2024 | ||
The chocolate confectionery market is forecast to remain positive with a CAGR of 2.4% as retail sales are anticipated to reach US$602.2 million by 2028. All segments of chocolate confectionery are expected to experience positive growth with countlines remaining the largest retail sale segment and seasonal chocolates continue to experience the greatest performance (4.3%) annually, attaining retail sales of US$46.5 million by 2028 (from retail sales of US$37.7 million held in 2018). However, despite projected value growth within the chocolate confectionery category in the forecast period, Euromonitor International notes that the segment in comparison to other confectionery segments such as pastilles, gummies, jellies and chews, has experienced limited innovation in terms of new flavours, textures or collaborative products, and faces increasing competition from other categories such as chocolate-coated biscuits, packaged pastries and other chocolate desserts, that have been more proactive in product innovation. As such, chocolate confectionery manufacturers are actively seeking opportunities to differentiate and increase chocolate consumption occasions that cater to evolving consumer preferences. One notable trend has been the pairing of chocolate with different wine varieties. Orion for example, recently introduced a bark type chocolate enriched with nuts, seeds, and granola to provide consumers with a more indulgent and sophisticated snacking option.
| Category | 2024 | 2025 | 2026 | 2027 | 2028 |
|---|---|---|---|---|---|
| Chocolate Confectionery | 551.6 | 564.0 | 577.4 | 590.2 | 602.2 |
| Chocolate Pouches and Bags | 131.5 | 133.3 | 134.4 | 135.2 | 135.6 |
| Boxed Assortments | 44.4 | 45.6 | 47.3 | 49.1 | 51.0 |
| Chocolate with Toys | 38.3 | 38.8 | 39.1 | 39.3 | 39.3 |
| Countlines | 178.9 | 186.1 | 193.1 | 199.9 | 206.5 |
| Seasonal Chocolate | 38.9 | 40.4 | 42.3 | 44.3 | 46.5 |
| Tablets | 117.1 | 117.2 | 118.8 | 119.9 | 120.7 |
| Other Chocolate Confectionery | 2.5 | 2.6 | 2.6 | 2.6 | 2.5 |
| Source: Euromonitor International, 2024 | |||||
| Category | Annual growth % 2023-2024 | CAGR* % 2023-2028 | Total growth % 2023-2028 |
|---|---|---|---|
| Chocolate Confectionery | 3.1 | 2.4 | 12.6 |
| Chocolate Pouches and Bags | 2.3 | 1.1 | 5.4 |
| Boxed Assortments | 3.5 | 3.5 | 18.9 |
| Chocolate with Toys | −1.0 | 0.3 | 1.6 |
| Countlines | 4.4 | 3.8 | 20.5 |
| Seasonal Chocolate | 3.2 | 4.3 | 23.3 |
| Tablets | 3.3 | 1.3 | 6.4 |
| Other Chocolate Confectionery | 4.2 | 0.8 | 4.2 |
|
Source: Euromonitor International, 2024 *CAGR: Compound Annual Growth Rate |
|||
Gum
The gum category experienced significant declines in retail value sales during the pandemic due to mandatory mask-wearing regulations. The category recovered in 2023 following the complete lifting of the mask mandate; however, retail volume and value have yet to return to pre-pandemic sales as consumers are shifting towards other products to freshen their mouths, such as mints (Euromonitor International; Gum in South Korea, June 2023).
Gum is the smallest category in confectionery in South Korea with retail sales of US$139.5 million in 2023, representing a moderate decrease of 7.3% in CAGR from US$203.7 million in 2018. The category has recently recovered however, increasing 12.0% from US$124.6 million in 2022.
Chewing gum is the larger segment within gum confectionery with retail sales of US$121.9 million (87.4% market share) in 2023 (+11.6% from US$109.2 million in 2022)., despite a decline in CAGR of 6.9% from US$174.7 million in 2018. Bubble gum also experienced a decline in growth rate of 9.5%% as retail sales decreased from US$29.0 million in 2018 to U$17.6 million (12.6% market share) in 2023, and recently recovering (+14.3% from US$15.4 million in 2022).
| Category | 2018 | 2019 | 2020 | 2021 | 2022 | 2023 |
|---|---|---|---|---|---|---|
| Gum | 203.7 | 195.4 | 145.9 | 124.9 | 124.6 | 139.5 |
| Bubble Gum | 29.0 | 27.0 | 18.3 | 14.4 | 15.4 | 17.6 |
| Chewing Gum | 174.7 | 168.4 | 127.7 | 110.6 | 109.2 | 121.9 |
| Source: Euromonitor International, 2024 | ||||||
| Category | Annual growth % 2022-2023 | CAGR* % 2018-2023 | Total growth % 2018-2023 |
|---|---|---|---|
| Gum | 12.0 | −7.3 | −31.5 |
| Bubble Gum | 14.3 | −9.5 | −39.3 |
| Chewing Gum | 11.6 | −6.9 | −30.2 |
|
Source: Euromonitor International, 2024 *CAGR: Compound Annual Growth Rate |
|||
South Korea's top gum confectionery company, Lotte Group (Brand names: Lotte, Flavono, Watta, Juicy & Fresh and Spearmint), controlled the market holding a 78.6% market share, followed by Orion Group (Brand names: Orion, Wawoo and Saeng) with an 9.5% market share in 2023. Private label gum confectionery companies represented a 1.4% market share in 2023.
Lotte Wellfood has consolidated its dominance in South Korea's gum market by capitalizing on the widespread popularity of animation characters and their application in packaging deigns. The company collaborated with the Japanese Sanrio character group and features Hello Kitty, Kuromi, and My Melody on their Watta brand bubble gum packaging (Euromonitor International; Gum in South Korea, June 2023).
| Company | Retail Sales (US$ millions) | Market share % |
|---|---|---|
| Total | 139.5 | 100.0 |
| Lotte Group | 109.7 | 78.6 |
| Orion Group | 13.3 | 9.5 |
| Crown Confectionery Co Ltd | 2.8 | 2.0 |
| Private Label | 2.0 | 1.4 |
| Others | 11.7 | 8.4 |
| Source: Euromonitor International, 2024 | ||
In the forecast period, the gum category is expected to increase slightly by 0.9% annually to achieve retail sales of US$145.8 million by 2028. Chewing gum is anticipated to increase 1.2% annually to attain retail sales of US$129.7 million by 2028, however the gum category's (chewing and bubble segments) volume and value sales are not expected to return to pre-pandemic levels (Euromonitor International; Gum in South Korea, June 2023).
Euromonitor International notes that gum usage for breath freshening has diminished due to the increased availability of alternative beverages in cafés, and alternative sugar confectionery snack packaging (Euromonitor International; Gum in South Korea, June 2023). Despite the category's declining popularity, manufacturers are trying to revitalize gum consumption with product innovation and marketing strategies. For example, the addition of functional ingredients such as propolis and ginseng, which provide oral health and energy-boosting benefits, have been incorporated to increase product innovation while companies such as Lotte Wellfood, participate in empathetic marketing strategies by conveying cheerful messages on the inside of their packaging, creating an engaging experience for consumers (Euromonitor International; Gum in South Korea, June 2023).
| Category | 2024 | 2025 | 2026 | 2027 | 2028 |
|---|---|---|---|---|---|
| Gum | 151.5 | 151.3 | 150.1 | 148.2 | 145.8 |
| Bubble Gum | 18.9 | 18.6 | 18.0 | 17.1 | 16.1 |
| Chewing Gum | 132.7 | 132.7 | 132.1 | 131.1 | 129.7 |
| Source: Euromonitor International, 2024 | |||||
| Category | Annual growth % 2023-2024 | CAGR* % 2023-2028 | Total growth % 2023-2028 |
|---|---|---|---|
| Gum | 8.6 | 0.9 | 4.5 |
| Bubble Gum | 7.4 | −1.8 | −8.5 |
| Chewing Gum | 8.9 | 1.2 | 6.4 |
|
Source: Euromonitor International, 2024 *CAGR: Compound Annual Growth Rate |
|||
Product trend analysis
Confectionery (sugar) in theAsia Pacific (APAC) region
Mintel's the Future of Chocolate, Sugar and Gum Confectionery notes that the confectionery segment and the ultra-processed food debate will continue due to the segment's association with 'ultra-processed', yet confectionery (product) offerings remain, due to its positioning as a treat (Mintel; A year of innovation in sugar confectionery, 2024).
According to Mintel, consumers in the Asia Pacific (APAC) region are often purchasing confectionery online due to the diversity of products available and the convenience of the purchasing process. Consumers are also sourcing social media channels to search and share information on new food and drink products. Conversely, confectionery brands in Asia are employing social media to build brand engagement and introduce consumers to their offerings. For instance, the other sugar confectionery category in particular, has the highest penetration (launches) of social media claims (23.0%), followed by pastilles, gums, jellies and chews (20%), while only 9% of medicated confectionery launches have a social media claim between 2018 - 2023 (Mintel; A year of innovation in sugar confectionery, 2024).
Confectionery brands are innovating with functional ingredients. According to Mintel's Total Wellbeing trend, consumers are increasingly becoming health -conscious post-pandemic and sugar confectionery with functional benefits (claims) provides consumers a convenient means to improve their wellbeing, despite the segments recent decline. (Mintel; A year of innovation in sugar confectionery, 2024).
Chocolate confectionery in theAsia Pacific (APAC) region
According to Mintel, Asia's chocolate consumers are seeking novel sensory experiences in product textures and flavours. The crunchy texture is most prevalent, followed by smooth with chunky, and melt-in-the mouth is also notable. Consumers are also keen to try chocolate confectionery products locally sourced and produced. Premium chocolate continues to be a major component of the category as private label transforms the product from an exclusive product to a supermarket staple (Mintel; A year of innovation in chocolate confectionery, 2024).
New product launch analysis
According to Mintel's Global New Products Database (GNPD), there were 1,200 new confectionery products (as a category) launched in South Korea from January 2018 to December 2023 (with 67 new confectionery products launched between January-April 2024). Of these 1,200 new products, 611 were chocolate confectionery products and 589 were categorized as sugar and gum confectionery product launches. The number of yearly new confectionery launches has decreased in growth by a CAGR of 10.3% from a launch of 264 products in 2018, to its most recent launch of 153 products in 2023.

Description of above image
| Product | 2018 | 2019 | 2020 | 2021 | 2022 | 2023 |
|---|---|---|---|---|---|---|
| Chocolate confectionery | 123 | 88 | 125 | 88 | 111 | 76 |
| Sugar and gum confectionery | 141 | 92 | 102 | 115 | 62 | 77 |
The predominant subcategories of new confectionery products released were pastilles, gums, jellies, and chews (332 products), non-individually wrapped chocolate pieces' products (214 products), individually wrapped chocolate pieces (170 products), chocolate tablets (155 products) and gum (69 products).
The companies with the highest number of new product launches were Lotte Confectionery (138 products), followed by Orion Confectionery (71 products) and Emart/E-Mart (50 products). Top confectionery product claims were vitamin/mineral fortified (97 products), ethical-sustainable (habitat/resources) with 92 products, premium (91 products), ethical-human (89 products) and sugar free (86 products).
In terms of product launches, over half (52.3%) were categorized as new product launches (627 products), whereas 35.0% were new variety/range extension products (420 products) and 10.3% were new packaging products (123 products).
Top flavours were unflavoured/plain (209 products), strawberry (52 products), grape (37 products), peach (34 products) and almond with (31 products), while top ingredient new product launches included white sugar (996 products), glucose syrup (537 products), food acids (515 products), cocoa fat (490 products) and cocoa liquor (478 products). Top packaging types included flexible packaging (690 products), flexible stand-up pouch (188 products), carton (92 products), flexible sachet (87products) and jar (39 products).
| Product Attributes | Number of new products by year | Total | |||||
|---|---|---|---|---|---|---|---|
| 2018 | 2019 | 2020 | 2021 | 2022 | 2023 | ||
| Yearly product launches | 264 | 180 | 227 | 203 | 173 | 153 | 1,200 |
| Top sub-categories | |||||||
| Pastilles, gums, jellies and chews | 82 | 67 | 50 | 63 | 34 | 36 | 332 |
| Non-individually wrapped chocolate pieces | 36 | 37 | 51 | 30 | 28 | 32 | 214 |
| Individually wrapped chocolate pieces | 37 | 22 | 24 | 26 | 38 | 23 | 170 |
| Chocolate tablets | 40 | 22 | 36 | 19 | 23 | 15 | 155 |
| Gum | 14 | 15 | 13 | 16 | 5 | 6 | 69 |
| Chocolate countlines | 6 | 5 | 8 | 7 | 19 | 2 | 47 |
| Standard and power mints | 5 | 0 | 12 | 5 | 9 | 4 | 35 |
| Other sugar confectionery | 7 | 1 | 3 | 9 | 5 | 9 | 34 |
| Medicated confectionery | 3 | 3 | 8 | 7 | 3 | 8 | 32 |
| Boiled sweets | 7 | 3 | 7 | 7 | 3 | 5 | 32 |
| Top companies | |||||||
| Lotte Confectionery | 29 | 22 | 32 | 38 | 13 | 4 | 138 |
| Orion Confectionery | 15 | 8 | 15 | 15 | 9 | 9 | 71 |
| Emart/E-Mart | 14 | 19 | 10 | 3 | 4 | 0 | 50 |
| Lotte Shopping | 11 | 6 | 9 | 4 | 3 | 2 | 35 |
| Hershey | 8 | 3 | 5 | 8 | 7 | 4 | 35 |
| Top claims | |||||||
| Vitamin/mineral fortified | 11 | 24 | 22 | 18 | 12 | 10 | 97 |
| Ethical-sustainable (habitat/resources) | 10 | 7 | 15 | 12 | 24 | 24 | 92 |
| Premium | 6 | 11 | 23 | 22 | 13 | 16 | 91 |
| Ethical-human | 10 | 8 | 18 | 10 | 24 | 19 | 89 |
| Sugar free | 16 | 17 | 16 | 11 | 15 | 11 | 86 |
| Top product launches | |||||||
| New product | 145 | 105 | 131 | 92 | 81 | 73 | 627 |
| New variety/range extension | 90 | 57 | 74 | 77 | 70 | 52 | 420 |
| New packaging | 22 | 12 | 19 | 28 | 17 | 25 | 123 |
| Relaunch | 7 | 4 | 2 | 6 | 5 | 3 | 27 |
| New formulation | 0 | 2 | 1 | 0 | 0 | 0 | 3 |
| Top flavours (including blend) | |||||||
| Unflavoured/plain | 39 | 29 | 49 | 25 | 33 | 34 | 209 |
| Strawberry | 19 | 11 | 4 | 8 | 4 | 6 | 52 |
| Grape | 15 | 6 | 4 | 8 | 4 | 0 | 37 |
| Peach | 9 | 6 | 7 | 3 | 5 | 4 | 34 |
| Almond | 6 | 8 | 5 | 5 | 5 | 2 | 31 |
| Hazelnut | 6 | 4 | 9 | 6 | 5 | 1 | 31 |
| Orange/sweet orange | 13 | 5 | 2 | 2 | 3 | 3 | 28 |
| Lemon | 10 | 1 | 2 | 7 | 4 | 3 | 27 |
| Apple | 5 | 3 | 4 | 7 | 2 | 2 | 23 |
| Fruit | 10 | 0 | 5 | 3 | 1 | 1 | 20 |
| Top ingredients | |||||||
| White sugar | 228 | 139 | 189 | 161 | 147 | 132 | 996 |
| Glucose syrup | 125 | 79 | 101 | 91 | 65 | 76 | 537 |
| Food acids | 134 | 84 | 84 | 83 | 72 | 58 | 515 |
| Cocoa fat | 100 | 66 | 98 | 71 | 93 | 62 | 490 |
| Cocoa liquor | 92 | 62 | 104 | 72 | 90 | 58 | 478 |
| Artificial flavouring substance | 85 | 59 | 76 | 91 | 46 | 38 | 395 |
| Emulsifiers | 86 | 55 | 65 | 77 | 50 | 52 | 385 |
| Edible fats and oils | 61 | 59 | 44 | 76 | 48 | 42 | 330 |
| Whole milk powder | 71 | 35 | 53 | 53 | 66 | 51 | 329 |
| Citric acid | 79 | 51 | 45 | 46 | 40 | 37 | 298 |
| Top package types | |||||||
| Flexible | 136 | 96 | 114 | 118 | 125 | 101 | 690 |
| Flexible stand-up pouch | 48 | 31 | 32 | 40 | 18 | 19 | 188 |
| Carton | 23 | 13 | 31 | 13 | 6 | 6 | 92 |
| Flexible sachet | 29 | 28 | 13 | 10 | 3 | 4 | 87 |
| Jar | 8 | 4 | 3 | 11 | 6 | 7 | 39 |
| Unit pack size | |||||||
| 100.00 grams | 15 | 10 | 22 | 20 | 18 | 6 | 91 |
| 50.00 grams | 23 | 25 | 14 | 14 | 5 | 10 | 91 |
| 40.00 grams | 15 | 13 | 4 | 10 | 6 | 1 | 49 |
| 60.00 grams | 18 | 13 | 5 | 5 | 2 | 4 | 47 |
| 70.00 grams | 15 | 2 | 6 | 5 | 4 | 8 | 40 |
| Source: Mintel Global New Product Database (GNPD), 2024 | |||||||
| Sub-category | Number of products | Average price per product (in US dollars) |
|---|---|---|
| Pastilles, gums, jellies and chews | 332 | 2.48 |
| Non-individually wrapped chocolate pieces | 214 | 6.55 |
| Individually wrapped chocolate pieces | 170 | 6.74 |
| Chocolate tablets | 155 | 3.44 |
| Gum | 69 | 3.19 |
| Other | 260 | 4.63 |
| Total | 1,200 | 4.45 |
| Source: Mintel Global New Product Database (GNPD), 2024 | ||
Example of new products
Doctor Gummy Jelly
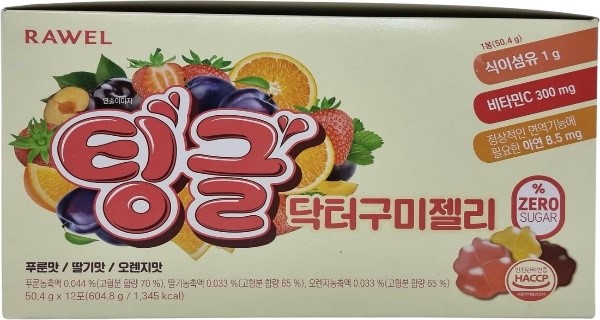
Source: Mintel Global New Product Database (GNPD), 2024
| Company | KBH (South Korea Beauty and Health) |
|---|---|
| Brand | Rawel Thingle |
| Category | Sugar and gum confectionery |
| Sub-category | Pastilles, gums, jellies and chews |
| Market | South Korea |
| Store type | Internet / mail order |
| Date published | December 2023 |
| Launch type | New product |
| Price in US dollars | 13.06 |
Rawel Thingle Doctor Gummy Jelly is now available, and retails in a 604.8 gram containing 12 50.4 gram unit. - Provides 1 gram dietary fibre, 300 milligrams vitamin C and 8.5 milligrams zinc, which is needed for normal immune function - Zero sugar - Contains prune flavour, strawberry flavour and orange flavour - Logos and certifications: HACCP.
Sunflower Seed Choco
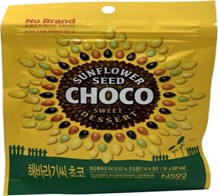
Source: Mintel Global New Product Database (GNPD), 2024
| Company | Emart / E-Mart |
|---|---|
| Brand | No Brand |
| Category | Chocolate confectionery |
| Sub-category | Non-individually wrapped chocolate pieces |
| Market | South Korea |
| Store type | Internet / mail order |
| Date published | November 2022 |
| Launch type | New variety / range extension |
| Price in US dollars | 0.88 |
No Brand Sunflower Seed Choco is now available, and retails in a 70 gram pack. - A colourful sweet dessert with chocolate balls and savoury sunflower seeds- Logos and certifications: HACCP.
World Cone Flavoured Mini Crunchy Chocolate Bar
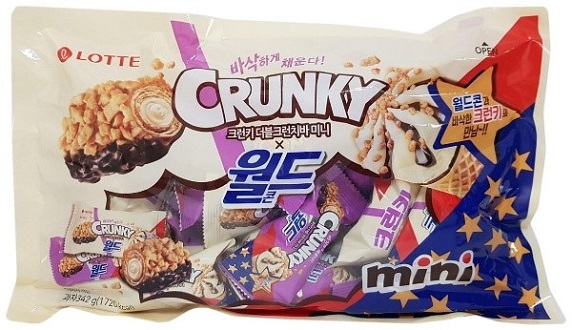
Source: Mintel Global New Product Database (GNPD), 2024
| Company | Lotte Confectionery |
|---|---|
| Brand | Lotte Crunky x World Cone |
| Category | Chocolate confectionery |
| Sub-category | Individually wrapped chocolate pieces |
| Market | South Korea |
| Store type | Internet / mail order |
| Date published | June 2021 |
| Launch type | New variety / range extension |
| Price in US dollars | 10.79 |
Lotte Crunky x World Cone World Cone Flavoured Mini Crunchy Chocolate Bar is now available. The product retails in a 342 gram pack bearing a QR code and the Facebook logo.
Milk Chocolate
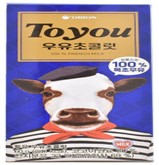
Source: Mintel Global New Product Database (GNPD), 2024
| Company | Orion Confectionery |
|---|---|
| Brand | Orion To You |
| Category | Chocolate confectionery |
| Sub-category | Chocolate tablets |
| Market | South Korea |
| Store type | Supermarket |
| Date published | January 2020 |
| Launch type | Relaunch |
| Price in US dollars | 1.01 |
Orion To You Milk Chocolate has been relaunched. The product is made with 100% grass-fed French milk and retails in a 60 gram pack bearing the HACCP logo.
Assorted Gums
Source: Mintel Global New Product Database (GNPD), 2024
| Company | Orion Confectionery |
|---|---|
| Brand | Orion The Xylitol |
| Category | Sugar and gum confectionery |
| Sub-category | Gum |
| Market | South Korea |
| Store type | Mass merchandise / hypermarket |
| Date published | August 2018 |
| Launch type | New packaging |
| Price in US dollars | 2.66 |
Orion The Xylitol Assorted Gums have been repackaged. The product comprises lemon, peach and apple flavour gums, and retails in a two 61 gram pack bearing the HACCP logo.
Opportunities for Canada
South Korea is a net importer of confectionery products. In 2023, South Korea's confectionery trade deficit was US$507.8 million as the country recorded imports of US$659.3 million, and exports of US$151.5 million. The country was the nineteenth largest global import market for confectionery in 2023 representing an increase in import growth of 3.3% from US$560.1 million in 2018. South Korea was the eighth largest export market for Canadian confectionery, with values of US$2.6 million in 2023, representing a decline in annual growth of 11.3% from US$4.8 million in 2018.
In terms of confectionery retail sales, South Korea attained US$1,250.4 million in 2023, representing a 0.6% market share in 2023. South Korea experienced a slight decline in annual growth of 0.3% as retail sales decreased from US$1,271.6 million in 2018; however, the country is expected to recover, increasing 3.3% annually to US$1,469.1 million by 2028.
Sugar confectionery is the largest category in confectionery in South Korea with retail sales valued at US$575.9 million in 2023, representing an increase in annual growth of 1.9% from retail sales of US$524.2 million in 2018. Chocolate confectionery was the second largest category of confectionery in South Korea with retail sales of US$535.0 million in 2023, declining 0.3% annually from retail sales of US$543.7 million in 2018. The chocolate confectionery category is expected to recover and attain annal growth of 2.4% as retail sales increase to US$602.2 million by 2028.
Confectionery in South Korea is a measurable sector in the global market. The South Korean confectionery market is developing alongside changes in consumer preferences and perceptions. Given the anticipated growth potential in the confectionery sector in South Korea, Canadian producers have an opportunity to expand their presence and exports within the South Korean confectionery market. That said, it is important for Canadian suppliers to work closely with their importing partners and Trade Commissioners to ensure that South Korea's import requirements for their specific products are met. It is also important to note and appreciate the value of commitment, and market development efforts needed to further access the South Korean market in relation to competitors who may yield a price competitiveness and freight advantage due to their proximity to South Korea.
The Canada-South Korea Free Trade Agreement (CKFTA) provides Canadian exporters preferential tariff treatment in the form of reduced tariffs, and access to one of the world's largest economies. As of January 1, 2024, 99.0% of Canada's exports are eligible for duty-free access into South Korea under the CKFTA.
The tariff treatment of a good exported to South Korea depends on its specific tariff classification as determined by the South Korea Customs Service. To benefit from tariff preferences in South Korea, Canadian exporters must ensure goods meet applicable rules of origin. The importer must have a valid certificate of origin in her or his possession at the time of importation (Global Affairs Canada; Trade-Trade and investment agreements, South Korea-New tariff preferences for Canadian exports to South Korea).
Canadian exporters may consult theCanada Tariff Finder to explore tariff information for the South Korean market under the CKFTA, and other foreign markets with which Canada has a free trade agreement. Tariff preferences for key Canadian processed food products exported to South Korea (Global Affairs Canada; Trade-Trade and investment agreements, South Korea-New tariff preferences for Canadian exports to South Korea)
Tariffs preferences for key Canadian processed food products exported to South Korea; tariffs were eliminated in 2019 for:
- Hard candies
- Chocolate and chocolate confectionary
- Chewing gum
- Sweet biscuits
- Sugar confectionary
For more information
The Canadian Trade Commissioner Service:
International Trade Commissioners can provide Canadian industry with on-the-ground expertise regarding market potential, current conditions and local business contacts, and are an excellent point of contact for export advice.
More agri-food market intelligence:
International agri-food market intelligence
Discover global agriculture and food opportunities, the complete library of Global Analysis reports, market trends and forecasts, and information on Canada's free trade agreements.
Agri-food market intelligence service
Canadian agri-food and seafood businesses can take advantage of a customized service of reports and analysis, and join our email subscription service to have the latest reports delivered directly to their inbox.
More on Canada's agriculture and agri-food sectors:
Canada's agriculture sectors
Information on the agriculture industry by sector. Data on international markets. Initiatives to support awareness of the industry in Canada. How the department engages with the industry.
For information on the upcoming trade show Seoul Food & Hotel (SFH), please contact:
Ben Berry, Deputy Director
Trade Show Strategy and Delivery
Agriculture and agri-food Canada
ben.berry@agr.gc.ca
Resources
- Euromonitor International, 2024
- Country Report; Economy, Finance and Trade: South Korea, May 20, 2024
- Country Report; Gum in South Korea, June 2023
- Country Report; PEST Analysis: South Korea, October 3, 2023
- Country Report; Sugar Confectionery in South Korea, June 2023
- Country Report; South Korea: Consumer Profile, May 31, 2023
- Global Affairs Canada; Trade-Trade and investment agreements, South Korea - Tariff preferences for Canadian exports to South Korea
- Global Trade Tracker, 2024
- Mintel; A year of innovation in chocolate confectionery, January 30, 2024
- Mintel; A year of innovation in sugar confectionery, January 30, 2024
- Mintel Global New Products Database, 2024
- Republic of Türkiye – Ministry of Trade; Sugar and Chocolate Confectionery (PDF), pages 1 and 2, 2022
Sector Trend Analysis – Confectionery trends in South Korea
Global Analysis Report
Prepared by: Laurie Bernardi, International Market Research Analyst
© His Majesty the King in Right of Canada, represented by the Minister of Agriculture and Agri-Food (2024).
Photo credits
All photographs reproduced in this publication are used by permission of the rights holders.
All images, unless otherwise noted, are copyright His Majesty the King in Right of Canada.
To join our distribution list or to suggest additional report topics or markets, please contact:
Agriculture and Agri-Food Canada, Global Analysis1341 Baseline Rd, Tower 5, 3rd floor
Ottawa ON K1A 0C5
Canada
Email: aafc.mas-sam.aac@agr.gc.ca
The Government of Canada has prepared this report based on primary and secondary sources of information. Although every effort has been made to ensure that the information is accurate, Agriculture and Agri-Food Canada (AAFC) assumes no liability for any actions taken based on the information contained herein.
Reproduction or redistribution of this document, in whole or in part, must include acknowledgement of agriculture and agri-food Canada as the owner of the copyright in the document, through a reference citing AAFC, the title of the document and the year. Where the reproduction or redistribution includes data from this document, it must also include an acknowledgement of the specific data source(s), as noted in this document.
Agriculture and Agri-Food Canada provides this document and other report services to agriculture and food industry clients free of charge.