

Note: This report includes forecasting data that is based on baseline historical data.
Executive summary
The top three suppliers of confectionery to the United States were Canada (US$2.5 billion, 548.2 kilotonnes), Mexico (US$1.7 billion, 569.5 kilotonnes) and Germany (US$455.2 million and 103.0 kilotonnes) in 2022.
Canada, being the top supplier of confectionery products to the United States, accounted for 36.3% of the total market share, followed by Mexico (24.6%) and Germany (6.7%) in 2022.
In 2022, top United States' confectionery products imported from Canada were chocolate and other cocoa preparations in blocks, slabs or bars weighing >2 kilograms (HS code 180620) valued at US$673.5 million (239.6 kilotonnes). followed by chocolate and other cocoa preparations in packings of ≤2 kilograms (HS Code 180690) valued at US$639.0 million (103.2 kilotonnes) and sugar confectionery not containing cocoa (HS code 170490) valued at US$489.7 million (118.3 kilotonnes). chocolate and other preparations containing cocoa, in blocks, slabs or bars of <= 2 kilograms (excluding filled) grew the most in value terms since 2018 at a compound annual growth rate (CAGR) of 12.1% between 2018 and 2022.
The United States was the largest export market for Canadian confectionery with a market share of (97.1%) valued at US$2.5 billion, followed by Mexico (1.2%) valued at US$30.1 million, and Australia (1.0%) valued at US$7.5 million in 2022.
Global retail sales of confectionery increased by a CAGR of 1.6% from US$187.1 billion in 2018 to US$199.6 billion in 2022 and is expected to continue to increase at a 5-year period growth of 5.2% to reach US$269.9 billion in 2028. The United States was the largest retail sale market for confectionery products at a value of US$44.8 billion,
Overall, retail sales of confectionery in United States increased by a CAGR of 6.7% from US$34.5 billion, (2,812.7 thousand tonnes) in 2018 to US$44.8 billion (2,981.2 thousand tonnes) in 2022.
Global trade overview of confectionery
The global import market for confectionery has experienced an increase in CAGR of 3.6% from US$39.5 billion in 2018 to US$44.2 billion in 2022. In 2022, Germany was the largest global importer of confectionery valued at US$6.6 billion, (1,339.4 kilotonnes), followed by Belgium with imports valued at US$4.1 billion (936.8 kiltonnes) and Italy with import values of US$2.9 billion (518.4 kiltonnes).
The Germany imported 14.9% of the total world market share for confectionery, representing an increased CAGR of 4.4% from a value of US$5.9 billion (1,172.3 kiltonnes) in 2018. Canada in comparison, was the 5th largest market for confectionery, accounting for 5.8% of the total world market share in 2022 at a value of US$2.6 billion, (569.2 kiltonnes); representing an increased CAGR of 3.9% (2018-2022) from imports valued at US$2.0 billion (522.6 kiltonnes) in 2018.
| Country | 2018 | 2019 | 2020 | 2021 | 2022 | CAGR* % 2018-2022 | Market share % 2022 |
|---|---|---|---|---|---|---|---|
| Total - world imports | 39,473.1 | 40,010.6 | 38,385.2 | 43,876.9 | 44,162.4 | 3.6 | 100.0 |
| Germany | 5,922.8 | 5,940.3 | 6,098.6 | 6,745.7 | 6,580.4 | 4.4 | 14.9 |
| Belgium | 3,815.1 | 3,805.8 | 3,694.0 | 4,518.9 | 4,147.8 | 5.8 | 9.4 |
| Italy | 2,524.5 | 2,544.4 | 2,467.5 | 2,920.3 | 2,891.5 | 5.0 | 6.5 |
| Poland | 2,085.2 | 2,169.0 | 2,375.8 | 2,648.6 | 2,686.5 | 8.3 | 6.1 |
| Canada | 2,016.1 | 2,081.9 | 2,059.7 | 2,260.8 | 2,581.2 | 3.9 | 5.8 |
| Netherlands | 2,424.5 | 2,347.4 | 2,162.9 | 2,391.3 | 2,442.7 | −0.5 | 5.5 |
| United States | 2,180.4 | 2,173.7 | 1,944.5 | 2,230.1 | 2,328.5 | 0.8 | 5.3 |
| Mexico | 1,409.9 | 1,543.0 | 1,461.6 | 1,654.2 | 1,989.6 | 5.5 | 4.5 |
| France | 1,774.1 | 1,677.6 | 1,546.2 | 1,719.6 | 1,815.8 | −1.0 | 4.1 |
| Spain | 1,034.0 | 1,100.7 | 1,108.0 | 1,286.5 | 1,440.2 | 7.6 | 3.3 |
|
Source: Global Trade Tracker, 2023 *CAGR: Compound Annual Growth Rate Note: For the purpose of this report, "confectionery" is defined by HS code 1704 (sugar confectionery, not containing cocoa, including white chocolate) and 1806 (chocolate and other food preparations containing cocoa). |
|||||||
| Country | 2018 | 2019 | 2020 | 2021 | 2022 | CAGR* % 2018-2022 | Market share % 2022 |
|---|---|---|---|---|---|---|---|
| Total - world imports | 8,919.6 | 9,250.0 | 8,950.4 | 9,753.3 | 10,069.2 | 3.1 | 100.0 |
| Germany | 1,172.3 | 1,217.3 | 1,250.9 | 1,318.5 | 1,339.4 | 3.4 | 13.3 |
| Belgium | 816.6 | 857.8 | 819.3 | 969.8 | 936.8 | 3.5 | 9.3 |
| Mexico | 538.7 | 558.5 | 531.6 | 588.5 | 644.9 | 4.6 | 6.4 |
| Netherlands | 577.1 | 582.9 | 529.7 | 555.6 | 583.2 | 0.3 | 5.8 |
| Canada | 522.6 | 525.9 | 525.8 | 550.1 | 569.2 | 2.2 | 5.7 |
| Poland | 402.7 | 433.8 | 475.9 | 498.9 | 540.4 | 7.6 | 5.4 |
| Italy | 387.3 | 409.4 | 398.3 | 452.2 | 518.4 | 7.6 | 5.1 |
| United States | 456.2 | 437.3 | 406.9 | 439.2 | 463.1 | 0.4 | 4.6 |
| France | 373.6 | 384.7 | 349.3 | 358.9 | 411.7 | 2.5 | 4.1 |
| Spain | 280.4 | 309.1 | 312.2 | 327.8 | 392.5 | 8.8 | 3.9 |
|
Source: Global Trade Tracker, 2023 *CAGR: Compound Annual Growth Rate |
|||||||
Confectionery market in the United States
The top three suppliers of confectionery to the United States were Canada (US$2.5 billion, 548.2 kiltonnes), Mexico (US$1.7 billion, 569.5 kiltonnes) and Germany (US$455.2 million and 103.0 kiltonnes) in 2022. Turkey registered the largest increase over the 5-year period (2018 to 2022) at a CAGR of 20.8%, followed by Spain (12.2%), and Poland (9.5%). Alternatively, China registered a negative CAGR of 8.4%, decreasing from a supply value of US$168.2 million in 2018 to US$166.2 million in 2022.
| Country | 2018 | 2019 | 2020 | 2021 | 2022 | CAGR* % 2018-2022 | Market share % 2022 |
|---|---|---|---|---|---|---|---|
| Total - world imports | 4,716.0 | 4,963.9 | 4,886.4 | 5,620.6 | 6,807.0 | 6.0 | 100 |
| Canada | 1,888.2 | 1,962.7 | 1,941.5 | 2,124.8 | 2,456.2 | 4.0 | 36.1 |
| Mexico | 1,144.9 | 1,263.4 | 1,255.9 | 1,383.9 | 1,668.7 | 6.5 | 24.5 |
| Germany | 292.9 | 289.9 | 316.4 | 374.8 | 455.2 | 8.6 | 6.7 |
| Turkey | 113.1 | 134.1 | 142.1 | 199.2 | 251.4 | 20.8 | 3.7 |
| Belgium | 156.6 | 169.9 | 141.6 | 187.0 | 213.1 | 6.1 | 3.1 |
| China | 168.2 | 126.8 | 92.1 | 129.5 | 166.2 | −8.4 | 2.4 |
| Spain | 101.9 | 118.8 | 133.8 | 143.9 | 165.7 | 12.2 | 2.4 |
| Switzerland | 125.6 | 119.8 | 113.7 | 105.5 | 163.6 | −5.7 | 2.4 |
| Poland | 81.4 | 74.1 | 77.6 | 107.0 | 149.3 | 9.5 | 2.2 |
| Italy | 74.6 | 85.6 | 81.1 | 96.9 | 144.6 | 9.1 | 2.1 |
|
Source: Global Trade Tracker, 2023 *CAGR: Compound Annual Growth Rate |
|||||||
| Country | 2018 | 2019 | 2020 | 2021 | 2022 | CAGR* % 2018-2022 | Market share % 2022 |
|---|---|---|---|---|---|---|---|
| Total - world imports | 1,341.8 | 1,393.1 | 1,386.0 | 1,521.2 | 1,677.9 | 5.7 | 100.0 |
| Mexico | 468.3 | 487.8 | 479.6 | 522.5 | 569.5 | 5.0 | 33.9 |
| Canada | 495.9 | 501.2 | 503.9 | 525.9 | 548.2 | 2.5 | 32.7 |
| Germany | 66.1 | 66.2 | 73.5 | 88.7 | 103.0 | 11.7 | 6.1 |
| Turkey | 43.0 | 54.6 | 55.4 | 76.4 | 84.7 | 18.5 | 5.0 |
| Spain | 40.2 | 48.7 | 53.7 | 48.0 | 55.3 | 8.3 | 3.3 |
| China | 39.4 | 31.0 | 25.3 | 31.1 | 36.6 | −1.8 | 2.2 |
| Belgium | 23.1 | 26.4 | 20.3 | 28.2 | 30.2 | 6.9 | 1.8 |
| Brazil | 15.1 | 19.2 | 20.7 | 27.4 | 29.2 | 17.9 | 1.7 |
| Italy | 11.5 | 14.2 | 13.0 | 14.7 | 22.2 | 17.9 | 1.3 |
| Switzerland | 16.2 | 16.0 | 16.8 | 12.8 | 20.1 | 5.5 | 1.2 |
|
Source: Global Trade Tracker, 2023 *CAGR: Compound Annual Growth Rate |
|||||||
In 2022, top imported confectionery products to the United States were sugar confectionery not containing cocoa (HS code 170490) valued at US$2.9 billion (865.9 kiltonnes), followed by chocolate and other cocoa preparations in packings of ≤2 kilograms (HS Code 180690) valued at US$1.7 billion (262.5 kiltonnes) and chocolate and other cocoa preparations in blocks, slabs or bars weighing >2 kilograms (HS code 180620) valued at US$944.3 million (298.4 kiltonnes).
| HS Code | Description | 2018 | 2019 | 2020 | 2021 | 2022 | CAGR* % 2018-2022 |
|---|---|---|---|---|---|---|---|
| Total - confectionery products | 4,689.1 | 4,937.5 | 4,878.0 | 5,604.7 | 6,773.2 | 9.6 | |
| 170490 | sugar confectionery; (excluding chewing gum, including white chocolate), not containing cocoa | 1,848.1 | 1,888.9 | 1,905.7 | 2,286.2 | 2,851.6 | 11.5 |
| 180690 | chocolate and other preparations containing cocoa, in containers or immediate packings of <= 2 kilograms (excluding in blocks, slabs or bars and cocoa powder) | 1,154.7 | 1,241.5 | 1,238.5 | 1,378.6 | 1,652.4 | 9.4 |
| 180620 | chocolate and other food preparations containing cocoa, in blocks, slabs or bars weighing > 2 kilograms or in liquid, paste, powder, granular or other bulk form, in containers or immediate packings of a content > 2 kilograms (excluding cocoa powder) | 728.7 | 854.1 | 826.9 | 846.9 | 944.3 | 6.7 |
| 180632 | chocolate and other food preparations containing cocoa; in blocks, slabs or bars, (not filled), weighing 2 kilograms or less | 496.3 | 499.6 | 501.8 | 604.2 | 690.2 | 8.6 |
| 180631 | chocolate and other food preparations containing cocoa; in blocks, slabs or bars, filled, weighing 2 kilograms or less | 295.6 | 289.7 | 275.9 | 339.5 | 470.4 | 12.3 |
| 170410 | sugar confectionery; chewing gum, whether or not sugar-coated, not containing cocoa | 119.5 | 118.0 | 94.7 | 108.5 | 123.6 | 0.9 |
| 180610 | cocoa; powder, containing added sugar or other sweetening matter | 46.2 | 45.7 | 34.5 | 40.8 | 40.7 | −3.1 |
|
Source: Global Trade Tracker, 2023 *CAGR: Compound Annual Growth Rate |
|||||||
| HS Code | Description | 2018 | 2019 | 2020 | 2021 | 2022 | CAGR* % 2018-2022 |
|---|---|---|---|---|---|---|---|
| Total - confectionery products | 1,339.1 | 1,390.1 | 1,385.5 | 1,519.6 | 1,675.2 | 5.8 | |
| 170490 | sugar confectionery; (excluding chewing gum, including white chocolate), not containing cocoa | 645.9 | 666.9 | 673.4 | 765.3 | 865.9 | 7.6 |
| 180620 | chocolate and other food preparations containing cocoa, in blocks, slabs or bars weighing > 2 kilograms or in liquid, paste, powder, granular or other bulk form, in containers or immediate packings of a content > 2 kilograms (excluding cocoa powder) | 254.3 | 278.8 | 280.3 | 286.3 | 298.4 | 4.1 |
| 180690 | chocolate and other preparations containing cocoa, in containers or immediate packings of <= 2 kilograms (excluding in blocks, slabs or bars and cocoa powder) | 209.2 | 222.1 | 232.6 | 238.7 | 262.5 | 5.8 |
| 180632 | chocolate and other food preparations containing cocoa; in blocks, slabs or bars, (not filled), weighing 2 kilograms or less | 77.8 | 77.3 | 79.3 | 93.6 | 103.2 | 7.3 |
| 180610 | cocoa; powder, containing added sugar or other sweetening matter | 68.7 | 68.2 | 54.4 | 57.0 | 53.8 | −5.9 |
| 180631 | chocolate and other food preparations containing cocoa; in blocks, slabs or bars, filled, weighing 2 kilograms or less | 48.9 | 42.4 | 37.8 | 46.4 | 58.4 | 4.5 |
| 170410 | sugar confectionery; chewing gum, whether or not sugar-coated, not containing cocoa | 34.3 | 34.4 | 27.7 | 32.3 | 58.4 | −1.0 |
|
Source: Global Trade Tracker, 2023 *CAGR: Compound Annual Growth Rate |
|||||||
Canada, being the top supplier of confectionery products to the United States, accounted for 36.3% of the total market share, followed by Mexico (24.6%) and Germany (6.7%) in 2022. Canada was the United States' top supplier for all chocolate and other cocoa confectionery preparations (HS codes:180690, 180620, 180632, 180631), along with chewing gum products (HS code 170410) over the year. Meanwhile, Mexico was the top supplier of sugar confectionery products not containing cocoa (including white chocolate) and sweetened cocoa powder.
| HS code | Description | Import value (US$M) | Import volume (KT*) | Top suppliers and market share (%) | ||
|---|---|---|---|---|---|---|
| 1 | 2 | 3 | ||||
| Total - confectionery products | 6,773.2 | 1,675.2 | Canada: 36.3 | Mexico: 24.6 | Germany: 6.7 | |
| 170490 | Sugar confectionery not containing cocoa, including white chocolate (excluding chewing gum) | 2,851.6 | 865.9 | Mexico: 36.0 | Canada: 17.3 | Germany: 9.8 |
| 180690 | Chocolate and other cocoa preparations, in packings of ≤2 kilograms (excluding in blocks, slabs or bars and cocoa powder) | 1,652.4 | 262.5 | Canada: 38.7 | Mexico: 21.8 | Poland: 7.7 |
|
180620 |
Chocolate and other cocoa preparations, in blocks, slabs or bars weighing >2 kilograms or in liquid, paste, powder, granular or other bulk form, in packings of a content >2 kilograms (excluding cocoa powder) | 944.3 | 298.4 | Canada: 71.3 | Belgium: 6.7 | Mexico: 5.8 |
| 180632 | Chocolate and other preparations containing cocoa, in blocks, slabs or bars of ≤2 kilograms (excluding filled) | 690.2 | 103.2 | Canada: 40.8 | Mexico: 18.6 | Belgium: 7.6 |
| 180631 | Chocolate and other preparations containing cocoa, in blocks, slabs or bars of ≤2 kilograms, filled | 470.4 | 58.4 | Canada: 63.5 | Germany: 10.9 | Croatia: 6.5 |
| 170410 | Chewing gum, whether or not sugar-coated | 123.6 | 58.4 | Canada: 59.2 | Mexico: 26.0 | China: 5.1 |
| 180610 | Cocoa powder, sweetened | 40.7 | 53.8 | Mexico: 89.4 | Canada: 1.7 | South Africa: 1.7 |
|
Source: Global Trade Tracker, 2023 *KT: Kilotonnes |
||||||
Canada's performance
In 2022, top United States' confectionery products imported from Canada were chocolate and other cocoa preparations in blocks, slabs or bars weighing >2 kilograms (HS code 180620) valued at US$673.5 million (239.6 kiltonnes). followed by chocolate and other cocoa preparations in packings of ≤2 kilograms (HS Code 180690) valued at US$639.0 million (103.2 kiltonnes) and sugar confectionery not containing cocoa (HS code 170490) valued at US$489.7 million (118.3 kiltonnes). Chocolate and other preparations containing cocoa, in blocks, slabs or bars of <= 2 kilograms (excluding filled) grew the most in value terms since 2018 at a CAGR of 12.1%; while sweetened cocoa powder decreased by a CAGR of 25.7% between 2018 and 2022.
As reported by the United States, Canada had a supply gap for confectionery products of (US$4.4 billion) with total American imports of US$6.8 billion from the world compared to imports from Canada of US$2.5 billion in 2022.
| HS Code | Description | 2018 | 2019 | 2020 | 2021 | 2022 | CAGR* % 2018-2022 |
|---|---|---|---|---|---|---|---|
| Total - confectionery products | 1,888.2 | 1,962.6 | 1,941.5 | 2,124.9 | 2,456.3 | 6.8 | |
| 180620 | chocolate and other food preparations containing cocoa, in blocks, slabs or bars weighing > 2 kilograms or in liquid, paste, powder, granular or other bulk form, in containers or immediate packings of a content > 2 kilograms (excluding cocoa powder) | 519.4 | 552.4 | 590.2 | 604.7 | 673.5 | 6.7 |
| 180690 | chocolate and other preparations containing cocoa, in containers or immediate packings of <= 2 kilograms (excluding in blocks, slabs or bars and cocoa powder) | 490.6 | 543.4 | 522.4 | 566.3 | 639.0 | 6.8 |
| 170490 | sugar confectionery not containing cocoa, including white chocolate (excluding chewing gum) | 439.9 | 393.1 | 375.8 | 405.4 | 489.7 | 2.7 |
| 180632 | chocolate and other preparations containing cocoa, in blocks, slabs or bars of <= 2 kilograms (excluding filled) | 178.3 | 200.9 | 205.7 | 252.7 | 281.5 | 12.1 |
| 180631 | chocolate and other preparations containing cocoa, in blocks, slabs or bars of <= 2 kilograms, filled | 197.5 | 211.3 | 196.0 | 232.7 | 298.7 | 10.9 |
| 170410 | chewing gum, whether or not sugar-coated | 60.2 | 59.7 | 50.0 | 61.8 | 73.2 | 5.0 |
| 180610 | cocoa powder, sweetened | 2.3 | 1.8 | 1.4 | 1.3 | 0.7 | −25.7 |
|
Source: Global Trade Tracker, 2023 *CAGR: Compound Annual Growth Rate |
|||||||
| HS Code | Description | 2018 | 2019 | 2020 | 2021 | 2022 | CAGR* % 2018-2022 |
|---|---|---|---|---|---|---|---|
| Total - confectionery products | 495.8 | 501.2 | 503.9 | 526.0 | 548.3 | 2.5 | |
| 180620 | chocolate and other food preparations containing cocoa, in blocks, slabs or bars weighing > 2 kilograms or in liquid, paste, powder, granular or other bulk form, in containers or immediate packings of a content > 2 kilograms (excluding cocoa powder) | 209.4 | 216.2 | 228.7 | 234.9 | 239.6 | 3.4 |
| 170490 | sugar confectionery not containing cocoa, including white chocolate (excluding chewing gum) | 123.2 | 115.8 | 113.7 | 110.4 | 118.3 | −1.0 |
| 180690 | chocolate and other preparations containing cocoa, in containers or immediate packings of <= 2 kilograms (excluding in blocks, slabs or bars and cocoa powder) | 87.5 | 93.5 | 94.6 | 98.0 | 103.2 | 4.2 |
| 180631 | chocolate and other preparations containing cocoa, in blocks, slabs or bars of <= 2 kilograms, filled | 29.8 | 28.6 | 24.8 | 31.5 | 36.0 | 4.8 |
| 180632 | chocolate and other preparations containing cocoa, in blocks, slabs or bars of <= 2 kilograms (excluding filled) | 22.1 | 24.3 | 23.8 | 29.0 | 28.9 | 6.9 |
| 170410 | chewing gum, whether or not sugar-coated | 21.2 | 20.8 | 16.5 | 20.5 | 21.4 | 0.2 |
| 180610 | cocoa powder, sweetened | 2.6 | 2.0 | 1.8 | 1.7 | 0.9 | −23.3 |
|
Source: Global Trade Tracker, 2023 *CAGR: Compound Annual Growth Rate |
|||||||
| Category | 2017 | 2018 | 2019 | 2020 | 2021 | CAGR* % 2017-2021 |
|---|---|---|---|---|---|---|
| United States - imports from the World | 4,716.0 | 4,963.9 | 4,886.4 | 5,620.6 | 6,807.0 | 6.0 |
| United States[1] - imports from Canada | 1,888.2 | 1,962.7 | 1,941.5 | 2,124.8 | 2,456.2 | 4.0 |
| Supply gap | 2,827.80 | 3,001.20 | 2,944.90 | 3,495.80 | 4,350.80 | 11.4 |
|
Source: Global Trade Tracker, 2023 *CAGR: Compound Annual Growth Rate 1: As reported by the United States |
||||||
Canada's confectionery global export market
In 2022, Canada exported US$2.6 billion of confectionery to global markets, representing an increased CAGR of 6.7% from exports valued at US$2.0 billion in 2018. The United States was the largest export market for Canadian confectionery with a market share of (97.1%) valued at US$2.5 billion, followed by Mexico (1.2%) valued at US$30.1 million, and Australia (1.0%) valued at US$7.5 million in 2022.
Several of the top ten suppliers to Canada have registered significantly positive CAGRs between 2018 and 2022, namely being Chile (21.2%), United Kingdom (12.4%), and Mexico (7.2%). Alternatively, markets reporting negative supply growths to Canada were Japan, Saudi Arabia, Hong Kong and South Korea.
| Country | 2018 | 2019 | 2020 | 2021 | 2022 | CAGR* % 2018-2022 | Market share % 2022 |
|---|---|---|---|---|---|---|---|
| Total - world exports | 1,975.8 | 2,074.1 | 2,047.8 | 2,250.7 | 2,557.8 | 6.7 | 100 |
| United States | 1,908.0 | 1,974.1 | 1,943.1 | 2,134.5 | 2,484.2 | 6.8 | 97.1 |
| Mexico | 22.8 | 52.9 | 63.7 | 69.1 | 30.1 | 7.2 | 1.2 |
| Australia | 7.2 | 10.1 | 9.5 | 11.0 | 7.5 | 1.0 | 0.3 |
| United Kingdom | 3.7 | 4.2 | 4.8 | 6.4 | 5.9 | 12.4 | 0.2 |
| Chile | 1.9 | 2.1 | 2.5 | 5.6 | 4.1 | 21.2 | 0.2 |
| China | 2.5 | 2.4 | 2.8 | 4.1 | 3.1 | 5.5 | 0.1 |
| Japan | 4.7 | 6.2 | 4.3 | 3.0 | 2.6 | −13.8 | 0.1 |
| Hong Kong | 3.0 | 2.2 | 2.3 | 2.8 | 2.8 | −1.7 | 0.1 |
| South Korea | 4.8 | 4.7 | 3.6 | 2.1 | 4.5 | −1.6 | 0.2 |
| Saudi Arabia | 1.1 | 0.6 | 1.2 | 2.0 | 0.8 | −7.7 | 0.03 |
|
Source: Global Trade Tracker, 2023 1: As reported by Canada *CAGR: Compound Annual Growth Rate |
|||||||
Global retail sales of confectionery
Global retail sales of confectionery increased by a CAGR of 1.6% from US$187.1 billion in 2018 to US$199.6 billion in 2022 and is expected to continue to increase at a 5-year period growth of 5.2% to reach US$269.9 billion in 2028. The United States was the largest retail sale market for confectionery products at a value of US$44.8 billion, followed by Russia at US$11.3 billion, and United Kingdom valued at US$11.0 billion in 2022.
In 2022, Canada was the 10th largest global confectionery market at a retail sales value of US$4.2 billion and a CAGR of 4.4% (2018 to 2022), which is expected to reach US$6.1 billion increasing by a CAGR of 6.6% (2022 to 2028).
| Country | 2018 | 2022 | CAGR* % 2018-2022 | 2023 | 2028 | CAGR* % 2022-2028 |
|---|---|---|---|---|---|---|
| Total - world | 187,159.0 | 199,566.5 | 1.6 | 211,045.9 | 269,852.0 | 5.2 |
| United States | 34,547.3 | 44,828.8 | 6.7 | 48,843.6 | 61,135.7 | 5.3 |
| Russia | 9,204.5 | 11,259.3 | 5.2 | 11,773.7 | 15,241.5 | 5.2 |
| United Kingdom | 11,313.9 | 11,021.0 | −0.7 | 11,249.7 | 14,479.4 | 4.7 |
| Germany | 12,253.1 | 12,387.2 | 0.3 | 12,453.0 | 14,420.9 | 2.6 |
| China | 14,744.2 | 12,800.3 | −3.5 | 12,832.1 | 14,249.6 | 1.8 |
| Brazil | 7,720.6 | 6,325.4 | −4.9 | 7,209.3 | 11,358.8 | 10.2 |
| Japan | 10,433.7 | 8,334.3 | −5.5 | 8,658.0 | 10,752.2 | 4.3 |
| France | 7,178.8 | 6,978.3 | −0.7 | 7,279.7 | 8,282.3 | 2.9 |
| Mexico | 3,911.8 | 4,760.0 | 5.0 | 5,347.8 | 6,952.0 | 6.5 |
| Canada | 3,507.5 | 4,164.5 | 4.4 | 4,454.0 | 6,109.1 | 6.6 |
|
Source: Euromonitor International, 2023 *CAGR: Compound Annual Growth Rate. Base year for growth rate is 2021, which is actual retail value sales. Note: For the purpose of this report, retail sales of confectionery consist of chocolate confectionery, gum and sugar confectionery |
||||||
Retail sales of confectionery in the United States
Overall, retail sales of confectionery in United States increased by a CAGR of 6.7% from US$34.5 billion, (2,812.7 thousand tonnes) in 2018 to US$44.8 billion (2,982.4 thousand tonnes) in 2022. Between 2022 and 2028, gum products registered negative value growth by a CAGR of 1.3% and a volume decline of 5.4%.
During the forecast period of 2022 (actual base year) to 2028, confectionery retail sales are expected to continue to increase in value by a CAGR of 1.5% from US$48.8 billion (3,092.2 thousand tonnes) in 2023 to US$61.1 billion (3,387.9 thousand tonnes) in 2028. Sugar confectionery is expected to register the highest growth, followed by chocolate confectionery, and behind by gum products in value (2022-2028).
| Category | 2018 | 2019 | 2020 | 2021 | 2022 |
|---|---|---|---|---|---|
| Total - confectionery in US$ million | 34,547.3 | 35,593.8 | 35,663.2 | 39,476.5 | 44,828.8 |
| Chocolate confectionery | 19,141.1 | 19,650.7 | 20,352.2 | 22,309.8 | 24,537.4 |
| Gum | 3,522.9 | 3,598.7 | 2,820.8 | 2,910.0 | 3,337.4 |
| Sugar confectionery | 11,883.3 | 12,344.5 | 12,490.2 | 14,256.8 | 16,954.1 |
| Volume sales in '000 tonnes | |||||
| Total - confectionery | 2,812.7 | 2,835.3 | 2,819.7 | 2,981.2 | 2,982.4 |
| Chocolate confectionery | 1,390.7 | 1,395.0 | 1,411.5 | 1,470.9 | 1,431.5 |
| Gum | 154.1 | 151.3 | 117.3 | 119.7 | 123.5 |
| Sugar confectionery | 1,267.9 | 1,289.0 | 1,291.0 | 1,390.6 | 1,427.4 |
|
Source: Euromonitor International, 2023 *CAGR: Compound Annual Growth Rate |
|||||
| Category | CAGR* % 2018-2022 | Annual growth % 2022/2021 | Total growth % 2018-2022 |
|---|---|---|---|
| Value sales in US$ millions, fixed 2022 exchange rate | |||
| Total - confectionery | 6.7 | 13.6 | 29.8 |
| Chocolate confectionery | 6.4 | 10.0 | 28.2 |
| Gum | −1.3 | 14.7 | −5.3 |
| Sugar confectionery | 9.3 | 18.9 | 42.7 |
| Volume sales in '000 tonnes | |||
| Total - confectionery | 1.5 | 0.0 | 6.0 |
| Chocolate confectionery | 0.7 | −2.7 | 2.9 |
| Gum | −5.4 | 3.2 | −19.9 |
| Sugar confectionery | 3.0 | 2.6 | 12.6 |
|
Source: Euromonitor International, 2023 *CAGR: Compound Annual Growth |
|||
| Category | 2022 | 2023 | 2024 | 2025 | 2026 | 2027 | 2028 |
|---|---|---|---|---|---|---|---|
| Value sales in US$ millions, fixed 2022 exchange rate | |||||||
| Total - confectionery | 44,828.8 | 48,843.6 | 51,847.4 | 54,395.9 | 56,671.4 | 59,007.6 | 61,135.7 |
| Chocolate confectionery | 24,537.4 | 25,954.8 | 27,690.1 | 29,326.8 | 30,809.0 | 32,374.6 | 33,786.7 |
| Gum | 3,337.4 | 3,675.1 | 3,826.9 | 4,000.8 | 4,175.3 | 4,359.9 | 4,567.4 |
| Sugar confectionery | 16,954.1 | 19,213.8 | 20,330.4 | 21,068.3 | 21,687.2 | 22,273.2 | 22,781.7 |
| Volume sales in '000 tonnes | |||||||
| Total - confectionery | 2,982.4 | 3,092.2 | 3,170.4 | 3,228.5 | 3,281.3 | 3,336.9 | 3,387.9 |
| Chocolate confectionery | 1,431.5 | 1,458.0 | 1,491.3 | 1,525.3 | 1,562.2 | 1,599.7 | 1,639.3 |
| Gum | 123.5 | 128.9 | 131.6 | 134.4 | 136.8 | 139.1 | 141.1 |
| Sugar confectionery | 1,427.4 | 1,505.4 | 1,547.4 | 1,568.9 | 1,582.2 | 1,598.1 | 1,607.5 |
|
Source: Euromonitor International, 2023 *CAGR: Compound Annual Growth Rate |
|||||||
| Category | CAGR* % 2022-2028 | Annual growth %2023/2022 | Total growth % 2022-2028 |
|---|---|---|---|
| Value sales in US$ millions, fixed 2022 exchange rate | |||
| Total - confectionery | 1.5 | 0.04 | 6.0 |
| Chocolate confectionery | 0.7 | −2.7 | 2.9 |
| Gum | −5.4 | 3.2 | −19.9 |
| Sugar confectionery | 3.0 | 2.6 | 12.6 |
| Volume sales in '000 tonnes | |||
| Total - confectionery | 2.1 | 3.7 | 13.6 |
| Chocolate confectionery | 2.3 | 1.9 | 14.5 |
| Gum | 2.2 | 4.4 | 14.3 |
| Sugar confectionery | 2.0 | 5.5 | 12.6 |
|
Source: Euromonitor International, 2023 *CAGR: Compound Annual Growth |
|||
Competitive landscape
In 2022, the top three confectionery companies in the United States, controlling 57.3% of the total retail market share were Mars Inc at 24.4%, Hershey Co at 24.0%, and Ferrero & related parties at 8.9%. Private label companies represented a 2.5% market share at a value of US$1.1 billion in 2022.
| Company | 2018 | 2919 | 2020 | 2021 | 2022 | CAGR* % 2018-2022 | Market share % 2022 |
|---|---|---|---|---|---|---|---|
| Mars Inc | 8,718.1 | 8,923.6 | 8,385.5 | 9,253.4 | 10,960.6 | 5.9 | 24.4 |
| Hershey Co, The | 8,033.4 | 8,408.2 | 8,796.6 | 9,724.6 | 10,751.8 | 7.6 | 24.0 |
| Ferrero & related parties | 2,608.5 | 2,794.4 | 2,978.0 | 3,426.0 | 3,997.0 | 11.3 | 8.9 |
| Mondelez International Inc | 2,013.8 | 1,981.2 | 1,774.9 | 1,820.0 | 2,065.7 | 0.6 | 4.6 |
| Chocoladefabriken Lindt & Sprüngli AG | 1,549.5 | 1,621.6 | 1,433.4 | 1,577.2 | 1,774.3 | 3.4 | 4.0 |
| Perfetti Van Melle Group | 809.5 | 842.8 | 807.5 | 922.4 | 1,025.3 | 6.1 | 2.3 |
| Nestlé SA | 855.0 | 835.8 | 827.2 | 830.0 | 869.5 | 0.4 | 1.9 |
| Tootsie Roll Industries Inc | 516.5 | 527.2 | 460.9 | 566.4 | 644.2 | 5.7 | 1.4 |
| Pladis Ltd | 411.3 | 391.6 | 401.7 | 496.6 | 605.9 | 10.2 | 1.4 |
| Haribo GmbH & Co kilograms | 349.2 | 401.4 | 461.7 | 551.9 | 604.4 | 14.7 | 1.3 |
| Private Label | 922.7 | 940.1 | 969.5 | 1,069.2 | 1,112.8 | 4.8 | 2.5 |
| Others | 5,745.7 | 5,842.7 | 6,285.6 | 6,993.5 | 7,953.4 | 8.5 | 17.7 |
| Total | 34,547.3 | 35,593.8 | 35,663.2 | 39,476.5 | 44,828.8 | 6.7 | 100.0 |
|
Source: Euromonitor International, 2023 *CAGR: Compound Annual Growth |
|||||||
Market segmentation
Chocolate confectionery
In the United States, chocolate confectionery was the largest category of confectionery with retail sales valued at US$24.5 billion, representing an increase of 6.4% in CAGR from retail sales of US$19.1 billion in 2018. The chocolate confectionery category is expected to continue to grow by a CAGR of 5.5% to reach sales of US$33.8 billion by 2028.
Top chocolate confectionery products were chocolate countlines, chocolate pouches and bags, and seasonal chocolate types in 2022. Chocolate products sold with toys registered the highest growth by a CAGR of 14.4%, while all other chocolate confectionery sub-categories had moderate growth over the historic period (2018 to 2022). All chocolate sales did well over last year (2022/2021), and are forecast to experience total growth between 19.8% and 53.6% (2022-2028).
| Category | 2018 | 2019 | 2020 | 2021 | 2022 |
|---|---|---|---|---|---|
| Total - chocolate confectionery | 19,141.1 | 19,650.7 | 20,352.2 | 22,309.8 | 24,537.4 |
| Chocolate pouches and bags | 4,506.5 | 4,573.3 | 4,849.1 | 5,377.7 | 6,102.0 |
| Boxed assortments | 2,067.1 | 2,052.7 | 2,029.5 | 2,352.4 | 2,653.6 |
| Chocolate with toys | 179.8 | 268.9 | 339.4 | 368.9 | 308.4 |
| Countlines[1] | 6,367.3 | 6,468.7 | 6,797.0 | 7,288.6 | 8,113.4 |
| Seasonal chocolate | 2,994.5 | 3,174.7 | 3,132.6 | 3,552.9 | 3,805.1 |
| Tablets[2] | 3,025.9 | 3,112.4 | 3,204.6 | 3,369.3 | 3,554.9 |
|
Source: Euromonitor International, 2023 1: chocolate bars eaten as snacks; many are filled and unsegmented, not pre-cut into smaller pieces/segments 2: molded and segmented chocolate bars in a wide range of sizes ranging from bite-size to family bars |
|||||
| Category | CAGR* % 2018-2022 | Annual growth % 2022/2021 | Total growth % 2018-2022 |
|---|---|---|---|
| Total - chocolate confectionery | 6.4 | 10.0 | 28.2 |
| Chocolate pouches and bags | 7.9 | 13.5 | 35.4 |
| Boxed assortments | 6.4 | 12.8 | 28.4 |
| Chocolate with toys | 14.4 | −16.4 | 71.5 |
| Countlines | 6.2 | 11.3 | 27.4 |
| Seasonal chocolate | 6.2 | 7.1 | 27.1 |
| Tablets | 4.1 | 5.5 | 17.5 |
|
Source: Euromonitor International, 2023 *CAGR: Compound Annual Growth |
|||
| Category | 2022 | 2023 | 2024 | 2025 | 2026 | 2027 | 2028 |
|---|---|---|---|---|---|---|---|
| Total - chocolate confectionery | 24,537.4 | 25,954.8 | 27,690.1 | 29,326.8 | 30,809.0 | 32,374.6 | 33,786.7 |
| Chocolate pouches and bags | 6,102.0 | 6,785.4 | 7,312.6 | 7,721.4 | 8,115.2 | 8,550.2 | 9,058.9 |
| Boxed assortments | 2,653.6 | 2,810.0 | 3,053.9 | 3,336.1 | 3,593.3 | 3,861.0 | 4,077.2 |
| Chocolate with toys | 308.4 | 289.5 | 294.3 | 309.1 | 325.2 | 346.0 | 369.6 |
| Countlines | 8,113.4 | 8,490.5 | 8,980.3 | 9,426.7 | 9,805.6 | 10,365.5 | 10,891.1 |
| Seasonal chocolate | 3,805.1 | 3,901.6 | 4,182.5 | 4,490.3 | 4,769.6 | 4,945.2 | 5,029.7 |
| Tablets | 3,554.9 | 3,677.8 | 3,866.5 | 4,043.2 | 4,200.0 | 4,306.7 | 4,360.1 |
| Source: Euromonitor International, 2023 | |||||||
| Category | CAGR* % 2018-2022 | Annual growth % 2023/2022 | Total growth % 2022-2028 |
|---|---|---|---|
| Total - chocolate confectionery | 5.5 | 5.8 | 37.7 |
| Chocolate pouches and bags | 6.8 | 11.2 | 48.5 |
| Boxed assortments | 7.4 | 5.9 | 53.6 |
| Chocolate with toys | 3.1 | −6.1 | 19.8 |
| Countlines | 5.0 | 4.6 | 34.2 |
| Seasonal chocolate | 4.8 | 2.5 | 32.2 |
| Tablets | 3.5 | 3.5 | 22.7 |
|
Source: Euromonitor International, 2023 *CAGR: Compound Annual Growth |
|||
United States' top five chocolate confectionery companies, representing a total market share of 83.8% (US$20.6 billion) were The Hershey Company, Mars Inc., Ferrero & related parties, Chocoladefabriken Lindt & Sprüngli AG, and Nestlé SA in 2022. Private label companies represented a 2.0% market share at a value of US$478.9 million over the last year.
| Company | 2018 | 2019 |
2020 |
2021 |
2022 |
CAGR* % 2018-2022 | Market share % 2022 |
|---|---|---|---|---|---|---|---|
| Hershey Co, The | 6,210.3 | 6,532.7 | 7,122.0 | 7,885.5 | 8,711.4 | 8.8 | 35.5 |
| Mars Inc | 5,360.4 | 5,451.0 | 5,446.5 | 6,035.2 | 7,262.1 | 7.9 | 29.6 |
| Ferrero & related parties | 1,120.6 | 1,276.1 | 1,417.7 | 1,653.8 | 1,971.3 | 15.2 | 8.0 |
| Chocoladefabriken Lindt & Sprüngli AG | 1,549.5 | 1,621.6 | 1,433.4 | 1,577.2 | 1,774.3 | 3.4 | 7.2 |
| Nestlé SA | 855.0 | 835.8 | 827.2 | 830.0 | 869.5 | 0.4 | 3.5 |
| Private Label | 297.9 | 323.7 | 361.7 | 422.4 | 478.9 | 12.6 | 2.0 |
| Others | 2,492.4 | 2,345.7 | 2,474.4 | 2,506.1 | 1,911.5 | −6.4 | 7.8 |
| Total | 19,141.1 | 19,650.7 | 20,352.2 | 22,309.8 | 24,537.4 | 6.4 | 100.0 |
|
Source: Euromonitor International, 2023 *CAGR: Compound Annual Growth |
|||||||
Sugar confectionery
In 2022, sugar confectionery was the 2nd largest confectionery category in the United States with retail sales valued at US$16.9 billion, representing an increased CAGR of 9.3% from retail sales of US$11.9 billion in 2018. The sugar confectionery category is expected to continue to grow by a CAGR of 5.0% to reach sales of US$22.8 billion by 2028.
Top sugar confectionery products were pastilles, gummies, jellies and chews in 2022 and registered the highest growth by a CAGR of 9.6%, while power mints sugar confectionery sub-categories had negative growth over the historic period by 3.6% (2018-2022). All sugar confectionery did well over last year (2022/2021), and are forecast to experience total growth between 12.8% and 48.7% (2022-2028).
| Category | 2018 | 2019 | 2020 | 2021 | 2022 |
|---|---|---|---|---|---|
| Total - Sugar confectionery | 11,883.3 | 12,344.5 | 12,490.2 | 14,256.8 | 16,954.1 |
| Boiled sweets[1] | 455.5 | 459.4 | 428.9 | 486.6 | 530.6 |
| Liquorice | 169.1 | 174.3 | 184.6 | 191.7 | 210.7 |
| Lollipops | 686.9 | 700.3 | 645.0 | 739.2 | 921.4 |
| Medicated confectionery[2] | 854.0 | 877.3 | 784.5 | 844.6 | 1,221.8 |
| Mints | 1,403.2 | 1,425.0 | 1,175.8 | 1,273.6 | 1,419.0 |
| Power mints | 534.2 | 543.0 | 408.5 | 428.2 | 460.4 |
| Standard mints | 869.0 | 882.1 | 767.3 | 845.4 | 958.7 |
| Pastilles, gummies, jellies and chews | 5,516.6 | 5,742.1 | 6,102.2 | 7,044.6 | 7,960.4 |
| Toffees, caramels and nougat | 325.8 | 331.5 | 354.0 | 383.9 | 426.1 |
| Other sugar confectionery[3] | 2,472.2 | 2,634.6 | 2,815.3 | 3,292.6 | 4,263.9 |
|
Source: Euromonitor International, 2023 1: any flavoured candies made from boiled sugar and resulting in hard or soft drops; mints and lollipops are excluded 2: any sugar confectionery product (not limited to sweets made from boiled sugar) containing herbs and/or plants extracts. Medicated mints fall into this subsector. 3: any sugar confectionery product not included above, for example, marshmallows or sweet liquid concentrates sold as candies, etc. |
|||||
| Category | CAGR* % 2018-2022 | Annual growth % 2022/2021 | Total growth % 2018-2022 |
|---|---|---|---|
| Total - Sugar confectionery | 9.3 | 18.9 | 42.7 |
| Boiled sweets | 3.9 | 9.0 | 16.5 |
| Liquorice | 5.7 | 9.9 | 24.6 |
| Lollipops | 7.6 | 24.6 | 34.1 |
| Medicated confectionery | 9.4 | 44.7 | 43.1 |
| Mints | 0.3 | 11.4 | 1.1 |
| Power mints | −3.6 | 7.5 | −13.8 |
| Standard mints | 2.5 | 13.4 | 10.3 |
| Pastilles, gummies, jellies and chews | 9.6 | 13.0 | 44.3 |
| Toffees, caramels and nougat | 6.9 | 11.0 | 30.8 |
| Other sugar confectionery | 14.6 | 29.5 | 72.5 |
|
Source: Euromonitor International, 2023 *CAGR: Compound Annual Growth |
|||
| Category | 2022 | 2023 | 2024 | 2025 | 2026 | 2027 | 2028 |
|---|---|---|---|---|---|---|---|
| Total - Sugar confectionery | 16,954.1 | 19,213.8 | 20,330.4 | 21,068.3 | 21,687.2 | 22,273.2 | 22,781.7 |
| Boiled sweets | 530.6 | 578.3 | 593.6 | 603.1 | 612.1 | 621.1 | 630.6 |
| Liquorice | 210.7 | 221.3 | 226.2 | 231.1 | 234.4 | 236.4 | 237.6 |
| Lollipops | 921.4 | 1,080.6 | 1,154.5 | 1,195.6 | 1,223.5 | 1,246.7 | 1,268.5 |
| Medicated confectionery | 1,221.8 | 1,492.5 | 1,550.2 | 1,559.0 | 1,558.0 | 1,570.0 | 1,602.3 |
| Mints | 1,419.0 | 1,536.0 | 1,614.9 | 1,686.5 | 1,746.9 | 1,804.9 | 1,866.2 |
| Power mints | 460.4 | 487.3 | 499.1 | 511.4 | 522.7 | 529.1 | 535.9 |
| Standard mints | 958.7 | 1,048.6 | 1,115.8 | 1,175.1 | 1,224.1 | 1,275.8 | 1,330.3 |
| Pastilles, gummies, jellies and chews | 7,960.4 | 8,779.4 | 9,254.4 | 9,607.3 | 9,910.9 | 10,151.8 | 10,354.7 |
| Toffees, caramels and nougat | 426.1 | 455.3 | 466.8 | 474.7 | 480.0 | 484.0 | 483.3 |
| Other sugar confectionery | 4,263.9 | 5,070.4 | 5,469.7 | 5,711.0 | 5,921.4 | 6,158.4 | 6,338.4 |
| Source: Euromonitor International, 2023 | |||||||
| Category | CAGR* % 2022-2028 | Annual growth % 2023/2022 | Total growth % 2022-2028 |
|---|---|---|---|
| Total - Sugar confectionery | 5.0 | 13.3 | 34.4 |
| Boiled sweets | 2.9 | 9.0 | 18.8 |
| Liquorice | 2.0 | 5.0 | 12.8 |
| Lollipops | 5.5 | 17.3 | 37.7 |
| Medicated confectionery | 4.6 | 22.2 | 31.1 |
| Mints | 4.7 | 8.2 | 31.5 |
| Power mints | 2.6 | 5.8 | 16.4 |
| Standard mints | 5.6 | 9.4 | 38.8 |
| Pastilles, gummies, jellies and chews | 4.5 | 10.3 | 30.1 |
| Toffees, caramels and nougat | 2.1 | 6.9 | 13.4 |
| Other sugar confectionery | 6.8 | 18.9 | 48.7 |
|
Source: Euromonitor International, 2023 *CAGR: Compound Annual Growth |
|||
United State's top five sugar confectionery companies, representing a total market share of 43.1% (US$7.3 billion) were Ferrero & related parties, Mars Inc., The Hershey Company, Mondelez International Inc., and The Perfetti Van Melle Group in 2022. Private label companies represented a 3.7% market share at a value of US$631.0 million over the last year.
| Company | 2018 | 2019 | 2020 | 2021 | 2022 | CAGR* % 2018-2022 | Market share % 2022 |
|---|---|---|---|---|---|---|---|
| Ferrero and related parties | 1,445.3 | 1,459.9 | 1,515.7 | 1,758.8 | 2,015.6 | 8.7 | 11.9 |
| Mars Inc | 1,575.5 | 1,611.0 | 1,465.7 | 1,706.7 | 1,918.6 | 5.0 | 11.3 |
| Hershey Co, The | 1,471.5 | 1,495.7 | 1,362.1 | 1,470.7 | 1,617.2 | 2.4 | 9.5 |
| Mondelez International Inc | 887.4 | 881.7 | 861.5 | 871.6 | 1,039.7 | 4.0 | 6.1 |
| Perfetti Van Melle Group | 554.3 | 572.0 | 580.8 | 673.5 | 721.7 | 6.8 | 4.3 |
| Private Label | 618.8 | 610.5 | 603.9 | 643.3 | 631.0 | 0.5 | 3.7 |
| Others | 2,945.0 | 3,197.0 | 3,564.0 | 4,216.7 | 5,738.2 | 18.1 | 33.8 |
| Total | 11,883.3 | 12,344.5 | 12,490.2 | 14,256.8 | 16,954.1 | 9.3 | 100.0 |
|
Source: Euromonitor International, 2023 *CAGR: Compound Annual Growth |
|||||||
Gum
In 2022, gum was the 3rd largest confectionery category in the United States with retail sales valued at US$3.3 billion, representing a declined CAGR of 1.3% from retail sales of US$3.5 billion in 2018. The gum category is expected to recover and grow by a CAGR of 5.4% to reach sales of US$4.6 billion by 2028.
Chewing gum accounted for 92.0% of sales at a value of US$3.1 billion, with bubble gum having the remainder 8.0% of sales (US$266.1 million) in 2022. Bubble gum registered a positive growth by CAGR of 1.3% while chewing gum registered negative growth by CAGR of 1.6% over the historic period (2018 to 2022 Both confectionery gum types did fine over last year (2022/2021), and are forecast to recover with total growth between 11.8% and 39.0% (2022 to 2028).
| Category | 2018 | 2019 | 2020 | 2021 | 2022 |
|---|---|---|---|---|---|
| Total - Gum | 3,522.9 | 3,598.7 | 2,820.8 | 2,910.0 | 3,337.4 |
| Bubble Gum | 252.3 | 257.3 | 229.2 | 238.1 | 266.1 |
| Chewing Gum | 3,270.6 | 3,341.4 | 2,591.6 | 2,671.9 | 3,071.3 |
| Source: Euromonitor International, 2023 | |||||
| Category | CAGR* % 2018-2022 | Annual growth % 2022/2021 | Total growth % 2018-2022 |
|---|---|---|---|
| Total - Gum | −1.3 | 14.7 | −5.3 |
| Bubble Gum | 1.3 | 11.8 | 5.5 |
| Chewing Gum | −1.6 | 14.9 | −6.1 |
|
Source: Euromonitor International, 2023 *CAGR: Compound Annual Growth Rate |
|||
| Category | 2022 | 2023 | 2024 | 2025 | 2026 | 2027 | 2028 |
|---|---|---|---|---|---|---|---|
| Total - Gum | 3,337.4 | 3,675.1 | 3,826.9 | 4,000.8 | 4,175.3 | 4,359.9 | 4,567.4 |
| Bubble Gum | 266.1 | 292.7 | 299.8 | 302.1 | 302.1 | 300.2 | 297.5 |
| Chewing Gum | 3,071.3 | 3,382.4 | 3,527.1 | 3,698.7 | 3,873.1 | 4,059.6 | 4,269.9 |
| Source: Euromonitor International, 2023 | |||||||
| Category | CAGR* % 2022-2028 | Annual growth % 2023/2022 | Total growth % 2022-2028 |
|---|---|---|---|
| Total - Gum | 5.4 | 10.1 | 36.9 |
| Bubble Gum | 1.9 | 10.0 | 11.8 |
| Chewing Gum | 5.6 | 10.1 | 39.0 |
|
Source: Euromonitor International, 2023 *CAGR: Compound Annual Growth Rate |
|||
The top five gum confectionery companies in the United States, representing a total market share of 92.1% (US$3.1 billion) were Mars Inc., Mondelez International Inc., The Hershey Company, The Perfetti Van Melle Group, and Tootsie Roll Industries Inc. in 2022. Private label companies represented a 0.1% market share at a value of US$2.9 million over the last year.
| Company | 2018 | 2019 | 2020 | 2021 | 2022 | CAGR* % 2018-2022 | Market share % 2022 |
|---|---|---|---|---|---|---|---|
| Mars Inc | 1,782.3 | 1,861.6 | 1,473.3 | 1,511.6 | 1,779.8 | −0.04 | 53.3 |
| Mondelez International Inc | 737.7 | 688.6 | 491.8 | 475.4 | 506.6 | −9.0 | 15.2 |
| Hershey Co, The | 351.6 | 379.7 | 312.5 | 368.4 | 423.2 | 4.7 | 12.7 |
| Perfetti Van Melle Group | 255.1 | 270.9 | 226.7 | 248.9 | 303.6 | 4.4 | 9.1 |
| Tootsie Roll Industries Inc | 51.8 | 53.3 | 48.3 | 55.1 | 60.6 | 4.0 | 1.8 |
| Private Label | 6.0 | 6.0 | 3.8 | 3.5 | 2.9 | −16.6 | 0.1 |
| Others | 260.7 | 249.4 | 191.6 | 204.0 | 221.4 | −4.0 | 6.6 |
| Total | 3,522.9 | 3,598.7 | 2,820.8 | 2,910.0 | 3,337.4 | −1.3 | 100.0 |
|
Source: Euromonitor International, 2023 *CAGR: Compound Annual Growth |
|||||||
Retail distribution channels; confectionery product sector (off-trade)
The majority of United States' confectionery market is distributed through store-based retailing (US$44.8 billion) versus non-store retailing (US$3.4 billion) during the historic period, specifically 97.2% (store-based) and 2.8% (non-store e-commerce retailing) in 2022. American grocery retailers distribute most of the confectionery products (US$33.2 billion) representing a market share of 74.1%, mainly within supermarkets and hypermarkets (40.7%), forecourt convenience retailers (12.5%), and grocery warehouse clubs (9.4%) in 2022. The remainder of confectionery products are distributed through non-grocery specialists (17.4%) such as health & beauty specialists (8.4%), general merchandise stores (5.4%), and vending outlets (1.0%) in 2022.
In 2022, online e-commerce sales increased by a CAGR of 36.7% from a value of US$976.6 million in 2018 to $3,410.4 million in 2022.
| Outlet Type | 2018 | 2022 | ||
|---|---|---|---|---|
| Actual | Share (%) | Actual | Share (%) | |
| Total - retail channels | 34,547.2 | 100 | 44,828.8 | 100 |
| Store-based retail - offline | 33,570.7 | 97.2 | 41,418.4 | 92.4 |
| Grocery retailers | 26,556.6 | 76.9 | 33,206.0 | 74.1 |
| Convenience retail | 6,352.9 | 18.4 | 7,755.2 | 17.3 |
| Convenience stores | 1,589.8 | 4.6 | 2,134.1 | 4.8 |
| Forecourt retailers | 4,763.2 | 13.8 | 5,621.1 | 12.5 |
| Supermarkets | 6,676.9 | 19.3 | 8,680.0 | 19.4 |
| Hypermarkets | 7,556.8 | 21.9 | 9,527.0 | 21.3 |
| Discounters | 251.0 | 0.7 | 343.0 | 0.8 |
| Warehouse Clubs | 3,262.8 | 9.4 | 4,235.0 | 9.4 |
| Food/drink/tobacco specialists | 2,121.0 | 6.1 | 2,328.5 | 5.2 |
| Small Local Grocers | 335.3 | 1.0 | 337.5 | 0.8 |
| Non-Grocery specialists | 6,377.8 | 18.5 | 7,778.0 | 17.4 |
| General merchandise stores | 1,957.7 | 5.7 | 2,421.5 | 5.4 |
| Health and beauty specialists | 3,176.0 | 9.2 | 3,780.3 | 8.4 |
| Other non-grocery retailers | 1,244.2 | 3.6 | 1,576.3 | 3.5 |
| Vending | 1,244.2 | 3.6 | 434.3 | 1.0 |
| Non-store retail - e-commerce | 976.6 | 2.8 | 3,410.4 | 7.6 |
| Source: Euromonitor International, 2023 | ||||
Product launch and trend analysis
New product launch analysis
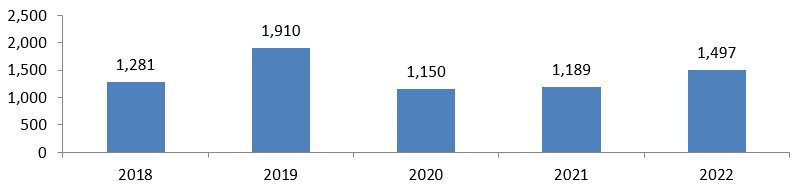
Mintel's Global New Products Database (GNPD) indicated that there were 7,027 new confectionery products launched (including new variety/range extension, new product, packaging, formulation or relaunched) in the United States between January 2018 and December 2022. Among which there are 7,023 foods, 3 drinks and 1 pet food.
Description of above image
| 2018 | 2019 | 2020 | 2021 | 2022 | Total Sample | |
|---|---|---|---|---|---|---|
| Number of Variants | 1,281 | 1,910 | 1,150 | 1,189 | 1,497 | 7,027 |
Source: Mintel, 2023
In 2022, top confectionery sub-categories were seasonal chocolate (331), pastilles, gums, jellies & chews (374), Non-Individually Wrapped Chocolate Pieces (172), Chocolate Tablets (137), and Individually Wrapped Chocolate Pieces (77).
Meanwhile, top claims associated with these new confectionery products released during the prescribed period were Kosher, seasonal, low/no/reduced allergen, gluten free, and social media in 2022. In 2022, preferred flavours (including blends) were unflavoured/plain, strawberry, Cherry, peanut butter and caramel/caramelised.
Top companies launching confectionery food products in the United States between 2018 and 2022 (Jan. - December) were Hershey (457), Mars Wrigley Confectionery (430), Ferrara Candy (189), Sugarfina (187) and Ferrero (175). Top confectionery brands over this period included Sugarfina (158), M&M's (133), Russell Stover (71), Trader Joe's (68), and Hershey's (68).
| Product attributes | Yearly launch counts | |||||
|---|---|---|---|---|---|---|
| 2018 | 2019 | 2020 | 2021 | 2022 | Total | |
| Yearly product launches | 1,281 | 1,910 | 1,150 | 1,187 | 837 | 7,901 |
| Top launch types | ||||||
| New Variety/Range Extension | 418 | 717 | 449 | 432 | 621 | 2,637 |
| New Packaging | 519 | 729 | 419 | 445 | 523 | 2,635 |
| New Product | 238 | 364 | 233 | 248 | 311 | 1,394 |
| Relaunch | 105 | 95 | 47 | 63 | 42 | 352 |
| New Formulation | 1 | 5 | 2 | 1 | 0 | 9 |
| Top ten sub-categories | ||||||
| Seasonal Chocolate | 263 | 402 | 256 | 252 | 331 | 1,504 |
| Pastilles, Gums, Jellies & Chews | 246 | 360 | 227 | 220 | 374 | 1,427 |
| Non-Individually Wrapped Chocolate Pieces | 160 | 187 | 138 | 170 | 172 | 827 |
| Chocolate Tablets | 136 | 256 | 125 | 101 | 137 | 755 |
| Individually Wrapped Chocolate Pieces | 91 | 114 | 62 | 102 | 77 | 446 |
| Other Sugar Confectionery | 56 | 76 | 44 | 44 | 62 | 282 |
| Lollipops | 34 | 82 | 42 | 31 | 29 | 218 |
| Chocolate Countlines | 46 | 92 | 25 | 30 | 25 | 218 |
| Gum | 39 | 66 | 40 | 31 | 33 | 209 |
| Marshmallows | 25 | 38 | 26 | 34 | 34 | 157 |
| Top five companies | ||||||
| Hershey | 85 | 93 | 73 | 104 | 102 | 457 |
| Mars Wrigley Confectionery | 54 | 132 | 91 | 84 | 69 | 430 |
| Ferrara Candy | 33 | 41 | 32 | 35 | 48 | 189 |
| Sugarfina | 33 | 43 | 32 | 28 | 51 | 187 |
| Ferrero | 26 | 35 | 33 | 44 | 37 | 175 |
| Top five brands | ||||||
| Sugarfina | 24 | 36 | 26 | 26 | 46 | 158 |
| M&M's | 36 | 34 | 26 | 28 | 9 | 133 |
| Russell Stover | 27 | 23 | 2 | 6 | 13 | 71 |
| Trader Joe's | 17 | 17 | 15 | 16 | 3 | 68 |
| Hershey's | 13 | 17 | 12 | 16 | 10 | 68 |
| Import status | ||||||
| Imported | 409 | 733 | 386 | 422 | 716 | 2,666 |
| Not imported | 280 | 347 | 205 | 191 | 194 | 1,217 |
| Top five claims | ||||||
| Kosher | 578 | 760 | 507 | 528 | 563 | 2,936 |
| Seasonal | 428 | 747 | 436 | 418 | 527 | 2,556 |
| Low/No/Reduced Allergen | 309 | 409 | 266 | 291 | 286 | 1,561 |
| Gluten Free | 287 | 363 | 240 | 263 | 259 | 1,412 |
| Social Media | 230 | 287 | 212 | 234 | 273 | 1,236 |
| Top five flavours (including blend) | ||||||
| Unflavoured/Plain | 226 | 350 | 203 | 222 | 240 | 1,241 |
| Strawberry | 65 | 94 | 68 | 54 | 85 | 366 |
| Cherry | 49 | 75 | 61 | 37 | 61 | 283 |
| Peanut Butter | 37 | 63 | 35 | 61 | 44 | 240 |
| Caramel/Caramelised | 35 | 56 | 31 | 39 | 49 | 210 |
| Source: Mintel; Global New Product Database, 2023 | ||||||
Opportunities for Canada
The Canada-United States-Mexico Agreement (CUSMA) that came into force on July 1, 2020, provides Canadian exporters preferential tariff treatment in the form of reduced tariffs, and access to one of the world's largest economies. The tariff treatment of a good exported to the United States depends on its specific tariff classification as determined by the American Customs Service. To benefit from tariff preferences in the United States, Canadian exporters must ensure goods meet applicable rules of origin. The importer must have a valid certificate of origin in their possession at the time of importation.
Canadian exporters may consult the Canada Tariff Finder to explore tariff information for the US market under the CUSMA, and other foreign markets with which Canada has a free trade agreement.
Please visit "Annex 2-B of Chapter 2 of CUSMA" or Global Affairs Canada G-2-2: Sugar-containing products - CUSMA [including sugars and sugar confectionery (HS code chapter 1704) and chocolate confectionery (HS code chapter 1806)] for a list of Canada-specific tariff-free rate quotas for confectionery exports to the United States.
Product examples
Original Candy Canes

Source: Mintel Global New Products Database 2023
| Company | Ferrara Candy |
|---|---|
| Manufacturer | Ferrara Candy |
| Brand | Spree |
| Category | Sugar and gum confectionery |
| Sub-category | Sticks, liquids and sprays |
| Market | United States |
| Location of manufacture | Mexico |
| Import status | Imported product |
| Store name | Meijer |
| Store type | Supermarket |
| Date published | December 2022 |
| Product source | Shopper |
| Launch type | Relaunch |
| Price in local currency | $3.49 |
| Price in Euros | 3.30 |
Spree Original Candy Canes have been relaunched for Christmas 2022 under a new brand name, previously known as Wonka Spree, and a newly designed 5.3 ounce pack containing 12 units. - Flavour kick- Logos and certifications: Facebook, Twitter
Orange, Lemon, Raspberry, Strawberry Fruit Chews

Source: Mintel Global New Products Database 2023
| Company | Storck |
|---|---|
| Manufacturer | Storck |
| Brand | Storck Mamba Fruit Strips |
| Category | Sugar and gum confectionery |
| Sub-category | Pastilles, gums, jellies and chews |
| Market | United States |
| Location of manufacture | Germany |
| Import status | Imported product |
| Store name | Cost Plus World Market |
| Store type | Supermarket |
| Date published | December 2022 |
| Product source | Shopper |
| Launch type | New product |
| Price in local currency | $2.99 |
| Price in Euros | 2.89 |
Storck Mamba Fruit Strips Orange, Lemon, Raspberry, Strawberry Fruit Chews are now available, and retail in a 6.3 ounce pack. - Natural and artificial flavors - 120 calories per serving - Chewy fruit strips
White Chocolate Almond & Coconut Truffles

Source: Mintel Global New Products Database 2023
| Company | Walgreen |
|---|---|
| Brand | Nice! |
| Category | Chocolate confectionery |
| Sub-category | Individually wrapped chocolate pieces |
| Market | United States |
| Location of manufacture | Turkey |
| Import status | Imported product |
| Store name | Walgreens |
| Store type | Drug store / pharmacy |
| Date published | December 2022 |
| Product source | Shopper |
| Launch type | New variety / range extension |
| Price in local currency | 3.99 |
| Price in Euros | 3.77 |
Nice! White Chocolate Almond & Coconut Truffles are now available and retail in a 5.3 ounce pack. - Logos and certifications: How2Recycle
Assorted Chocolate Truffles
Source: Mintel Global New Products Database 2023
| Company | Lindt & Sprüngli |
|---|---|
| Manufacturer | Lindt & Sprüngli |
| Brand | Lindt Lindor |
| Category | Chocolate confectionery |
| Sub-category | Seasonal chocolate |
| Market | United States |
| Location of manufacture | United States |
| Import status | Not imported |
| Store type | Internet / mail order |
| Date published | December 2022 |
| Product source | Shopper |
| Launch type | New variety / range extension |
| Price in local currency | 19.99 |
| Price in Euros | 19.23 |
Lindt Lindor Assorted Chocolate Truffles are now available, and retail in a 15.2 ounce pack, containing Milk Chocolate, Dark Chocolate, White Chocolate, 60% Extra Dark Chocolate, Sea Salt Milk Chocolate, and Fudge Swirl Milk Chocolate. - Seasonal for Christmas 2022 - When the chocolate shell of is broken, the lusciously smooth center starts to melt - Quality Guarantee - Finest Cocoa- Roasting and grinding - The Lindt Invention, conching- Best Ingredients - Finishing with perfection from bean to bar - Logos and certifications: Kosher, Lindt Sustainability, Lindt & Sprüngli Cocoa Farming Program
Blood Orange & Honey Hard Candies

Source: Mintel Global New Products Database 2023
| Company | Kroger |
|---|---|
| Brand | Simple Truth Organic |
| Category | Sugar and gum confectionery |
| Sub-category | Boiled sweets |
| Market | United States |
| Location of manufacture | Mexico |
| Import status | Imported product |
| Store name | Kroger |
| Store type | Supermarket |
| Date published | December 2022 |
| Product source | Shopper |
| Launch type | New product |
| Price in local currency | 2.99 |
| Price in Euros | 2.85 |
Simple Truth Organic Blood Orange & Honey Hard Candies are now available, and retail in a 2 ounce pack. - Naturally flavored- Kosher- The small candy with the big flavor - 60 calories per serving - Natural fruit flavor- Logos and certifications: USDA Organic, Non GMO
For more information
The Canadian Trade Commissioner Service:
International Trade Commissioners can provide Canadian industry with on-the-ground expertise regarding market potential, current conditions and local business contacts, and are an excellent point of contact for export advice.
More agri-food market intelligence:
International agri-food market intelligence
Discover global agriculture and food opportunities, the complete library of Global Analysis reports, market trends and forecasts, and information on Canada's free trade agreements.
Agri-food market intelligence service
Canadian agri-food and seafood businesses can take advantage of a customized service of reports and analysis, and join our email subscription service to have the latest reports delivered directly to their inbox.
More on Canada's agriculture and agri-food sectors:
Canada's agriculture sectors
Information on the agriculture industry by sector. Data on international markets. Initiatives to support awareness of the industry in Canada. How the department engages with the industry.
For additional information on the Natural Products Expo East (NPEE) or Americas Food and Beverage Show (AFB), please contact:
Cecile Landgrebe
Trade Commissioner
Consulate General of Canada
Government of Canada
cecile.landgrebe@international.gc.ca
Resources
- Canada Tariff Finder, 2022
- Global Affairs Canada, June 22, 2020: G-2-2: Sugar-containing products – CUSMA
- Global Trade Tracker, 2023
- Government of Canada, May 6, 2022: About CUSMA
- Mintel Global New Products Database, 2023
Sector Trend Analysis – Confectionery trends in the United States
Global Analysis Report
Prepared by: Hongli, Wang, Senior Market Analyst
© His Majesty the King in Right of Canada, represented by the Minister of Agriculture and Agri-Food (2023).
Photo credits
All photographs reproduced in this publication are used by permission of the rights holders.
All images, unless otherwise noted, are copyright His Majesty the King in Right of Canada.
To join our distribution list or to suggest additional report topics or markets, please contact:
Agriculture and Agri-Food Canada, Global Analysis1341 Baseline Rd, Tower 5, 3rd floor
Ottawa ON K1A 0C5
Canada
Email: aafc.mas-sam.aac@agr.gc.ca
The Government of Canada has prepared this report based on primary and secondary sources of information. Although every effort has been made to ensure that the information is accurate, Agriculture and Agri-Food Canada (AAFC) assumes no liability for any actions taken based on the information contained herein.
Reproduction or redistribution of this document, in whole or in part, must include acknowledgement of agriculture and agri-food Canada as the owner of the copyright in the document, through a reference citing AAFC, the title of the document and the year. Where the reproduction or redistribution includes data from this document, it must also include an acknowledgement of the specific data source(s), as noted in this document.
Agriculture and Agri-Food Canada provides this document and other report services to agriculture and food industry clients free of charge.