

Note: This report includes forecasting data that is based on baseline historical data.
Executive summary
In 2024, Japan's cooking oil market is shaped by evolving consumer preferences, economic pressures, and heavy import reliance. Canola (rapeseed) and soybean oils remain household staples, though premium and health-focused oils, like olive and sesame oil, have gained traction among middle- and high-income consumers. Per capita consumption of oils and fats fell by a compound annual growth rate (CAGR) of −3.3% from 2019 to 2023 but is expected to recover at a 3.3% CAGR through 2028.
Price increases have significantly impacted consumer buying behaviors. With double-digit price hikes for cooking oils since 2019, consumers are switching to cost-effective options like blended oils. The shift towards more affordable oils reflects broader inflationary pressures in Japan's food industry, affecting not only retail but also packaged food and foodservice sectors (Euromonitor International, 2023).
From 2020 to 2024, retail sales of cooking oils declined at a −2.8% CAGR, though growth is projected to resume with a 5.2% CAGR through 2029. Blended and eco-friendly oils, such as MCT and half-use oils that appeal to health-conscious consumers, are expected to drive this recovery.
Due to Japan's limited arable land, the country relies on imports for oil crops like soybeans and rapeseed, benefiting from zero import tariffs. Total cooking oil imports rose by a 5.5% CAGR from 2019 to 2023, with Malaysia and Spain as top suppliers. Canada's cooking oil exports to Japan faced a −13.6% CAGR decline over this period.
Looking ahead, Japan's cooking oil market is expected to grow from US$ 1.49 billion in 2024 to US$ 1.92 billion by 2029. "Other edible oils," including coconut and grapeseed oils, will lead this expansion, holding a 57.5% market share by 2029. Olive oil is forecasted to grow by a 5.9% CAGR, reflecting renewed interest among consumers. Major producers like Nisshin Oillio retain dominance, holding a 55.4% market share in 2024, while private label brands have seen positive growth due to their affordability.
Market overview
The cooking oil market in Japan plays a vital role within the country's food and beverage industry, driven by strong consumer demand for versatile, high-quality oils used in both home cooking and the foodservice sector. Among the various types of cooking oil, canola oil (rapeseed) is the most widely consumed cooking oil in Japan, valued for its versatility, heat resistance, and balanced fatty acids, primarily sourced from Canada and Australia. Soybean oil is another staple due to its affordability and widespread use in both households and the food industry, often imported from the U.S. and Brazil. Though smaller in market share, olive oil has gained popularity for its health benefits and premium image, especially extra virgin olive oil, with Japan primarily importing from Spain, Italy, and Turkey. Sesame oil, a key ingredient in traditional Japanese cuisine, is mostly used as a seasoning. Its robust, nutty flavor is essential in dishes like tempura and stir-fries, but it is not typically used as a cooking oil (Japan Oilseed Processors Association, 2024).
While Japanese cuisine generally uses less oil compared to Western diets, the choice of oil remains crucial for certain dishes. Olive oil is increasingly used in Western-style or fusion cooking, while sesame oil is a cornerstone of many traditional recipes. The trend toward premiumization in cooking oils is gaining momentum, especially among home cooks. Oils such as olive oil, coconut oil, and other specialty oils are now considered lifestyle products, appealing particularly to middle- and high-income consumers who are willing to pay more for oils they associate with health benefits and quality.
From 2019 to 2023, Japan's per capita consumption of oils and fats decreased at a CAGR of −3.3%, falling from US$25.4 to US$22.2. However, the trend is expected to reverse, with a forecasted CAGR of 3.3% from 2023 to 2028, reaching US$26.1 by 2028. In the broader food category, consumption also declined from US$3,075.2 to US$2,622.1 over 2019-2023, at a CAGR of −3.9%, but is projected to recover to US$3,058.5 by 2028 with a 3.1% CAGR from 2023 to 2028.
| Category | 2019 | 2023 | CAGR* % 2023 | 2024 | 2028 | CAGR* % 2023-2028 |
|---|---|---|---|---|---|---|
| Oils and Fats | 25.4 | 22.2 | −3.3 | 21.4 | 26.1 | 3.3 |
| Food | 3,075.2 | 2,622.1 | −3.9 | 2,521.8 | 3,058.5 | 3.1 |
|
Source: Euromonitor International, 2024 *CAGR: Compound Annual Growth Rate |
||||||
Due to sharp price increases, many Japanese consumers are shifting their habits when it comes to cooking oils. While olive oil has seen strong growth due to its health benefits, its high price has led some consumers to switch to cheaper alternatives or reduce oil usage altogether. Even rapeseed oil, traditionally more affordable, has faced significant price hikes due to global supply issues, with its unit price rising by double-digit rates since 2019. By 2022, retailers could no longer buffer these increases, leading to a 23% rise in rapeseed oil prices and a mass shift toward cheaper blended oils (Euromonitor International, 2023).
The rising prices of cooking oils in Japan have also affected packaged food products and the food service sector, particularly those that rely heavily on oils in their production processes. Items like mayonnaise and savory snacks like potato chips experienced price hikes due to increased production costs. For instance, Kewpie Corp, Japan's leading mayonnaise brand, raised prices multiple times since 2021, while Calbee, a top potato chips producer, increased prices in both 2022 and 2023, even reducing pack sizes to manage costs. Similarly, food service businesses have been impacted, with chains like Mister Donuts and Tenya raising menu prices in response to escalating oil costs, reflecting broader inflationary pressures across the food industry (Euromonitor International, 2023). In the baking and snack industries, manufacturers responded by reducing product sizes, a practice known as shrinkflation, which resulted in lower oil consumption (USDA, 2024). This trend is expected to continue as cooking oil prices remain high.
Production of cooking oils
Oil crop production in Japan from 2018 to 2022 reveals a generally positive trend, with total production increasing at a CAGR of 3.1%. Groundnuts were the largest crop produced, with 17,500 tonnes recorded in 2022, reflecting a CAGR of 2.9% from 15,600 tonnes in 2018. Rape (colza) seed followed, with production reaching 3,680 tonnes in 2022, marking a CAGR of 4.2% despite some fluctuations. In contrast, maize (corn) production remained stable, recording 161.9 tonnes in 2022, with a slight decline reflected in a CAGR of −0.1%. Sesame seed production showed little change, decreasing slightly to 13.9 tonnes in 2022 from 14.1 tonnes in 2018, resulting in a negative CAGR of −0.3%.
| Crops | 2018 | 2019 | 2020 | 2021 | 2022 | CAGR* % 2018-2022 |
|---|---|---|---|---|---|---|
| Groundnuts | 15,600.0 | 12,400.0 | 13,200.0 | 14,800.0 | 17,500.0 | 2.9 |
| Rape or colza seed | 3,120.0 | 4,130.0 | 3,580.0 | 3,230.0 | 3,680.0 | 4.2 |
| Maize (corn) | 162.6 | 168.7 | 155.0 | 162.1 | 161.9 | −0.1 |
| Sesame seed | 14.1 | 13.8 | 14.0 | 13.9 | 13.9 | −0.3 |
| Total | 18,896.7 | 16,712.5 | 16,949.0 | 18,206.1 | 21,355.8 | 3.1 |
|
Source: FAO food and agriculture statistics, 2024 *CAGR: Compound Annual Growth Rate |
||||||
The total processing of cooking oil in Japan has experienced a slight decline from 2017 to 2021, with a CAGR of −1.0%. Crude rapeseed (canola) oil was the largest processed crop, with 993.8 thousand tonnes recorded in 2021. While soya bean oil processing remained relatively stable, it experienced a marginal decline, resulting in a CAGR of −0.1%. Other cooking oils, including maize and cottonseed oils, showed downward trends, indicated by negative CAGRs of −1.6% and −4.8%, respectively. The decrease in rapeseed (canola) oil production is particularly notable, with a CAGR of −1.6%. Groundnut oil also saw a decline, reflected in a CAGR of −3.4%. However, sesame seed oil processing experienced an increase, showing a positive CAGR of 3.3%. Overall, while sesame oil demonstrated growth, the majority of processed oils faced challenges during this period.
| Crops | 2017 | 2018 | 2019 | 2020 | 2021 | CAGR* % 2017-2021 |
|---|---|---|---|---|---|---|
| Rapeseed/canola oil, crude | 1,058.1 | 1,025.9 | 1,014.9 | 975.8 | 993.8 | −1.6 |
| Soya bean oil | 475.3 | 466.3 | 488.9 | 452.4 | 474.0 | −0.1 |
| Oil of maize | 78.4 | 82.5 | 80.7 | 72.8 | 73.4 | −1.6 |
| Oil of sesame seed | 50.7 | 52.7 | 53.3 | 54.3 | 57.7 | 3.3 |
| Cottonseed oil | 5.2 | 4.9 | 4.6 | 4.6 | 4.2 | −4.8 |
| Oil of linseed | 1.6 | 1.8 | 1.6 | 1.3 | 1.5 | −1.6 |
| Groundnut oil | 0.4 | 0.5 | 0.5 | 0.4 | 0.4 | −3.4 |
| Total | 1,669.6 | 1,634.6 | 1,644.4 | 1,561.6 | 1,605.0 | −1.0 |
|
Source: FAO food and agriculture statistics, 2024 *CAGR: Compound Annual Growth Rate |
||||||
Global trade overview of cooking oils
The global market for cooking oils has experienced positive growth with a CAGR of 12.9% as imports have increased from US$70.0 billion in 2019 to US$113.6 billion in 2023. India was the largest global market for cooking oils in 2023 with imports valued at US$16.5 billion, (14.5% market share) representing a CAGR of 14.1% from US$9.7 billion in 2017, followed by China with imports valued at US$12.2 billion (10.7% market share) and increase in CAGR of 8.8% from US$8.7 billion in 2019 and the U.S, with import values of US$11.8 billion (10.4% market share) in 2023.
Japan was the 19th largest global market for cooking oils and experienced an increase in CAGR of 5.5% as imports increased from US$1.2 billion in 2019 to US$1.4 billion in 2023 (1.3% market share in 2023). Canada in comparison, was the 21st largest global market for cooking oils with import values of US$1.2 billion (1.1% market share) in 2023, representing an increase in CAGR of 21.2% from imports valued at US$0.6 billion in 2019.
| Country | 2019 | 2020 | 2021 | 2022 | 2023 | CAGR* % 2019-2023 | Market share % in 2023 |
|---|---|---|---|---|---|---|---|
| Global total | 70.0 | 79.1 | 115.7 | 137.8 | 113.6 | 12.9 | 100.0 |
| India | 9.7 | 10.5 | 17.3 | 21.5 | 16.5 | 14.1 | 14.5 |
| China | 8.7 | 9.9 | 13.4 | 11.5 | 12.2 | 8.8 | 10.7 |
| United States | 5.7 | 6.0 | 8.9 | 12.0 | 11.8 | 20.0 | 10.4 |
| Italy | 3.6 | 3.7 | 4.6 | 5.9 | 5.5 | 11.8 | 4.9 |
| Netherlands | 3.9 | 4.4 | 5.8 | 6.4 | 4.9 | 5.5 | 4.3 |
| Spain | 2.3 | 2.8 | 3.6 | 4.4 | 4.4 | 17.4 | 3.9 |
| Germany | 2.4 | 2.6 | 3.5 | 4.6 | 3.7 | 11.5 | 3.3 |
| Pakistan | 0.8 | 2.0 | 3.4 | 4.1 | 3.2 | 17.8 | 2.9 |
| Turkey | 1.0 | 1.4 | 2.3 | 3.8 | 2.8 | 28.6 | 2.5 |
| Iran |
1.2 |
0.9 | 2.6 | 2.6 | 2.5 | 20.8 | 2.2 |
| Japan (19th) | 1.2 | 1.2 | 1.4 | 1.7 | 1.4 | 5.5 | 1.3 |
| Canada (21st) | 0.6 | 0.7 | 0.8 | 1.1 | 1.2 | 21.2 | 1.1 |
|
Source: Global Trade Tracker, 2024 1: For this report, "cooking oil" is defined by HS codes 1507 to 1515, inclusively. *CAGR: Compound Annual Growth Rate |
|||||||
Japan's trade overview of cooking oils
Japan relies heavily on imports for oil crops like soybeans and rapeseeds due to limited arable land, with only 12% suitable for cultivation. As a result, the country imposes no import tariffs on soybean, rapeseed, and cottonseed (Malaysian Palm Oil Council, 2023). Additionally, effective April 1, 2023, Japan eliminated import duties on soybean and canola oil under the CPTPP trade agreement (Agriculture and Agri-Food Canada, 2022).
From 2019 to 2023, Japan's total cooking oil imports grew at a CAGR of 5.5%, rising from US$1,168.4 million to US$1,448.9 million. Palm oil (HS 1511) led the imports, growing at a 9.1% CAGR and reaching US$704.6 million in 2023. Olive oil (HS 1509) saw a modest CAGR of 0.6%, increasing to US$327.8 million. Fixed vegetable fats and oils (HS 1515) rose to US$201.6 million with a 7.9% CAGR. Imports of coconut and palm kernel oil (HS 1513) also grew steadily, with a 7.3% CAGR, while sunflower-seed, safflower, or cotton-seed oil (HS 1512) declined by −3.6%. Rape, colza, or mustard oil (HS 1514) showed a decline, with an −8.7% CAGR, while other oils (HS 1510) recorded strong growth at 13.5%. Conversely, soya-bean oil (HS 1507) imports contracted by −16.9%, and groundnut oil (HS 1508) remained almost unchanged.
| HS code | Description | 2019 | 2020 | 2021 | 2022 | 2023 | CAGR* % 2019-2023 |
|---|---|---|---|---|---|---|---|
| Total | 1,168.4 | 1,169.4 | 1,384.3 | 1,723.2 | 1,448.9 | 5.5 | |
| 1511 | palm oil | 497.8 | 547.7 | 672.6 | 873.0 | 704.6 | 9.1 |
| 1509 | olive oil | 319.5 | 275.4 | 276.6 | 295.5 | 327.8 | 0.6 |
| 1515 | fixed vegetable fats and oils | 148.6 | 147.4 | 166.4 | 203.8 | 201.6 | 7.9 |
| 1513 | coconut, palm kernel oil | 101.3 | 107.0 | 185.5 | 226.6 | 134.5 | 7.3 |
| 1512 | sunflower-seed, safflower or cotton-seed oil | 47.2 | 44.8 | 44.5 | 44.7 | 40.8 | −3.6 |
| 1514 | rape, colza or mustard oil | 35.6 | 35.2 | 26.6 | 51.6 | 24.8 | −8.7 |
| 1510 | other oils | 4.5 | 4.4 | 4.5 | 5.3 | 7.5 | 13.5 |
| 1507 | soya-bean oil | 12.3 | 6.0 | 6.6 | 21.4 | 5.9 | −16.9 |
| 1508 | groundnut oil | 1.42 | 1.40 | 1.12 | 1.29 | 1.41 | −0.2 |
|
Source: Global Trade Tracker, 2024 *CAGR: Compound Annual Growth Rate |
|||||||
Malaysia emerged as Japan's top cooking oil supplier, with imports growing at a robust 17.6% CAGR, reaching US$667.0 million and capturing 46.0% of the market. Spain followed with a modest 0.8% CAGR and US$190.1 million in 2023, representing a 13.1% market share. Italy, despite a slight decline with a −1.4% CAGR, held 8.9% of the market. Imports from Indonesia contracted sharply by −12.8%, amounting to US$124.3 million and 8.6% of the market. The Philippines (3.2% share) and Turkey (2.4% share) both posted strong growth rates of 9.6% and 31.7%, respectively. Other notable suppliers include India, Brazil, and Thailand, with varying growth rates and market shares, while Canada ranked 13th, with a −13.6 % CAGR and a 1.1% share in 2023.
| Country | 2019 | 2020 | 2021 | 2022 | 2023 | CAGR* % 2019-2023 | Market share % in 2023 |
|---|---|---|---|---|---|---|---|
| World | 1,168.4 | 1,169.4 | 1,384.3 | 1,723.2 | 1,448.9 | 5.5 | 100.0 |
| Malaysia | 349.0 | 349.2 | 479.9 | 785.8 | 667.0 | 17.6 | 46.0 |
| Spain | 184.4 | 164.3 | 156.3 | 168.7 | 190.1 | 0.8 | 13.1 |
| Italy | 136.9 | 117.4 | 122.5 | 124.8 | 129.2 | −1.4 | 8.9 |
| Indonesia | 215.4 | 273.5 | 308.0 | 241.1 | 124.3 | −12.8 | 8.6 |
| Philippines | 32.2 | 32.8 | 68.3 | 71.6 | 46.5 | 9.6 | 3.2 |
| Turkey | 11.8 | 10.1 | 16.1 | 22.3 | 35.4 | 31.7 | 2.4 |
| India | 33.0 | 33.7 | 35.9 | 42.9 | 32.7 | −0.2 | 2.3 |
| Brazil | 15.8 | 19.5 | 22.5 | 21.7 | 31.9 | 19.3 | 2.2 |
| Thailand | 15.0 | 7.5 | 18.7 | 39.0 | 28.6 | 17.6 | 2.0 |
| France | 15.1 | 12.4 | 14.8 | 6.3 | 18.8 | 5.6 | 1.3 |
| Canada (13th) | 29.0 | 31.6 | 17.7 | 36.3 | 16.2 | −13.6 | 1.1 |
|
Source: Global Trade Tracker, 2024 *CAGR: Compound Annual Growth Rate |
|||||||
Canada's performance
In 2023, Japan's cooking oil imports from Canada totaled US$16.2 million, with a volume of 7,291 tons. The majority of these imports were rapeseed, colza, or mustard oil (HS 1514), valued at US$13.4 million and accounting for 93.6% of the total import value, with a volume of 6,824 tons. Fixed vegetable fats and oils (HS 1515) made up the remaining 6.4%, valued at US$2.7 million, with a volume of 467 tons.
| HS code | Description | Import value | Import volume | Market share % in value |
|---|---|---|---|---|
| Total | 16.2 | 7,291 | 100.0 | |
| 1514 | rape, colza or mustard oil | 13.4 | 6,824 | 93.6 |
| 1515 | fixed vegetable fats and oils | 2.7 | 467 | 6.4 |
| Source: Global Trade Tracker, 2024 | ||||
In 2023, Canada exported US$5.5 billion, and 3.5 billion kilograms of cooking oils to global markets. The U.S was the largest export market for Canadian cooking oils (91.64% market share) valued at US$5.1 billion, 3.2 billion kilograms, followed by Mexico (3.8% market share) with values of US$210.6 million, 120.2 million kilograms, and China (2.78% market share) valued at US$154.3 million, 122.4 million kilograms. Japan was the fifth largest market (0.25% market share) for Canadian cooking oils with values of US$13.7 million and 8.8 million kilograms in 2023.
| Country | Export value | Export volume | Market share % in value |
|---|---|---|---|
| World | 5,546.4 | 3,470.0 | 100.0 |
| United States | 5,082.8 | 3,155.4 | 91.64 |
| Mexico | 210.6 | 120.2 | 3.80 |
| China | 154.3 | 122.4 | 2.78 |
| South Korea | 50.3 | 39.0 | 0.91 |
| Japan | 13.7 | 8.8 | 0.25 |
| United Arab Emirates | 7.6 | 6.0 | 0.14 |
| Taiwan | 5.9 | 4.1 | 0.11 |
| Saudi Arabia | 4.0 | 3.5 | 0.07 |
| Colombia | 2.7 | 1.6 | 0.05 |
| Qatar | 2.0 | 1.6 | 0.04 |
| Source: Global Trade Tracker, 2024 | |||
The top Canadian provinces supplying the Japanese market in 2023 were Saskatchewan, Alberta, and British Columbia, occupying market shares of 54.0%, 35.5%, and 6.2%, respectively. Top cooking oil exports from Canada to Japan were rapeseed, colza, or mustard oil (HS code: 1514), valued at US$12.1 million and totaling 8,277 tons, followed by fixed vegetable fats and oils (HS code: 1515), valued at US$1.4 million and totaling 420 tons.
| HS code | Description | Export value | Export volume | Top provincial suppliers and market value share | ||
|---|---|---|---|---|---|---|
| Total | 13.7 | 8,774 | Saskatchewan: 54.0 | Alberta: 35.5 | British Columbia: 6.2 | |
| 1514 | rape, colza or mustard oil | 12.1 | 8,277 | Saskatchewan: 58.8 | Alberta: 37.3 | Ontario: 4.0 |
| 1515 | fixed vegetable fats and oils | 1.4 | 420 | British Columbia: 54.6 | Alberta: 19.6 | Saskatchewan: 17.4 |
| Source: Global Trade Tracker, 2024 | ||||||
Retail markets
Global retail sales of cooking oils
Global retail sales of cooking oils increased at a CAGR of 6.1%, from US$98.3 billion in 2020 to US$124.5 billion in 2024, and are expected to rise further at a CAGR of 8.3%, reaching US$185.5 billion by 2029. India was the largest global market for cooking oils in 2024, with retail sales of US$24.4 billion (19.6% market share), followed by China with values of US$15.2 billion (12.2% market share), and Brazil, with retail sales of US$7.1 billion (5.7% market share).
Japan, despite being the 19th largest market, saw a decline in retail sales between 2020 and 2024, with a negative CAGR of −2.8%; however, the market is projected to recover with a CAGR of 5.2% by 2029, reaching US$1.9 billion. In comparison, Canada was the 40th largest global retail sales market for cooking oils, with values of US$580.6 million in 2024. Canada is expected to see growth at a CAGR of 4.1% during the forecast period, with retail sales anticipated to reach US$710.8 million by 2029.
| Geography | 2020 | 2024 | CAGR* % 2020-2024 | 2025 | 2029 | CAGR* % 2024-2029 |
|---|---|---|---|---|---|---|
| World | 98,269.9 | 124,454.6 | 6.1 | 134,951.9 | 185,501.3 | 8.3 |
| India | 19,824.5 | 24,363.9 | 5.3 | 26,385.4 | 34,504.9 | 7.2 |
| China | 15,946.9 | 15,174.9 | −1.2 | 15,683.9 | 17,325.6 | 2.7 |
| Brazil | 4,624.9 | 7,095.1 | 11.3 | 9,384.6 | 12,739.9 | 12.4 |
| United States | 4,482.0 | 5,993.4 | 7.5 | 6,409.2 | 7,874.5 | 5.6 |
| Turkey | 2,821.9 | 4,993.4 | 15.3 | 5,645.3 | 12,398.8 | 19.9 |
| Ethiopia | 1,653.4 | 3,143.0 | 17.4 | 3,516.4 | 4,979.5 | 9.6 |
| Italy | 2,170.6 | 3,004.0 | 8.5 | 3,102.6 | 3,623.0 | 3.8 |
| Russia | 2,010.6 | 2,823.6 | 8.9 | 2,937.0 | 3,467.3 | 4.2 |
| Spain | 1,725.7 | 2,751.7 | 12.4 | 2,854.0 | 3,365.0 | 4.1 |
| Pakistan | 1,685.2 | 2,697.2 | 12.5 | 2,554.5 | 3,516.2 | 5.4 |
| Japan (19th) | 1,672.6 | 1,491.0 | −2.8 | 1,620.6 | 1,919.7 | 5.2 |
| Canada (40th) | 431.6 | 580.6 | 7.7 | 611.2 | 710.8 | 4.1 |
|
Source: Euromonitor International, 2024 *CAGR: Compound Annual Growth Rate |
||||||
Japan retail sales of cooking oil
The retail value sales of cooking oils in Japan have experienced a decline over the period from 2020 to 2024, with total sales dropping from US$1,672.6 million in 2020 to an estimated US$1,491.0 million in 2024, representing a total growth of −10.9%. Among the categories, "other edible oil" peaked at US$940.5 million in 2022 but has since decreased to US$846.0 million in 2024, holding a market share of 56.7%. Olive oil has shown a slight rebound from US$309.6 million in 2022 to US$332.0 million in 2024, but it has still seen a significant total growth decline of −18.8% over the same period. In contrast, rapeseed oil sales have sharply declined by 24.4% from 2020 to 2024, with sales projected to reach $313.0 million in 2024.
The annual growth rate from 2023 to 2024 indicates a broader negative trend across all categories, with overall edible oils experiencing a decline of −3.6%. "other edible oil" also saw a notable drop of −4.1%, while olive oil managed a positive annual growth of 3.4%, suggesting a potential resurgence in consumer interest. However, its CAGR remains negative at −5.1%. The rapeseed oil category continues to face challenges, exhibiting an annual decline of −9.0% and a CAGR of −6.8%.
In 2023, Japan's cooking oils market declined due to rising unit prices, driven by global demand, raw material shortages, supply chain disruptions, labor shortages, and the war in Ukraine. Following a double-digit price increase in 2022, cooking oil prices continued to climb sharply, but this did not translate into value growth, as consumers reduced consumption or switched to cheaper alternatives. Olive oil, once popular for its health benefits, saw reduced demand due to its high cost, while even lower-priced options like rapeseed oil experienced substantial price hikes. As a result, many consumers opted for blended oils, such as Salad Abura, which combines soy and rapeseed oils, reflecting a broader trend of trading down across oil types (Euromonitor International, 2023).
| Category | 2020 | 2021 | 2022 | 2023 | 2024 | Market share % in 2024 |
|---|---|---|---|---|---|---|
| Cooking Oils | 1,672.6 | 1,673.2 | 1,584.5 | 1,547.4 | 1,491.0 | 100.0 |
| Other Edible Oil[1] | 849.3 | 881.4 | 940.5 | 882.1 | 846.0 | 56.7 |
| Olive Oil | 409.1 | 378.3 | 309.6 | 321.2 | 332.0 | 22.3 |
| Rapeseed Oil | 414.2 | 413.5 | 334.4 | 344.0 | 313.0 | 21.0 |
|
Source: Euromonitor International, 2024 1: includes vegetable and seed oil such as coconut oil, grapeseed oil, groundnut oil, sesame oil and walnut oil, as well as blended oils which contain less than 50% of any single type of oils broken down into the researched oil categories. |
||||||
| Category | Annual growth % 2023-2024 | CAGR* % 2020-2024 | Total growth % 2020-2024 |
|---|---|---|---|
| Edible Oils | −3.6 | −2.8 | −10.9 |
| Other Edible Oil[1] | −4.1 | −0.1 | −0.4 |
| Olive Oil | 3.4 | −5.1 | −18.8 |
| Rapeseed Oil | −9.0 | −6.8 | −24.4 |
|
Source: Euromonitor International, 2024 *CAGR: Compound Annual Growth Rate 1: includes vegetable and seed oil such as coconut oil, grapeseed oil, groundnut oil, sesame oil and walnut oil, as well as blended oils which contain less than 50% of any single type of oils broken down into the researched oil categories. |
|||
The forecast for Japan's cooking oil market indicates a positive trend from 2024 to 2029, with overall retail value sales expected to grow from US$1,491.0 million in 2024 to US$1,919.7 million in 2029, achieving a total growth of 28.8% and a CAGR of 5.2%. Other edible oils, the largest category, are projected to increase by 30.4%, reaching US$1,103.5 million by 2029, maintaining a 57.5% market share. Olive oil is expected to see the highest total growth among the main categories, with sales climbing from US$332.0 million in 2024 to US$442.3 million in 2029, marking a total growth of 33.2% and a CAGR of 5.9%. Rapeseed oil, while growing at a slower pace, is still forecasted to rise from US$313.0 million to US$374.0 million by 2029, achieving a 19.5% increase and holding a market share of 19.5%.
The annual growth rate from 2024 to 2025 signals strong momentum across the cooking oil sector, with overall cooking oils expected to grow by 8.7%. Other edible oil is forecasted to grow by 9.3% in 2025, while olive oil is set to experience total growth of 9.7%. Rapeseed oil, despite slower growth, will still see an annual increase of 6.1% in 2025.
Retail sales of edible oils in Japan are expected to see modest growth over the forecast period, with cheaper blended oils leading this trend as consumers shift to more affordable options amid limited income growth. Disposable incomes in Japan grew by just 2% between 2017 and 2022, and are forecasted to rise by 8% from 2023 to 2028, much lower than in other developed countries (Euromonitor International, 2023). Olive oil, which saw peak popularity in 2020, is unlikely to fully recover from the losses seen in 2021 to 2023 due to rising prices and competition from newer health-focused products. Consumers, influenced by media and social trends, are exploring other healthy alternatives, leading to a continued decline in olive oil sales unless prices stabilize. Meanwhile, medium chain triglycerides (MCT) oil, known for its weight management benefits, is gaining traction, supported by innovations like MCT-infused foods and functional claims. Companies like Nisshin Oillio have also developed products like "half-use" oils, which provide the same cooking results with less oil, helping consumers manage costs in a market where prices are expected to keep rising. This focus on innovation will be key for Japanese edible oil companies moving forward (Euromonitor International, 2023).
| Category | 2024 | 2025 | 2026 | 2027 | 2028 | 2029 | Market share in 2024 |
|---|---|---|---|---|---|---|---|
| Edible Oils | 1,491.0 | 1,620.6 | 1,698.3 | 1,761.8 | 1,837.2 | 1,919.7 | 100.0 |
| Other Edible Oil[1] | 846.0 | 924.3 | 971.8 | 1,010.3 | 1,055.1 | 1,103.5 | 57.5 |
| Olive Oil | 332.0 | 364.3 | 384.3 | 401.1 | 420.8 | 442.3 | 23.0 |
| Rapeseed Oil | 313.0 | 332.0 | 342.1 | 350.3 | 361.3 | 374.0 | 19.5 |
|
Source: Euromonitor International, 2024 1: includes vegetable and seed oil such as coconut oil, grapeseed oil, groundnut oil, sesame oil and walnut oil, as well as blended oils which contain less than 50% of any single type of oils broken down into the researched oil categories. |
|||||||
1: includes vegetable and seed oil such as coconut oil, grapeseed oil, groundnut oil, sesame oil and walnut oil, as well as blended oils which contain less than 50% of any single type of oils broken down into the researched oil categories.
| Category | Annual growth % 2024-2025 | CAGR* % 2024-2029 | Total growth % 2024-2029 |
|---|---|---|---|
| Cooking Oils | 8.7 | 5.2 | 28.8 |
| Other Edible Oil[1] | 9.3 | 5.5 | 30.4 |
| Olive Oil | 9.7 | 5.9 | 33.2 |
| Rapeseed Oil | 6.1 | 3.6 | 19.5 |
|
Source: Euromonitor International, 2024 *CAGR: Compound Annual Growth Rate 1: includes vegetable and seed oil such as coconut oil, grapeseed oil, groundnut oil, sesame oil and walnut oil, as well as blended oils which contain less than 50% of any single type of oils broken down into the researched oil categories. |
|||
Competitive landscape
In Japan's cooking oil market, Nisshin Oillio Group Ltd. remained the dominant player, growing modestly at a 1.1% CAGR from 2020 to 2024 and holding a 55.4% market share in 2024. Ajinomoto Co Inc. saw a steeper decline with a −4.4% CAGR, while smaller companies like Kadoya Sesame Mills Inc. experienced sharper contractions (CAGR −8.0%). Deoleo SA and Takemoto Oil & Fat Co Ltd. saw slight growth, whereas Bright Food (Group) Co Ltd. and others suffered significant declines. Private Label brands showed resilience, growing at 3.1% CAGR, contributing 4.0% to market share in 2024.
| Company name | 2020 | 2021 | 2022 | 2023 | 2024 | CAGR* % 2020-2024 | Market share % in 2024 |
|---|---|---|---|---|---|---|---|
| Total | 1,672.6 | 1,673.2 | 1,584.5 | 1,547.4 | 1,491.0 | −2.8 | 100.0 |
| Nisshin Oillio Group Ltd | 790.0 | 812.6 | 832.9 | 819.2 | 825.4 | 1.1 | 55.4 |
| Ajinomoto Co Inc | 168.7 | 148.8 | 136.2 | 136.7 | 140.9 | −4.4 | 9.5 |
| Kadoya Sesame Mills Inc | 91.6 | 91.0 | 74.5 | 68.6 | 65.7 | −8.0 | 4.4 |
| Deoleo SA | 31.8 | 31.2 | 25.1 | 30.7 | 35.2 | 2.6 | 2.4 |
| Takemoto Oil & Fat Co Ltd | 28.0 | 28.5 | 24.3 | 25.2 | 29.1 | 1.0 | 2.0 |
| Bright Food (Group) Co Ltd | 27.1 | 24.2 | 21.7 | 28.4 | 14.6 | −14.3 | 1.0 |
| Solleone Olive Co | 12.4 | 11.4 | 9.9 | 9.0 | 10.8 | −3.4 | 0.7 |
| Mataluni SpA | 10.8 | 10.1 | 8.5 | 9.8 | 7.0 | −10.3 | 0.5 |
| Private Label | 52.1 | 63.6 | 70.7 | 64.7 | 58.9 | 3.1 | 4.0 |
| Others | 460.2 | 451.7 | 380.7 | 355.0 | 303.3 | −9.9 | 20.3 |
|
Source: Euromonitor International, 2024 *CAGR: Compound Annual Growth Rate |
|||||||
Retail distribution channels
From 2020 to 2024, Japan's cooking oil market saw a shift in retail distribution channels, with offline retail sales dropping from US$1,580.2 million to US$1,401.4 million, reflecting a −3.0% CAGR. Grocery retailers, which dominate offline sales, experienced a steeper decline of −3.4%, driven by declines in supermarkets (−3.5%), hypermarkets (−3.4%), and small local grocers (−4.5%). Convenience stores and warehouse clubs saw smaller reductions in sales, while non-grocery retailers remained stable with 0.2% growth. E-commerce, although more resilient, also saw a minor contraction of −0.8%, bringing total retail value sales to US$1,491.0 million by 2024.
| Outlet type | 2020 | 2021 | 2022 | 2023 | 2024 | CAGR* % 2020-2024 |
|---|---|---|---|---|---|---|
| Retail Offline | 1,580.2 | 1,578.3 | 1,492.9 | 1,455.7 | 1,401.4 | −3.0 |
| Grocery Retailers | 1,399.7 | 1,391.3 | 1,305.3 | 1,269.5 | 1,219.2 | −3.4 |
| Convenience Stores | 13.2 | 13.0 | 12.4 | 12.4 | 11.9 | −2.6 |
| Supermarkets | 855.6 | 850.8 | 797.7 | 775.0 | 743.3 | −3.5 |
| Hypermarkets | 498.7 | 496.2 | 465.2 | 452.6 | 435.0 | −3.4 |
| Warehouse Clubs | 18.6 | 18.5 | 18.1 | 18.1 | 17.7 | −1.2 |
| Small Local Grocers | 13.6 | 12.8 | 12.0 | 11.4 | 11.3 | −4.5 |
| Non-Grocery Retailers | 180.5 | 187.0 | 187.6 | 186.2 | 182.2 | 0.2 |
| General Merchandise Stores | 80.9 | 85.8 | 83.7 | 84.0 | 81.6 | 0.2 |
| Health and Beauty Specialists | 99.6 | 101.2 | 103.8 | 102.2 | 100.5 | 0.2 |
| Retail E-Commerce | 92.4 | 94.9 | 91.6 | 91.7 | 89.6 | −0.8 |
| Total | 1,672.6 | 1,673.2 | 1,584.5 | 1,547.4 | 1,491.0 | −2.8 |
|
Source: Euromonitor International, 2024 *CAGR: Compound Annual Growth Rate |
||||||
New product launch analysis
Between 2019 and 2023, new product launches in Japan's cooking oil market declined significantly, from 28 in 2019 to just 16 in 2023. Nisshin Oillio led the market in launches, peaking at 15 in 2020, while Ajinomoto reduced its presence, with no launches in 2022 or 2023. Joyl Ajinomoto showed more consistent activity in later years. Ethical and environmental claims and convenience were the top product attributes, while price points mostly fell between US$1.08 and US$8.07. Olive oil and rapeseed oil were the most common ingredients, with Nisshin Oillio and Ajinomoto dominating company contributions, though overall activity slowed across the industry.
| Product attributes | Yearly launch count | ||||
|---|---|---|---|---|---|
| 2019 | 2020 | 2021 | 2022 | 2023 | |
| Yearly product launches | 28 | 42 | 38 | 24 | 16 |
| Top five brands | |||||
| Nisshin OilliO | 7 | 15 | 6 | 2 | 2 |
| Ajinomoto | 7 | 9 | 5 | 0 | 0 |
| Joyl Ajinomoto | 0 | 0 | 4 | 5 | 3 |
| Bosco | 1 | 3 | 3 | 2 | 0 |
| Nippn | 3 | 1 | 4 | 0 | 0 |
| Top five claim categories | |||||
| Ethical and environmental | 9 | 10 | 12 | 7 | 8 |
| Convenience | 9 | 12 | 4 | 10 | 8 |
| Minus | 9 | 8 | 11 | 5 | 5 |
| Positioning | 8 | 10 | 8 | 2 | 1 |
| Functional | 1 | 8 | 7 | 4 | 3 |
| Top five price groups (US dollars) | |||||
| 1.08 - 8.07 | 23 | 33 | 32 | 17 | 13 |
| 8.08 - 15.07 | 4 | 6 | 1 | 2 | 1 |
| 15.08 - 22.07 | 1 | 0 | 2 | 1 | 2 |
| 29.08 - 38.00 | 0 | 1 | 3 | 0 | 0 |
| 22.08 - 29.07 | 0 | 0 | 0 | 4 | 0 |
| Launch types | |||||
| New Packaging | 18 | 28 | 13 | 7 | 3 |
| New Variety/Range Extension | 6 | 6 | 8 | 7 | 6 |
| Relaunch | 4 | 8 | 10 | 4 | 1 |
| New Product | 0 | 0 | 7 | 6 | 6 |
| Top five ingredients | |||||
| Olive Oil | 11 | 13 | 12 | 7 | 4 |
| Rapeseed Oil | 6 | 1 | 17 | 7 | 6 |
| Linseed Oil | 7 | 8 | 7 | 1 | 1 |
| Sesame Seed Oil | 4 | 6 | 7 | 3 | 3 |
| Corn Oil | 1 | 2 | 5 | 1 | 2 |
| Top five companies | |||||
| Nisshin OilliO | 11 | 22 | 12 | 9 | 5 |
| Ajinomoto | 8 | 9 | 13 | 7 | 5 |
| Mitsui Group | 3 | 3 | 4 | 1 | 0 |
| Aeon | 0 | 4 | 3 | 3 | 1 |
| Showa Sangyo | 1 | 2 | 2 | 0 | 0 |
| Source: Mintel GNPD, 2024 | |||||
Examples of new products
Healthy Sesame Oil with Sesamin
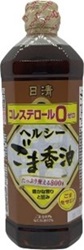
Source: Mintel Global New Products Database, 2024
| Company | Nisshin OilliO |
|---|---|
| Brand | Nisshin OilliO |
| Store name | Aeon Supermarket |
| Store type | Supermarket |
| Date published | June 2024 |
| Launch type | Relaunch |
| Price in US dollars | 6.25 |
Nisshin OilliO Healthy Sesame Oil with Sesamin has been relaunched, and retails in an 800 gram pack. - Free from cholesterol - Full of aroma and umami of roasted sesame - Consists of 60% sesame oil and 40% rapeseed oil - Enhances the flavours of food - Healthy oil with sesamin - Manufactured in an ISO 9001-certified factory - Launched on February 28, 2024, open-priced - Logos and certifications: ISO 9001
Organic Olive Oil
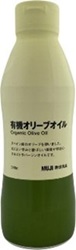
Source: Mintel Global New Products Database, 2024
| Company | Ryohin Keikaku |
|---|---|
| Brand | Mujirushi Ryohin |
| Store name | Mujirushi Ryohin |
| Store type | Specialist retailer |
| Date published | September 2023 |
| Launch type | New variety / range extension |
| Price in US dollars | 6.69 |
Mujirushi Ryohin Organic Olive Oil is now available, and retails in a 340 gram pack. - Made with olives produced in Spain - Moderately spicy and aromatic - Extra virgin oil - Launched on September 6, 2023, with an RRP of 990 yen - Logos and certifications: JAS Ecocert
Canola & Flaxseed Oil

Source: Mintel Global New Products Database, 2024
| Company | Nisshin OilliO |
|---|---|
| Brand | Nisshin OilliO |
| Store name | Yamanaka |
| Store type | Supermarket |
| Date published | June 2024 |
| Launch type | Relaunch |
| Price in US dollars | 3.18 |
Nisshin OilliO Canola & Flaxseed Oil has been relaunched, and retails in an 800 gram pack. - Free from cholesterol - Suitable for a variety of food - Consists of 80% canola oil and 20% flaxseed oil - Provides the recommended daily amount of omega 3 per tablespoon - Great for stir-frying and deep-frying, or as a dressing - Manufactured in an ISO 9001-certified factory - Compact eco bottle pack has no handle, reducing plastic by 39%, and fits the shape of the hand, making it easy to handle - Launched on February 28, 2024, open-priced- Logos and certifications: ISO 9001
Resetta Oil with MCT Oil

Source: Mintel Global New Products Database, 2024
| Company | Nisshin OilliO |
|---|---|
| Brand | Nisshin OilliO Resetta |
| Store name | Apita |
| Store type | Supermarket |
| Date published | April 2023 |
| Launch type | Relaunch |
| Price in US dollars | 4.26 |
Nisshin OilliO Resetta Resetta Oil with MCT Oil has been relaunched, and retails in a 600 gram pack. It is also available in 200 gram and 900 gram packs. - Formulated with medium chain fatty acid that suppresses body fat accumulation - Suitable for deep-fried food. stir-fries and dressings - Manufactured in an ISO 9001-certified factory - Eco and crushable pack is partly made from recycled plastic, is easy to pour the content out, and has some space to write the date when it is opened - Launched on March 1, 2023, open-priced - Logos and certifications: FOSHU.
Canola Oil Half Use
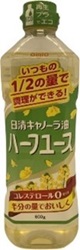
Source: Mintel Global New Products Database, 2024
| Company | Nisshin OilliO |
|---|---|
| Brand | Nisshin OilliO |
| Store name | Apita |
| Store type | Supermarket |
| Date published | April 2023 |
| Launch type | New variety / range extension |
| Price in US dollars | 3.69 |
Nisshin OilliO Canola Oil Half Use is now available, and retails in a 600 gram pack. - Requires half the amount of oil for cooking and deep-frying - Cholesterol free- Non-greasy oil - Manufactured in an ISO 9001-certified factory - Eco and crushable pack is partly made from recycled plastic, is easy to pour the content out, and has some space to write the date when it is opened- Launched on March 1, 2023, open-priced
Soybean Oil
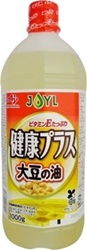
Source: Mintel Global New Products Database, 2024
| Company | J-Oil Mills |
|---|---|
| Brand | Joyl Ajinomoto Kenko Plus |
| Store name | Yaoko |
| Store type | Supermarket |
| Date published | May 2022 |
| Launch type | New product |
| Price in US dollars | 3.30 |
Joyl Ajinomoto Kenko Plus Soybean Oil is fortified with vitamin E, an antioxidant which helps the body to maintain cells. The product retails in a 1000 gram pack that is partly printed with biomass ink and bears the Biomass 10 logo. Launched on March 1, 2022. Recommended retail price unavailable.
Balance Up Oil

Source: Mintel Global New Products Database, 2024
| Company | Noevir |
|---|---|
| Brand | Noevir |
| Store name | Noevir Style |
| Store type | Internet / mail order |
| Date published | May 2021 |
| Launch type | New product |
| Price in US dollars | 31.97 |
Noevir Balance Up Oil is now available. It is fortified with omega-3 fatty acids for healthy skin and features a blend of flaxseed oil, borage seed oil, olive oil, sunflower oil and rapeseed oil. The cholesterol-free product retails in a 540 gram pack with two 270 gram units. Launched on March 5, 2021, with a recommended retail price of 3,456 yen.
First-Pressed Canola Oil
Source: Mintel Global New Products Database, 2024
| Company | J-Oil Mills |
|---|---|
| Brand | Joyl Ajinomoto |
| Date published | October 2021 |
| Launch type | New product |
| Price in US dollars | 3.98 |
Joyl Ajinomoto First-Pressed Canola Oil is now available. This product is made with pure canola oil with a neutral flavour, making it suitable for bringing out the flavour of food, and contains zero cholesterol. It retails in a 700 gram recyclable pack bearing the Plastics Smart and FSC Mix logos. It has a double cap to adjust the amount of oil it pours. The environmentally friendly FSC-certified pack is made with 60% less plastic, is wrapped with no transparent plastic film wrap, and has a cap made with recycled plastic. The manufacturer supports the Plastics Smart campaign to reduce ocean plastic. Launched in late August 2021 with a recommended retail price of 720 yen.
For more information
The Canadian Trade Commissioner Service:
International Trade Commissioners can provide Canadian industry with on-the-ground expertise regarding market potential, current conditions and local business contacts, and are an excellent point of contact for export advice.
More agri-food market intelligence:
International agri-food market intelligence
Discover global agriculture and food opportunities, the complete library of Global Analysis reports, market trends and forecasts, and information on Canada's free trade agreements.
Agri-food market intelligence service
Canadian agri-food and seafood businesses can take advantage of a customized service of reports and analysis, and join our email subscription service to have the latest reports delivered directly to their inbox.
More on Canada's agriculture and agri-food sectors:
Canada's agriculture sectors
Information on the agriculture industry by sector. Data on international markets. Initiatives to support awareness of the industry in Canada. How the department engages with the industry.
For additional information on the FoodEx Japan 2025, please contact:
Ben Berry, Deputy Director
Trade Show Strategy and Delivery
Agriculture and agri-food Canada
ben.berry@agr.gc.ca
Resources
- Agriculture and Agri-Food Canada, 2022: CPTPP benefits for Canadian canola and soy exporters
- Euromonitor International, Data statistics, 2024
- Euromonitor International, November 2023, Edible Oils in South Korea
- FAO food and agriculture statistics, 2024
- Global Trade Tracker, 2024
- Japan Oilseed Processors Association, 2024: Path of Vegetable Oil
- Malaysian Palm Oil Council, 2023: Market Dynamics and Growth Drivers in Japan's Processed Food Industry
- Mintel Global New Products Database, 2024
- United States Department of Agriculture 2024 : Japan: Oilseeds and Products Annual
Sector Trend Analysis – Cooking oil trends in Japan
Global Analysis Report
Prepared by: Zhi Duo Wang, Market Analyst
© His Majesty the King in Right of Canada, represented by the Minister of Agriculture and Agri-Food (2025).
Photo credits
All photographs reproduced in this publication are used by permission of the rights holders.
All images, unless otherwise noted, are copyright His Majesty the King in Right of Canada.
To join our distribution list or to suggest additional report topics or markets, please contact:
Agriculture and Agri-Food Canada, Global Analysis1341 Baseline Rd, Tower 5, 3rd floor
Ottawa ON K1A 0C5
Canada
Email: aafc.mas-sam.aac@agr.gc.ca
The Government of Canada has prepared this report based on primary and secondary sources of information. Although every effort has been made to ensure that the information is accurate, Agriculture and Agri-Food Canada (AAFC) assumes no liability for any actions taken based on the information contained herein.
Reproduction or redistribution of this document, in whole or in part, must include acknowledgement of agriculture and agri-food Canada as the owner of the copyright in the document, through a reference citing AAFC, the title of the document and the year. Where the reproduction or redistribution includes data from this document, it must also include an acknowledgement of the specific data source(s), as noted in this document.
Agriculture and Agri-Food Canada provides this document and other report services to agriculture and food industry clients free of charge.