

Note: This report includes forecasting data that is based on baseline historical data.
Executive summary
The United States (U.S) was the 2nd largest global market for cooking oils and experienced a compound annual growth rate (CAGR) of 12.2% as imports increased from US$6.3 billion in 2018. Canada in comparison, was the 27th largest global market for cooking oils with values of US$1.1 billion (0.8% market share) in 2022, representing an increase in CAGR of 10.1% from imports valued at US$0.6 billion in 2018.
Top imported cooking oils to the U.S in 2022 were rape, colza or mustard oil and its fractions (HS code: 1514) valued at US$4.1 billion, followed by palm oil and its fractions (HS code: 1511) valued at US$2.4 billion, and coconut "copra", palm kernel or babassu oil and fractions (HS code: 1513) with values of US$1.9 billion.
The top three suppliers of cooking oils to the U.S was Canada with a 34.8% market share equivalent to US$4.2 billion, followed by Indonesia with a 25.3% market share, equal to US$3.0 billion, and Spain, representing a 7.6% market share with US$0.9 billion in 2022.
In 2022, Canada exported US$5.2 billion, 2.9 billion kilograms of cooking oils to global markets. The U.S was the largest export market for Canadian cooking oils (81.5% market share) valued at US$4.2 billion, 2.3 billion kilograms, followed by Mexico (6.5% market share) with values of US$336.0 million, 187.6 million kilograms and China (5.6% market share) valued at US$288.6 million, 186.4 million kilograms in 2022.
The top supplying Canadian provinces to the U.S market were Saskatchewan, Manitoba and Alberta occupying market shares of 51.2%, 17.7% and 16.4% respectively in 2022.
The United States (U.S) was the 4th largest global retail sales market for cooking oils with values of US$5.4 billion, representing a 4.4% market share in 2022. The top three cooking oil categories in the U.S, in terms of retail value sales in 2022, were olive oil with values of US$2.0 billion (37.9% market share) increasing at a CAGR of 8.7%, followed by soy oil valued at US$1.5 billion (27.7% market share), representing an increase in CAGR of 6.9% and rapeseed oil with values of US$713.3 million (13.3% market share) and increasing in CAGR by 6.7% from 2017 to 2022.
Production (cooking oils)
High in polyunsaturates and relatively low in cost, soybean oil has emerged as the leading vegetable oil in the U.S. food economy. In recent years, soybean oil production has responded quickly to increased demand, becoming the U.S's number one choice of vegetable oil.
Soybean oil was the largest processed crop in the U.S with a production of 11.3 million tonnes in 2020, representing an increase in CAGR of 3.0% from 10.0 million tonnes processed in 2017. Maize (corn) oil is the second largest processed crop with 1.0 million tonnes in 2020, decreasing by the CAGR of 16.1% from 1.7 million tonnes in 2017, while rapeseed oil increased in CAGR (2.2%) as volume increased from 757,000 tonnes in 2017 to 809,000 tonnes in 2020.
| Crops (tonnes) | 2017 | 2018 | 2019 | 2020 | CAGR* % 2017-2020 |
|---|---|---|---|---|---|
| Oil, soybean[1] | 10,380,000.0 | 10,884,000.0 | 11,290,000.0 | 11,331,000.0 | 3.0 |
| Oil, maize[1] | 1,687,800.0 | 1,707,600.0 | 1,014,971.9 | 996,151.5 | −16.1 |
| Oil, rapeseed[1] | 757,000.0 | 717,000.0 | 717,000.0 | 809,000.0 | 2.2 |
| Oil, cottonseed | 263,000.0 | 225,000.0 | 218,000.0 | 188,000.0 | −10.6 |
| Oil, sunflower[1] | 200,000.0 | 211,000.0 | 187,000.0 | 228,000.0 | 4.5 |
|
Source: FAOSTAT Agricultural Production, 2023 *CAGR: Compound Annual Growth Rate 1: Crops also produced in Canada |
|||||
Maize (corn) was the largest crop produced in the U.S with 383.9 million tonnes recorded in 2021, representing an increase in CAGR of 0.9% from 371.1 million tonnes produced in 2017. Soybeans were the second largest crop with production of 120.7 million tonnes in 2021, increasing in CAGR by 0.1% from 120.1 million tonnes in 2017. Cotton seed, green maize and rapeseed experienced a decrease in CAGR of 1.6%, 6.5% and 2.8% from 2017 to 2021.
| Crops (tonnes) | 2017 | 2018 | 2019 | 2020 | 2021 | CAGR* % 2017-2021 |
|---|---|---|---|---|---|---|
| Maize[1] | 371,096,030.0 | 364,262,150.0 | 345,962,110.0 | 358,447,310.0 | 383,943,000.0 | 0.9 |
| Soybeans[1] | 120,064,970.0 | 120,514,490.0 | 96,667,090.0 | 114,748,940.0 | 120,707,230.0 | 0.1 |
| Seed, cotton | 12,000,000.0 | 11,116,053.9 | 12,790,218.5 | 9,227,456.4 | 11,246,552.9 | −1.6 |
| Maize, green[1] | 3,431,310.0 | 3,332,080.0 | 2,856,091.0 | 2,743,282.0 | 2,617,864.0 | −6.5 |
| Rapeseed[1] | 1,394,190.0 | 1,643,670.0 | 1,552,800.0 | 1,575,310.0 | 1,244,280.0 | −2.8 |
|
Source: FAOSTAT Agricultural Production, 2023 *CAGR: Compound Annual Growth Rate 1: Crops also produced in Canada |
||||||
Global trade overview of cooking oils
The global market for cooking oils has experienced positive growth with a CAGR of 15.3% as imports have increased from US$74.3 billion in 2018 to US$139.1 billion in 2022. India was the largest global market for cooking oils in 2022 with imports valued at US$21.5 billion, (15.5% market share) representing a CAGR of 19.7% from US$10.1 billion in 2018, followed by United States with imports valued at US$12.0 billion (8.6% market share) and the increase in CAGR of 12.2% from US$6.3 billion in 2018 and China, with import values of US$811.5 billion (8.3% market share) in 2022.
The U.S was the 2nd largest global market for cooking oils and experienced a CAGR of 12.2% as imports increased from US$6.3 billion in 2018. Canada in comparison, was the 27th largest global market for cooking oils with values of US$1.1 billion (0.8% market share) in 2022, representing an increase in CAGR of 10.1% from imports valued at US$0.6 billion in 2018.
| Country | 2018 | 2019 | 2020 | 2021 | 2022 | CAGR* % 2018-2022 | Market share % in 2022 |
|---|---|---|---|---|---|---|---|
| Reporter's Total | 74.3 | 70.7 | 80.9 | 113.9 | 139.1 | 15.3 | 100.0 |
| India | 10.1 | 9.7 | 10.5 | 17.3 | 21.5 | 19.7 | 15.5 |
| United States | 6.3 | 5.7 | 6.0 | 8.9 | 12.0 | 12.2 | 8.6 |
| China | 7.3 | 8.7 | 9.9 | 13.4 | 11.5 | 22.4 | 8.3 |
| Iran | 0.9 | 1.2 | 0.9 | 2.6 | 10.7 | 42.4 | 7.7 |
| Netherlands | 4.2 | 3.9 | 4.4 | 5.8 | 6.4 | 11.4 | 4.6 |
| Italy | 3.9 | 3.6 | 3.7 | 4.6 | 5.8 | 5.7 | 4.2 |
| Germany | 2.6 | 2.4 | 2.6 | 3.5 | 4.6 | 10.4 | 3.3 |
| Spain | 2.8 | 2.3 | 2.8 | 3.6 | 4.4 | 8.7 | 3.2 |
| Pakistan | 2.1 | 1.9 | 2.2 | 3.5 | 4.1 | 18.6 | 2.9 |
| Turkey | 1.0 | 1.0 | 1.4 | 2.3 | 3.8 | 32.0 | 2.7 |
| Canada 27 | 0.6 | 0.6 | 0.7 | 0.8 | 1.1 | 10.1 | 0.8 |
|
Source: Global Trade Tracker, 2023 *CAGR: Compound Annual Growth Rate 1: For the purpose of this report, 'cooking oil' is defined by HS codes 1507 to 1515, inclusively. |
|||||||
United States trade overview of cooking oils
The U.S imported US12.0 billion of cooking oils from global markets in 2022 and grew at a CAGR of 12.1%.
Top imported cooking oils to the U.S in 2022 were rape, colza or mustard oil and its fractions (HS code: 1514) valued at US$4.1 billion, followed by palm oil and its fractions (HS code: 1511) valued at US$2.4 billion, and coconut "copra", palm kernel or babassu oil and fractions (HS code: 1513) with values of US$1.9 billion.
| HS code | Description | 2018 | 2019 | 2020 | 2021 | 2022 | CAGR* % 2018-2022 |
|---|---|---|---|---|---|---|---|
| Total | 6,328.1 | 5,681.7 | 5,978.7 | 8,904.3 | 11,990.5 | 12.1 | |
| 1514 | rape, colza or mustard oil and fractions | 1,594.2 | 1,608.1 | 1,586.6 | 2,921.6 | 4,059.5 | 22.4 |
| 1511 | palm oil and its fractions, | 1,139.7 | 1,012.5 | 1,079.5 | 1,781.5 | 2,439.6 | 16.1 |
| 1513 | coconut "copra", palm kernel or babassu oil and fractions | 1,187.8 | 881.8 | 894.1 | 1,369.4 | 1,891.2 | 4.9 |
| 1509 | olive oil and its fractions | 1,523.8 | 1,310.0 | 1,366.4 | 1,494.7 | 1,863.2 | −0.6 |
| 1515 | fixed vegetable or microbial fats and oils, incl. jojoba oil, and their fractions, | 557.2 | 573.0 | 640.7 | 774.0 | 927.1 | 11.6 |
| 1512 | sunflower-seed, safflower or cotton-seed oil and fractions | 127.5 | 126.9 | 274.6 | 271.1 | 527.4 | 28.6 |
| 1507 | soya-bean oil and its fractions, | 130.0 | 132.4 | 110.5 | 208.7 | 190.4 | 17.1 |
| 1508 | groundnut oil and its fractions, | 37.3 | 16.5 | 13.4 | 53.6 | 55.7 | 12.9 |
| 1510 | other oils and their fractions, | 30.6 | 20.5 | 12.9 | 29.7 | 36.4 | −1.0 |
|
Source: Global Trade Tracker, 2023 *CAGR: Compound Annual Growth Rate |
|||||||
The top three suppliers of cooking oils to the U.S was Canada with a 34.8% market share equivalent to US$4.2 billion, followed by Indonesia with a 25.3% market share, equal to US$3.0 billion, and Spain, representing a 7.6% market share with US$0.9 billion in 2022.
| Country | 2018 | 2019 | 2020 | 2021 | 2022 | CAGR* % 2018-2022 | Market share % in 2022 |
|---|---|---|---|---|---|---|---|
| World | 6,327.6 | 5,681.8 | 5,979.1 | 8,903.7 | 11,990.4 | 12.1 | 100 |
| Canada | 1,739.8 | 1,758.8 | 1,706.4 | 3,117.7 | 4,176.3 | 21.5 | 34.8 |
| Indonesia | 1,109.3 | 931.2 | 994.8 | 2,077.2 | 3,033.7 | 23.3 | 25.3 |
| Spain | 587.9 | 571.2 | 343.8 | 533.4 | 914.3 | −3.2 | 7.6 |
| Italy | 582.0 | 519.5 | 551.5 | 580.0 | 726.0 | −0.1 | 6.1 |
| Philippines | 555.4 | 374.5 | 359.4 | 543.9 | 620.7 | −0.7 | 5.2 |
| Malaysia | 542.3 | 471.4 | 497.4 | 386.0 | 448.9 | −10.7 | 3.7 |
| Mexico | 164.7 | 169.8 | 229.8 | 238.7 | 319.9 | 13.2 | 2.7 |
| Tunisia | 184.2 | 99.8 | 283.2 | 237.1 | 204.3 | 8.8 | 1.7 |
| India | 115.9 | 116.3 | 102.7 | 188.7 | 196.6 | 17.6 | 1.6 |
| France | 40.6 | 41.6 | 76.3 | 72.5 | 162.5 | 21.3 | 1.4 |
|
Source: Global Trade Tracker, 2023 *CAGR: Compound Annual Growth Rate |
|||||||
Canada's performance
United States imports from Canada
The U.S was the 2nd largest global market for cooking oils with imports valued at US$12.0 billion in 2022. Of these imports, Canada was the largest supplier (representing a 34.8% market share) with imports valued at US$4.2 billion in 2022. Top cooking oil imports from Canada were rape, colza or mustard oil and its fractions, (HS code: 1514) valued at US$3.9 billion, 2.0 billion kilograms, (93.5% market share), followed by soybean oil and its fractions (HS code: 1507) with values of US$180.7 million, 120.8 million kilograms (4.3% market share) and fixed vegetable fats and oils, incl.jojoba oil (HS code: 1515) valued at US$87.3 million, 83.3 million kilograms (2.09% market share) in 2022.
| HS Code | Description | Import value (US$M) | Import volume (million kilograms) | Market share % in value |
|---|---|---|---|---|
| Cooking Oil Total | 4,176.2 | 2,270.9 | 100.0 | |
| 1514 | rape, colza or mustard oil and fractions | 3,906.1 | 2,006.5 | 93.53 |
| 1507 | soya-bean oil and its fractions, | 180.7 | 120.8 | 4.33 |
| 1515 | fixed vegetable or microbial fats and oils, incl. jojoba oil, and their fractions, | 87.3 | 83.3 | 2.09 |
| 1512 | sunflower-seed, safflower or cotton-seed oil and fractions | 1.2 | 0.1 | 0.03 |
| 1513 | coconut "copra", palm kernel or babassu oil and fractions | 0.5 | 0.1 | 0.01 |
| 1511 | palm oil and its fractions, | 0.3 | 0.1 | 0.01 |
| 1509 | olive oil and its fractions | 0.1 | 0.0 | 0.00 |
| 1508 | groundnut oil and its fractions, | 0.0 | 0.0 | 0.00 |
| Source: Global Trade Tracker, 2023 | ||||
Canada's export market
In 2022, Canada exported US$5.2 billion, 2.9 billion kilograms of cooking oils to global markets. The U.S was the largest export market for Canadian cooking oils (81.5% market share) valued at US$4.2 billion, 2.3 billion kilograms, followed by Mexico (6.5% market share) with values of US$336.0 million, 187.6 million kilograms and China (5.6% market share) valued at US$288.6 million, 186.4 million kilograms in 2022.
| Country | Export value (US$ M) | Export volume (million kilograms) | Market share in value 2022 |
|---|---|---|---|
| Global Total | 5,175.6 | 2,871.6 | 100.0 |
| United States | 4,219.1 | 2,277.6 | 81.5 |
| Mexico | 336.0 | 187.6 | 6.5 |
| China | 288.6 | 186.4 | 5.6 |
| South Korea | 146.3 | 98.1 | 2.8 |
| Chile | 75.5 | 53.9 | 1.5 |
| Japan | 38.4 | 23.4 | 0.7 |
| Taiwan | 15.4 | 10.2 | 0.3 |
| Hong Kong | 13.4 | 8.5 | 0.3 |
| Colombia | 11.5 | 8.2 | 0.2 |
| United Arab Emirates | 8.0 | 5.6 | 0.2 |
| Source: Global Trade Tracker, 2023 | |||
The U.S was the largest export market for Canadian cooking oils in 2022. The top supplying Canadian provinces to the U.S market were Saskatchewan, Manitoba and Alberta occupying market shares of 51.2%, 17.7% and 16.4% respectively in 2022. Top cooking oil exports from Canada to the U.S were rape, colza or mustard oil and its fractions (HS code: 1514) with values of US$2.2 billion, 2.1 billion kilograms, followed by soybean oil and its fractions (HS:1507) valued at US$124.7 million, 120.9 million kilograms, and fixed vegetable fats and oils, incl.jojoba oil (HS code: 1515) with values of US$99.7 million, 83.8 million kilograms in 2022.
| HS code | Description | Export value (US$M) | Export volume (million kilograms) | Top provincial suppliers and market value share (%) | ||
|---|---|---|---|---|---|---|
| Cooking Oils total | 4,219.2 | 2,277.4 | Saskatchewan: 51.2 | Manitoba: 17.7 | Alberta: 16.4 | |
| 1514 | Rape, colza or mustard oil and its fractions | 2,153.9 | 2,066.4 | Saskatchewan: 55.2 | Manitoba: 18.9 | Alberta: 17.5 |
| 1507 | Soybean oil and its fractions | 124.7 | 120.9 | Ontario: 69.0 | Québec: 28.4 | Manitoba: 2.4 |
| 1515 | Fixed vegetable fats and oils, incl.jojoba oil | 99.7 | 83.8 | Ontario: 74.1 | Saskatchewan: 6.9 | Alberta: 6.3 |
| 1513 | Palm kernel oil and its fractions | 23.6 | 3.5 | Ontario: 98.7 | Alberta: 0.9 | British Columbia: 0.4 |
| 1512 | Sunflower, safflower seed oil | 5.2 | 1.2 | Ontario: 82.7 | Alberta: 17.3 | |
| 1509 | Olive oil and its fractions | 4.3 | 1.0 | Ontario: 100.0 | ||
| 1511 | Palm oil and its fractions | 1.8 | 0.5 | Ontario: 100.0 | ||
| 1510 | Other oils and their fractions | 0.2 | 0.1 | Ontario: 100.0 | ||
| 1508 | Groundnut oil and its fractions | 0.1 | 0.9 | Ontario: 100.0 | ||
| Source: Global Trade Tracker, 2023 | ||||||
Retail markets
Global retail sales of cooking oils
Global retail sales of cooking oils have increased moderately in CAGR by 7.5% from US$84.4 billion in 2017 to US$121.0 billion in 2022 and are expected to increase at a CAGR of 6.4% as retail sales attain US$164.7 billion by 2027. India was the largest global market for cooking oils with retail sales of US$24.6 billion (20.4% market share), followed by China with values of US$17.8 billion (14.7% market share) and Brazil, with retail sales of US$6.5 billion (5.4% market share) in 2022.
The United States (U.S) was the 4th largest global retail sales market for cooking oils with values of US$5.4 billion, representing a 4.4% market share in 2022. The U.S experienced an increase in CAGR of 8.1% as retail sales grew from US$3.6 billion in 2017 and are expected to further improve with an increase in CAGR of 5.7% in the forecast period as retail sales are anticipated to achieve US$7.1 billion by 2027. In comparison, Canada was the forty-seventh largest retail sales market for cooking oils, accounting for a 0.4% retail sale market share with values of US$513.9 million in 2022. Similarly, Canada is also expected to achieve positive growth with an increase in CAGR of 5.7% in the forecast period as retail sales attain US$676.8 million by 2027.
| Geography | 2017 | 2022 | CAGR* % 2017-2022 | 2023 | 2027 | CAGR* % 2022-2027 | Market share % 2022 |
|---|---|---|---|---|---|---|---|
| World | 84,379.1 | 120,972.7 | 7.5 | 128,497.3 | 164,662.2 | 6.4 | 100.0 |
| India | 12,333.7 | 24,645.1 | 14.8 | 27,634.3 | 40,408.7 | 10.4 | 20.4 |
| China | 14,826.7 | 17,754.9 | 3.7 | 18,100.7 | 20,810.3 | 3.2 | 14.7 |
| Brazil | 2,257.1 | 6,571.8 | 23.8 | 7,216.4 | 9,602.8 | 7.9 | 5.4 |
| United States | 3,630.5 | 5,366.7 | 8.1 | 6,027.3 | 7,091.7 | 5.7 | 4.4 |
| Indonesia | 1,500.4 | 3,670.8 | 19.6 | 3,909.4 | 5,019.0 | 6.5 | 3.0 |
| Russia | 1,664.6 | 3,008.1 | 12.6 | 3,228.8 | 4,887.7 | 10.2 | 2.5 |
| Italy | 2,343.9 | 2,585.8 | 2.0 | 2,758.0 | 3,063.4 | 3.4 | 2.1 |
| Spain | 2,018.9 | 2,642.5 | 5.5 | 2,693.1 | 3,002.3 | 2.6 | 2.2 |
| Bangladesh | 1,279.1 | 2,378.1 | 13.2 | 2,200.2 | 2,610.6 | 1.9 | 2.0 |
| Japan | 1,172.0 | 1,635.6 | 6.9 | 1,716.4 | 1,921.9 | 3.3 | 1.4 |
| Canada 47 | 373.0 | 513.9 | 6.6 | 554.9 | 676.8 | 5.7 | 0.4 |
|
Source: Euromonitor International, 2023 *CAGR: Compound Annual Growth Rate |
|||||||
United States retail sales of cooking oil
The top three cooking oil categories in the U.S, in terms of retail value sales in 2022, were olive oil with values of US$2.0 billion (37.9% market share) increasing at a CAGR of 8.7% from US$1.3 billion in 2017, followed by soy oil valued at US$1.5 billion (27.7% market share), representing an increase in CAGR of 6.9% from US$1.1 billion in 2017 and rapeseed oil with values of US$713.5 million (13.3% market share) and increasing in CAGR by 6.7% from US$514.8 million in 2017.
| Category | 2017 | 2018 | 2019 | 2020 | 2021 | 2022 | Market share % |
|---|---|---|---|---|---|---|---|
| Cooking Oils (total) | 3,630.5 | 3,664.3 | 3,697.1 | 4,482.0 | 4,366.3 | 5,366.7 | 100.0 |
| Olive Oil | 1,344.9 | 1,385.0 | 1,416.1 | 1,733.1 | 1,769.1 | 2,036.6 | 37.9 |
| Corn Oil | 414.1 | 416.9 | 419.1 | 512.5 | 462.4 | 664.6 | 12.4 |
| Rapeseed Oil | 514.8 | 506.8 | 501.2 | 618.8 | 593.0 | 713.5 | 13.3 |
| Soy Oil | 1,068.7 | 1,070.3 | 1,074.3 | 1,267.9 | 1,202.6 | 1,488.8 | 27.7 |
| Other Edible Oil[1] | 288.0 | 285.3 | 286.4 | 349.6 | 339.2 | 463.2 | 8.6 |
|
Source: Euromonitor International, 2023 1: Other edible oil includes vegetable and seed oil such as coconut oil, grapeseed oil, groundnut oil, sesame oil and walnut oil, as well as blended oils which contain less than 50% of any single type of oils broken down into the researched oil categories. |
|||||||
| Category | Annual growth % 2021-2022 | CAGR* % 2017-2022 | Total growth % 2017-2022 |
|---|---|---|---|
| Cooking Oils (total) | 22.9 | 8.1 | 47.8 |
| Olive Oil | 15.1 | 8.7 | 51.4 |
| Corn Oil | 43.7 | 9.9 | 60.5 |
| Rapeseed Oil | 20.3 | 6.7 | 38.6 |
| Soy Oil | 23.8 | 6.9 | 39.3 |
| Other Edible Oil | 36.6 | 10.0 | 60.8 |
|
Source: Euromonitor International, 2023 *CAGR: Compound Annual Growth Rate |
|||
Growth in the cooking oil category is expected to be strongly positive with a larger CAGR of 5.7% as retail sales reach US$7.1 billion by 2027. Relatedly, all cooking oil categories are expected to attain larger CAGR's in the forecast period. Olive oil in particular, is expected to increase in CAGR by 6.7% achieving US$2.8 billion by 2027, while corn oil is also expected to perform well attaining an increase in CAGR of 5.3% with values of US$860.4 million by 2027.
| Category | 2023 | 2024 | 2025 | 2026 | 2027 |
|---|---|---|---|---|---|
| Cooking Oils (total) | 6,027.3 | 6,287.2 | 6,539.2 | 6,805.8 | 7,091.7 |
| Olive Oil | 2,354.7 | 2,429.5 | 2,557.5 | 2,687.9 | 2,818.4 |
| Corn Oil | 754.7 | 809.3 | 826.2 | 842.2 | 860.4 |
| Rapeseed Oil | 788.2 | 815.4 | 840.7 | 874.6 | 916.8 |
| Soy Oil | 1,641.7 | 1,719.9 | 1,782.9 | 1,854.2 | 1,932.9 |
| Other Edible Oil | 488.0 | 513.1 | 531.8 | 546.9 | 563.2 |
| Source: Euromonitor International, 2023 | |||||
| Category | Annual growth % 2022-2023 | CAGR* % 2022-2027 | Total growth % 2022-2027 |
|---|---|---|---|
| Cooking Oils (total) | 4.2 | 5.7 | 32.1 |
| Olive Oil | 4.9 | 6.7 | 38.4 |
| Corn Oil | 2.2 | 5.3 | 29.5 |
| Rapeseed Oil | 4.8 | 5.1 | 28.5 |
| Soy Oil | 4.2 | 5.4 | 29.8 |
| Other Edible Oil | 3.0 | 4.0 | 21.6 |
|
Source: Euromonitor International, 2023 *CAGR: Compound Annual Growth Rate |
|||
Competitive landscape
The U.S cooking oil market remained a fragmented industry throughout 2017 to 2022. ConAgra Brands Inc (Brand name; Pam and Wesson) was the largest cooking oil company in the U.S with retail sales of US$546.8 million (10.2% market share), while Deoleo SA (Brand name; Bertolli), the second largest cooking oil company, attained US$381.1 million (7.1% market share) in 2022. Private label cooking oil companies continue to show a strong presence in the cooking oils market with retail sales of US$2.0 billion (36.8% market share) in 2022, increasing their total market share slightly since 2017.
| Company | Retail sales (US$ millions) | Market share % |
|---|---|---|
| Total | 5,366.7 | 100.0 |
| ConAgra Brands Inc | 546.8 | 10.2 |
| Deoleo SA | 381.1 | 7.1 |
| B & G Foods Inc | 276.9 | 5.2 |
| Associated British Foods Plc | 276.5 | 5.2 |
| Bright Food (Group) Co Ltd | 211.0 | 3.9 |
| Pompeian Inc | 207.3 | 3.9 |
| California Olive Ranch Inc | 182.1 | 3.4 |
| Industria Alimentare Colavita SpA | 65.2 | 1.2 |
| Private Label | 1,975.6 | 36.8 |
| Others | 1,244.1 | 23.2 |
| Source: Euromonitor International, 2023 | ||
Retail distribution channels; cooking oil product sector (off-trade)
The majority of the U.S's cooking oil market is distributed through store-based retailing versus non-store retailing. Store-based retailing for cooking oils accounted for a 90.0% market share in 2022, declining from 96.8% held in 2017, while non-store retailing, e-commerce in particular, increased its market share representation to 10.0% in 2022, growing from 3.2% held in 2017. Further, within store-based retailing, hypermarkets and supermarkets were the predominant distribution channels for cooking oils representing market shares of 38.7% and 37.2% respectively, in 2022.
| Outlet Type | 2017 | 2022 | ||
|---|---|---|---|---|
| Actual | Share % | Actual | Share % | |
| Total | 3,630.5 | 100.0 | 5,366.7 | 100.0 |
| Retail Channels | 3,630.5 | 100.0 | 5,366.7 | 100.0 |
| Retail Offline | 3,515.4 | 96.8 | 4,804.8 | 90.0 |
| Grocery Retailers | 3,513.0 | 96.8 | 4,801.3 | 89.9 |
| Convenience Stores | 54.9 | 1.5 | 69.8 | 1.3 |
| Supermarkets | 1,481.3 | 40.8 | 1,988.6 | 37.2 |
| Hypermarkets | 1,492.1 | 41.1 | 2,064.3 | 38.7 |
| Discounters | 137.9 | 3.8 | 196.7 | 3.7 |
| Warehouse Clubs | 130.6 | 3.6 | 198.3 | 3.7 |
| Small Local Grocers | 216.3 | 6.0 | 283.6 | 5.3 |
| Non-Grocery Retailers | 2.4 | 0.1 | 3.5 | 0.1 |
| Health and Beauty Specialists | 2.4 | 0.1 | 3.5 | 0.1 |
| Retail E-Commerce | 115.1 | 3.2 | 561.9 | 10.0 |
| Source: Euromonitor International, 2023 | ||||
New product launch analysis
The pandemic changed how consumers approach their health, shifting emphasis from reactive 'quick-fixes' to a more holistic and long-term approach to building one's health and wellness. For many, making dietary changes has helped them to feel more in control and protected against potential ill health. In fact, 41% of U.S consumers agree that changes in their diets and eating habits have helped them feel more in control of their health, (Mintel, July 2022).
According to Mintel's Global New Products Database (GNPD), there were 1,108 new cooking oil products launched in the U.S between January 2018 and December 2022. The number of yearly product launches has increased by a CAGR of 7.6% from the launch of 202 cooking oil products in 2018 to its most recent launch of 271 cooking oil products in 2022.
Spectrum Culinary, Signature Select and Giant Eagle were top brands of newly released cooking oil product launches while kosher (782 products), GMO free (408 products) and Organic (305 products) were top claims. Top price groupings for cooking oils in $USD were $0.99 - 8.98, followed by $0.99 - 4.98 and $8.99 - 12.98.
Bottle (816 products), Aerosol (190), and jar (54 products) were the predominant package types released, while new variety/range extension (396 products), new packaging (390 products) and new product (256 products) launch types were the leading product attributes of new products released between January 2018 and December 2022.
Unflavoured/plain, Garlic and Roasted/Toasted were top flavours (including blends), while Extra Virgin Olive Oil, Low Erucic Acid Rapeseed Oil and Coconut Oil were top ingredients identified during this period.
| Product attributes | Yearly launch counts | Total | ||||
|---|---|---|---|---|---|---|
| 2018 | 2019 | 2020 | 2021 | 2022 | ||
| Yearly product launches | 202 | 197 | 236 | 202 | 271 | 1108 |
| Top brands | ||||||
| Spectrum Culinary | 22 | 8 | 4 | 2 | 3 | 39 |
| Signature Select | 9 | 3 | 3 | 2 | 5 | 22 |
| Giant Eagle | 4 | 7 | 0 | 5 | 5 | 21 |
| Bertolli | 5 | 3 | 5 | 2 | 6 | 21 |
| Good & Gather | 0 | 0 | 16 | 0 | 0 | 16 |
| Top claims | ||||||
| Kosher | 163 | 120 | 172 | 138 | 169 | 762 |
| GMO Free | 84 | 70 | 84 | 72 | 98 | 408 |
| Organic | 57 | 53 | 71 | 56 | 68 | 305 |
| Low/No/Reduced Allergen | 38 | 44 | 35 | 41 | 53 | 211 |
| Gluten Free | 37 | 40 | 29 | 39 | 39 | 184 |
| Top price groupings (US dollars) | ||||||
| 4.99 - 8.98 | 64 | 56 | 55 | 54 | 78 | 307 |
| 0.99 - 4.98 | 82 | 47 | 67 | 51 | 59 | 306 |
| 8.99 - 12.98 | 28 | 40 | 41 | 39 | 48 | 196 |
| 12.99 - 16.98 | 17 | 28 | 27 | 28 | 41 | 141 |
| 16.99 - 24.00 | 10 | 19 | 24 | 18 | 32 | 103 |
| Imported status | ||||||
| Not imported | 72 | 73 | 119 | 101 | 139 | 504 |
| Imported | 22 | 29 | 10 | 10 | 21 | 92 |
| Top packaged types | ||||||
| Bottle | 135 | 146 | 172 | 150 | 213 | 816 |
| Aerosol | 52 | 33 | 31 | 33 | 41 | 190 |
| Jar | 10 | 7 | 17 | 9 | 11 | 54 |
| Can | 2 | 3 | 14 | 10 | 6 | 35 |
| Flexible stand-up pouch | 0 | 3 | 0 | 0 | 0 | 3 |
| Top launch types | ||||||
| New Variety/Range Extension | 69 | 68 | 60 | 80 | 119 | 396 |
| New Packaging | 79 | 64 | 88 | 72 | 87 | 390 |
| New Product | 30 | 60 | 75 | 40 | 51 | 256 |
| Relaunch | 23 | 5 | 13 | 10 | 14 | 65 |
| New Formulation | 1 | 0 | 0 | 0 | 0 | 1 |
| Top flavours (including blend) | ||||||
| Unflavoured/Plain | 184 | 132 | 208 | 163 | 203 | 890 |
| Garlic | 1 | 9 | 3 | 5 | 10 | 28 |
| Roasted/Toasted | 0 | 4 | 4 | 4 | 6 | 18 |
| Black Truffle (Mushroom) | 0 | 1 | 4 | 5 | 5 | 15 |
| Butter | 5 | 5 | 1 | 2 | 2 | 15 |
| Top ingredients | ||||||
| Extra Virgin Olive Oil (Food) | 65 | 86 | 94 | 102 | 129 | 476 |
| Low Erucic Acid Rapeseed Oil (Food) | 34 | 24 | 19 | 12 | 20 | 109 |
| Coconut Oil (Food) | 25 | 14 | 28 | 16 | 12 | 95 |
| Soy Lecithin (Food) | 39 | 14 | 14 | 13 | 12 | 92 |
| Avocado Oil (Food) | 13 | 14 | 26 | 12 | 25 | 90 |
| Source: Mintel GNPD, 2023 | ||||||
Examples of new products
Vegetable Oil
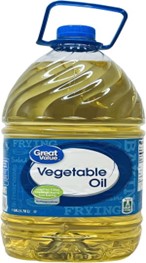
Source: Mintel Global New Products Database, 2023
| Company | Walmart |
|---|---|
| Brand | Great Value |
| Category | Sauces and seasonings |
| Sub-category | Oils |
| Market | United States |
| Store name | Walmart |
| Store type | Mass merchandise / hypermarket |
| Date published | December 2022 |
| Launch type | New packaging |
| Price in local currency | $8.17 |
| Price in Euros | 7.76 |
Great Value Vegetable Oil has been repackaged, and now retails in a redesigned 1-gallon pack. - Great for salad, dressings, frying and baking - No preservatives - Gluten free - Logos and certifications: Kosher, Great for You.
Extra Virgin Olive Oil
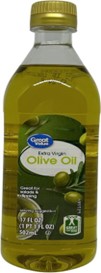
Source: Mintel Global New Products Database, 2023
| Company | Walmart |
|---|---|
| Brand | Great Value |
| Category | Sauces and seasonings |
| Sub-category | Oils |
| Market | United States |
| Store name | Walmart |
| Store type | Mass merchandise / hypermarket |
| Date published | December 2022 |
| Launch type | New packaging |
| Price in local currency | $4.72 |
| Price in Euros | 4.54 |
Great Value Extra Virgin Olive Oil has been repackaged and retails in a 17 fluid ounce pack. - Great for salads and dipping - Logos and Certifications: Kosher, How2Recycle, Great for You.
Organic Toasted Sesame Oil
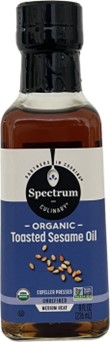
Source: Mintel Global New Products Database, 2023
| Company | Hain Celestial Group |
|---|---|
| Distributor | Hain Celestial Group |
| Brand | Spectrum Culinary |
| Category | Sauces and seasonings |
| Sub-category | Oils |
| Market | United States |
| Location of manufacture | Mexico |
| Import status | Imported product |
| Store name | Walmart |
| Store type | Mass merchandise / hypermarket |
| Date published | November 2022 |
| Launch type | New packaging |
| Price in local currency | $6.48 |
| Price in Euros | 6.26 |
Spectrum Culinary Organic Toasted Sesame Oil has been repackaged, and retails in an 8 fluid ounce container. - Expeller pressed unrefined - Medium heat - Logos and certifications: Kosher, USDA Organic, Non-GMO Project Verified
Canola Oil
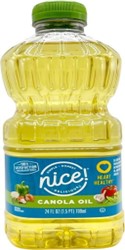
Source: Mintel Global New Products Database, 2023
| Company | Walgreen |
|---|---|
| Brand | Nice! |
| Category | Sauces and seasonings |
| Sub-category | Oils |
| Market | United States |
| Store name | Walgreens |
| Store type | Drug store /pharmacy |
| Date published | November 2022 |
| Launch type | New packaging |
| Price in local currency | $4.29 |
| Price in Euros | 4.31 |
Nice! Canola Oil has been repackaged and retails in a newly designed 24 fluid ounce pack. - Heart healthy - Limited and not conclusive scientific evidence suggests that eating about 1½ tablespoons (19 grams) of canola oil may reduce the risk of coronary heart disease due to the unsaturated fat content in canola oil - Canola oil is to replace a similar amount of saturated fat and not increase the total number of calories one eats in a day - One serving of the product contains 14 grams of canola oil- Contains 1.1 grams of high ALA per serving, which is 68% of the 1.6 grams daily value for ALA - Logos and certifications: Kosher, How2Recycle
Avocado Oil
Source: Mintel Global New Products Database, 2023
| Company | T&M Imports |
|---|---|
| Distributor | T&M Imports |
| Brand | Tantillo |
| Category | Sauces and seasonings |
| Sub-category | Oils |
| Market | United States |
| Store name | Safeway |
| Store type | Supermarket |
| Date published | November 2022 |
| Launch type | New packaging |
| Price in local currency | $15.99 |
| Price in Euros | 16.05 |
Tantillo Avocado Oil has been repackaged, and retails in a newly designed 33.8 fluid ounce pack. - For high heat cooking - Buttery and smooth - Contains avocado oil from Mexico, Spain or California- Bottled in California - High heat natural wonder - Extracted from the fruit by cold-pressing, and then carefully refined to create a clean, fresh oil - Suitable for sautéing, frying, grilling or baking - The extremely high smoke point of 500°F will keep this avocado oil from breaking down in high heat conditions - Packed with powerful anti-oxidants and loaded with heart-healthy monounsaturated fat - With its smooth and buttery flavor, and health forward properties, this oil will present itself as a perfect match to any recipe - Logos and certifications: Kosher, Non GMO Project Verified
For more information
The Canadian Trade Commissioner Service:
International Trade Commissioners can provide Canadian industry with on-the-ground expertise regarding market potential, current conditions and local business contacts, and are an excellent point of contact for export advice.
More agri-food market intelligence:
International agri-food market intelligence
Discover global agriculture and food opportunities, the complete library of Global Analysis reports, market trends and forecasts, and information on Canada's free trade agreements.
Agri-food market intelligence service
Canadian agri-food and seafood businesses can take advantage of a customized service of reports and analysis, and join our email subscription service to have the latest reports delivered directly to their inbox.
More on Canada's agriculture and agri-food sectors:
Canada's agriculture sectors
Information on the agriculture industry by sector. Data on international markets. Initiatives to support awareness of the industry in Canada. How the department engages with the industry.
For additional information on the Private Label Manufacturers Association's annual trade show, please contact:
Chris Bigall
Trade Commissioner
chris.bigall@international.gc.ca
Resources
- Euromonitor International 2023
- Euromonitor International:
- Country Report. Edible Oils in the U.S, December 2022.
- Global Trade Tracker, 2023
- Mintel Global New Products Database, 2023
- Mintel, A year of innovation in butter, spreads and oils, July 4, 2022.
Sector Trend Analysis – Cooking oil trends in the United States
Global Analysis Report
Prepared by: Hongli Wang, Market Analyst
© His Majesty the King in Right of Canada, represented by the Minister of Agriculture and Agri-Food (2024).
Photo credits
All photographs reproduced in this publication are used by permission of the rights holders.
All images, unless otherwise noted, are copyright His Majesty the King in Right of Canada.
To join our distribution list or to suggest additional report topics or markets, please contact:
Agriculture and Agri-Food Canada, Global Analysis1341 Baseline Rd, Tower 5, 3rd floor
Ottawa ON K1A 0C5
Canada
Email: aafc.mas-sam.aac@agr.gc.ca
The Government of Canada has prepared this report based on primary and secondary sources of information. Although every effort has been made to ensure that the information is accurate, Agriculture and Agri-Food Canada (AAFC) assumes no liability for any actions taken based on the information contained herein.
Reproduction or redistribution of this document, in whole or in part, must include acknowledgement of agriculture and agri-food Canada as the owner of the copyright in the document, through a reference citing AAFC, the title of the document and the year. Where the reproduction or redistribution includes data from this document, it must also include an acknowledgement of the specific data source(s), as noted in this document.
Agriculture and Agri-Food Canada provides this document and other report services to agriculture and food industry clients free of charge.