

Note: This report includes forecasting data that is based on baseline historical data.
Executive summary
In 2021, Indonesia was the largest e-commerce market among the countries of Association of Southeast Asian Nations (ASEAN) with retail sales amounting to US$37.3 billion with a compound annual growth rate (CAGR) of 45.4% from 2017 to 2021. The country was expected to reach US$90.5 billion in 2026 with a CAGR of 17.1% from 2022 to 2026.
In the food and drink category, Indonesia was the first biggest e-grocery market in the ASEAN region with retail sales amounting to US$1.8 billion in 2021, representing 42.0% of market share in the region.
From 2016 to 2020, food and drink e-commerce was one of the most popular categories of e-commerce, witnessing robust growth in value sales. In 2021, Indonesian food and drink e-commerce sales reached US$1.8 billion and saw a CAGR of 64.4% from 2016 to 2020. Despite this significant growth, food and drink e-commerce continues to account for a minor part of e-commerce sales with a market share of 4.8% in 2021. In 2026, food and drink e-commerce sales are expected to reach US$5.6 billion with a CAGR of 21.0% over the forecast period.
In 2021, there were 140.6 million internet users (55.6% of the population) in Indonesia, in comparison with 77.7 million in 2017 (32.3% of the population). The total number of internet users in Indonesia grew at a CAGR of 16.0% from 2017-2021, and is expected to grow at a CAGR of 6.2% from 2022-2026, with total internet users reaching 193.2 million in 2026 (72.5% of the population).
Between January 2017 and December 2021, 4,464 food and drink products were launched online in Indonesia. The top categories of food and drink products offered were sauces and seasonings, snacks, bakery, hot beverages, and processed fish, meat and egg products.
Socioeconomic profile
Indonesia is the fourth most populous country in the world, with a population of approximately 273.5 million in 2020 (The World Bank, 2022). And the country will continue to be the third largest country in the Asia Pacific region as its population is expected to reach to 319 million in 2040 (Euromonitor International, 2020). Indonesia's large consumer base and expanding middle class should make it an increasingly attractive consumer market up to 2040 (Euromonitor International, 2020). Indonesia is made up of a diverse network of islands where 60% of the population is on Java, one of the most densely populated areas in the world.
Indonesia is the largest economy in Southeast Asia with a gross domestic product (GDP) of US$1.1 trillion in 2020 (The World Bank 2022). Indonesia's economy contracted sharply during the first half of 2020, due to global supply chain disruptions and the large-scale social restrictions triggered by Covid-19 pandemic (Bank Indonesia, 2021). Nonetheless, the Indonesian economy continued to recover in 2021 despite the downside impacts of the Covid-19 (The World Bank 2021). In 2021, the Indonesian economy achieved a full-year GDP growth of 3.7%, bouncing back from the 2.1% contraction in 2020 (ING Group, 2022). And the International Monetary Fund (IMF) expected that Indonesia GDP growth would accelerate to 5.6% in 2022 and 6.0% in 2023 (IMF, 2022).
The business environment continued to improve in Indonesia over 2021, including improving business freedom, expected increase of labour market flexibility, growing investment in transport infrastructure (Euromonitor International, 2022). However, the country's economic development continues to suffer from heavy bureaucracy, widespread corruption and low levels of innovation.
Due to the concerns of income, job availability, and business activity, the Indonesian consumer confidence index declined to 113.1 in February 2022 from 119.6 in January 2022(Bank Indonesia, 2021). This in turn drove a restrained growth retail sale in February 2022, as reflected by the moderation of real sales index growth to 14.5% (year-over-year) from 15.2% (year-over-year) in January 2022(Bank Indonesia, 2021).
| Q1 2020 | Q2 2020 | Q3 2020 | Q4 2020 | Q1 2021 | Q2 2021 | Q3 2021 | Q4 2021 | Q1 2022 | Q2 2022 | Q3 2022 | Q4 2022 | |
|---|---|---|---|---|---|---|---|---|---|---|---|---|
| Recovery index | 105.5 | 89.3 | 90.8 | 92.7 | 93.3 | 100.4 | 92.4 | 97.9 | 101.5 | 103.4 | 105.3 | 107.1 |
| Economic activity | 101.2 | 94.4 | 97.1 | 99.0 | 100.4 | 101.3 | 100.7 | 102.0 | 104.5 | 105.9 | 107.4 | 108.8 |
| Employment | 100.2 | 100.2 | 100.1 | 99.8 | 99.4 | 99.6 | 99.9 | 100.1 | 100.3 | 100.5 | 100.8 | 101.2 |
| Consumer spending | 101.3 | 94.6 | 96.0 | 97.5 | 98.9 | 100.4 | 97.1 | 98.4 | 102.3 | 103.4 | 104.4 | 105.3 |
| Retail sales | 103.9 | 100.2 | 99.8 | 101.0 | 102.5 | 104.2 | 103.4 | 105.1 | 108.4 | 110.8 | 113.6 | 116.0 |
| Consumer confidence | 139.7 | 17.0 | 23.9 | 33.5 | 30.3 | 90.7 | 21.3 | 66.7 | 79.0 | 85.8 | 91.6 | 98.1 |
| Source: Euromonitor International, March 15, 2022 | ||||||||||||
Note: Euromonitor's Recovery Index is a composite index that provides a quick overview of economic and consumer activity and helps business predict recovery in consumer demand in 48 major economies. The index takes into consideration total GDP and factors that determine consumer spend–employment, consumer spending, retail sales and consumer confidence. Index scores measure the change relative to the average per quarter for 2019, except for the Consumer Confidence Index, which is based on the long-term historical average with length depending on country data availability.
A score of 100 and over indicates a full recovery in which consumer demand return to 2019 levels.
Market trends
Over the past five years, the growing middle-class population, high internet, and mobile penetration rates, and the fast growth of fintech and alternative financing options were major contributors to the e-commerce surge in Indonesia (Euromonitor International 2022). In 2021, Indonesia was the largest e-commerce market among the countries of Association of Southeast Asian Nations (ASEAN) with retail sales amounting to US$37.3 billion with a CAGR of 45.4% from 2017 to 2021. The country was expected to reach US$90.5 billion in 2026 with a CAGR of 17.1% from 2022 to 2026.
| Market | 2017 | 2021 | CAGR* % 2017-2021 | 2022 | 2026 | CAGR* % 2022-2026 |
|---|---|---|---|---|---|---|
| Indonesia | 8,363.6 | 37,339.6 | 45.4 | 48,071.2 | 90,467.9 | 17.1 |
| Thailand | 1,903.0 | 10,110.4 | 51.8 | 13,299.9 | 28,969.1 | 21.5 |
| Vietnam | 2,420.2 | 6,110.5 | 26.1 | 7,447.1 | 13,869.9 | 16.8 |
| Philippines | 1,022.1 | 5,827.8 | 54.5 | 7,384.5 | 9,063.3 | 5.3 |
| Malaysia | 1,393.4 | 5,238.4 | 39.2 | 6,888.5 | 16,094.2 | 23.6 |
| Singapore | 1,574.7 | 4,032.5 | 26.5 | 4,754.0 | 7,296.0 | 11.3 |
| Brunei | 119.0 | 223.9 | 17.1 | 252.7 | 347.6 | 8.3 |
| Cambodia | 6.7 | 23.4 | 36.7 | 28.2 | 49.8 | 15.3 |
| Myanmar | 7.2 | 16.0 | 22.1 | 20.7 | 40.7 | 18.4 |
| Laos | 4.1 | 10.3 | 25.9 | 12.3 | 19.9 | 12.8 |
| Total | 16,814.0 | 68,932.8 | 42.3 | 88,159.1 | 166,218.4 | 17.2 |
|
Source: Euromonitor, 2022 *CAGR: Compound annual growth rate |
||||||
In the food and drink category, Indonesia was the first biggest e-grocery market in the ASEAN region with retail sales amounting to US$1.8 billion in 2021, representing 42.0% of market share in the region. The Indonesia e-grocery market registered a CAGR of 64.4% from 2017 to 2021.
Food and drink e-commerce already existed in Indonesia prior to the Covid-19, has accelerated its expansion during the pandemic as consumers appreciated the convenient and contactless grocery shopping experience provided by e-commerce. Consequently, main e-commerce players such as Tokopedia and Shopee recorded an increase in sales for food and beverages (Euromonitor International, 2022).
| Geography | 2017 | 2018 | 2019 | 2020 | 2021 | CAGR* % 2017-2021 |
|---|---|---|---|---|---|---|
| Indonesia | 247.0 | 354.3 | 589.2 | 1,196.3 | 1,803.2 | 64.4 |
| Philippines | 2.2 | 2.3 | 77.2 | 323.8 | 751.0 | 329.8 |
| Vietnam | 52.9 | 126.6 | 241.8 | 543.4 | 710.0 | 91.4 |
| Thailand | 253.1 | 296.3 | 343.5 | 436.3 | 498.1 | 18.4 |
| Malaysia | 102.9 | 132.4 | 157.8 | 265.8 | 318.5 | 32.6 |
| Singapore | 77.1 | 92.0 | 103.5 | 180.5 | 210.3 | 28.5 |
| Total | 735.2 | 1,003.9 | 1,513.0 | 2,946.1 | 4,291.1 | 55.4 |
|
Source: Euromonitor, 2022 *CAGR: Compound annual growth rate |
||||||
The Indonesia e-grocery sales will continue to increase at a CAGR of 21.0% from 2022 to 2026 reaching US$5.6 billion in 2026.
| Geography | 2022 | 2023 | 2024 | 2025 | 2026 | CAGR* % 2022-2026 |
|---|---|---|---|---|---|---|
| Indonesia | 2,603.8 | 3,394.9 | 4,076.5 | 4,828.3 | 5,589.9 | 21.0 |
| Philippines | 1,047.7 | 1,254.4 | 1,412.5 | 1,523.7 | 1,595.8 | 11.1 |
| Vietnam | 757.3 | 848.3 | 943.8 | 1,064.7 | 1,192.2 | 12.0 |
| Thailand | 588.4 | 677.6 | 782.1 | 920.4 | 1,047.6 | 15.5 |
| Malaysia | 374.1 | 427.2 | 475.4 | 528.3 | 586.7 | 11.9 |
| Singapore | 237.3 | 261.6 | 286.3 | 310.2 | 336.0 | 9.1 |
| Total | 5,608.6 | 6,864.0 | 7,976.6 | 9,175.6 | 10,348.2 | 16.5 |
|
Source: Euromonitor, 2022 *CAGR: Compound annual growth rate |
||||||
E-grocery readiness
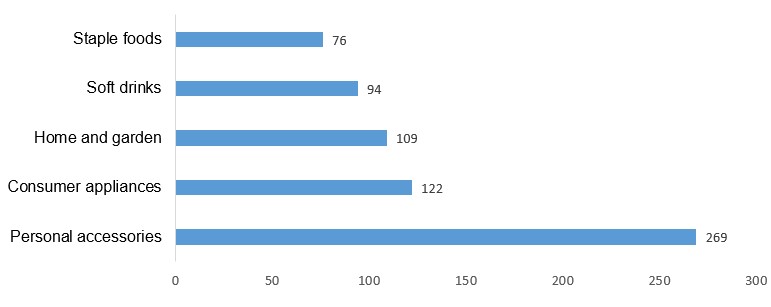
Based on the e-commerce readiness model developed by Euromonitor International, Indonesia's staple foods and soft drinks sectors have unrealized potential sales of US$ 76 million and US$ 94 million respectively on e-commerce platforms (Euromonitor International, 2022).
As Indonesia is returning to a more normal life, the convenience provided by e-commerce will become even more indispensable to consumers having busy modern lifestyles. And the increasing investments in infrastructure, cold chain, and logistics capabilities will benefit food and drink e-commerce in the next five years. Shorter delivery times and lower shipping fees will also promote more impulse e-commerce purchases of food and drink beyond scheduled grocery deliveries (Euromonitor International, 2022).
Description of above image
| Industry | Unrealized e-commerce value potential, US$ million |
|---|---|
| Staple foods | 76 |
| Soft drinks | 94 |
| Home and garden | 109 |
| Consumer appliances | 122 |
| Personal accessories | 269 |
Source: Euromonitor's e-commerce readiness model March 2021. The potential calculated base on the last complete year: 2019
Note: The primary output of this Euromonitor's e-commerce readiness model is a predicted share of e-commerce that could have been supported by the market in 2019 before COVID-19 became a global pandemic. The difference between this predicted share and actual share of e-commerce signals which countries and categories had the most unrealised ecommerce potential before the pandemic and are thus most likely to show sustained e-commerce growth afterwards.
E-commerce value potential: Difference between predicted e-commerce sales from the E-Commerce Readiness Model and actual e-commerce sales
E-commerce market sizes
In 2021, store-based retailing accounted for 70.6% (US$ 94.3 billion) of all retail sales in Indonesia, while non-store retailing accounted for 29.6% (US$39.3 billion). E-commerce of goods was the largest category of non-store retailing, with US$37.3 billion in sales. This accounts for 95.1% of non-store retail sales, and 28.0% of all retail sales. E-commerce is expected to grow at a CAGR of 17.1% from 2022 to 2026, reaching US$90.5 billion in 2026.
From 2016 to 2020, food and drink e-commerce was one of the most popular categories of e-commerce, witnessing robust growth in value sales. In 2021, Indonesian food and drink e-commerce sales reached US$1.8 billion and saw a CAGR of 64.4% from 2016 to 2020. Despite this significant growth, food and drink e-commerce continues to account for a minor part of e-commerce sales with a market share of 4.8% in 2021. In 2026, food and drink e-commerce sales are expected to reach US$5.6 billion with a CAGR of 21.0% over the forecast period.
| Category | 2017 | 2021 | CAGR* % 2017-2021 | 2022 | 2026 | CAGR* % 2022-2026 |
|---|---|---|---|---|---|---|
| Total retailing | 158,214.2 | 133,517.4 | −4.2 | 159,728.2 | 242,737.7 | 11.0 |
| Store-based retailing | 147,931.9 | 94,257.1 | −10.7 | 109,630.3 | 149,892.7 | 8.1 |
| Non-store retailing | 10,282.3 | 39,260.2 | 39.8 | 50,098.0 | 92,845.0 | 16.7 |
| E-commerce (goods) | 8,363.6 | 37,339.6 | 45.4 | 48,071.2 | 90,467.9 | 17.1 |
| Food and drink e-commerce | 247.0 | 1,803.2 | 64.4 | 2,603.8 | 5,589.9 | 21.0 |
|
Source: Euromonitor, 2022 *CAGR: Compound annual growth rate |
||||||
Within the food and drink e-commerce, packaged food made up 76.9% of the sectors' online sales in 2021, while the remaining 23.1% are estimated to come from drinks. In 2021, Indonesian total online sales of packaged foods, and drinks reached US$800.3 million with a CAGR of 92.3% from 2017 to 2021. As consumers are increasingly using online shopping for packaged non-perishable foods during the pandemic, the sales growth rate for all of the sub-categories of packaged foods and drinks increased significantly from 2019 to 2021.
| Category | 2017 | 2018 | 2019 | 2020 | 2021 | CAGR* % 2017-2021 |
|---|---|---|---|---|---|---|
| Packaged food | 31.9 | 59.8 | 140.2 | 350.3 | 615.6 | 109.6 |
| Cooking ingredients and meals | 8.5 | 9.7 | 34.1 | 72.9 | 141.2 | 101.9 |
| Edible oils | 7.5 | 8.5 | 31.8 | 60.7 | 109.4 | 95.4 |
| Ready meals | 0.2 | 0.4 | 0.6 | N/C | ||
| Sauces, dressings and condiments | 0.9 | 1.1 | 1.8 | 11.2 | 30.1 | 140.5 |
| Sweet zpreads | 0.1 | 0.1 | 0.3 | 0.5 | 1.2 | 86.1 |
| Dairy products and alternatives | 11.1 | 16.0 | 25.6 | 83.1 | 125.2 | 83.3 |
| Baby food | 5.7 | 8.4 | 14.9 | 56.3 | 79.7 | 93.4 |
| Dairy | 5.3 | 7.6 | 10.7 | 26.8 | 45.5 | 71.2 |
| Snacks | 2.7 | 22.7 | 33.9 | 62.5 | 81.2 | 134.2 |
| Confectionery | 1.9 | 2.0 | 2.5 | 5.6 | 8.3 | 44.6 |
| Ice cream and frozen desserts | 0.0 | 0.2 | N/C | |||
| Savoury snacks | 19.8 | 30.2 | 53.7 | 67.5 | N/C | |
| Sweet biscuits, snack bars and fruit snacks | 0.9 | 0.9 | 1.2 | 3.2 | 5.2 | 55.0 |
| Staple foods | 9.6 | 11.4 | 46.6 | 131.8 | 268.0 | 129.9 |
| Baked goods | 2.5 | 2.6 | 7.6 | 15.6 | 30.4 | 86.7 |
| Breakfast cereals | 0.0 | 0.1 | 0.1 | 0.3 | 0.5 | N/C |
| Processed fruit and vegetables | 0.0 | 0.1 | 0.1 | N/C | ||
| Processed meat, seafood and alternatives to meat | 1.0 | 2.9 | 5.0 | N/C | ||
| Rice, pasta and noodles | 7.1 | 8.8 | 37.9 | 113.0 | 231.9 | 139.1 |
| Drinks | 26.6 | 32.3 | 40.7 | 147.1 | 184.7 | 62.3 |
| Alcoholic drinks | 5.3 | 9.9 | 14.4 | 21.4 | N/C | |
| Hot drinks | 17.1 | 17.3 | 18.2 | 88.6 | 125.5 | 64.6 |
| Soft drinks | 4.2 | 5.1 | 8.1 | 37.1 | 59.2 | 93.8 |
|
Source: Euromonitor, 2022 *CAGR: Compound annual growth rate N/C: Not calculable |
||||||
Key e-commerce retailers
In Indonesia, 85.2% of e-commerce sales were made from the top-ten companies in 2021. Tokopedia PT was the biggest e-commerce retailer in 2021, reaching sales at US$12.9 billion with a market share of 34.5%. Sea Ltd was the second biggest retailer in 2021, reaching sales at US$11.4 billion with a market share of 30.5%. Alibaba Group Holding Ltd was the third biggest retailer in 2021, reaching sales at US$3.5 billion with a market share of 9.3%.
| Company Name | 2017 | 2018 | 2019 | 2020 | 2021 | CAGR* % 2017-2021 |
|---|---|---|---|---|---|---|
| Total | 8,363.6 | 11,974.2 | 17,809.8 | 27,723.5 | 37,339.6 | 45.4 |
| Tokopedia PT | 395.2 | 2,332.4 | 4,784.7 | 7,839.2 | 12,883.0 | 138.9 |
| Sea Ltd | 253.2 | 1,241.8 | 3,838.4 | 8,432.6 | 11,404.9 | 159.1 |
| Alibaba Group Holding Ltd | 646.5 | 912.3 | 2,515.5 | 3,090.5 | 3,456.8 | 52.1 |
| Bukalapak.com PT | 335.8 | 1,230.6 | 1,262.4 | 2,270.0 | 2,766.7 | 69.4 |
| Djarum Group | 125.0 | 276.1 | 310.0 | 323.4 | 348.8 | 29.2 |
| Rocket Internet AG | 157.0 | 191.9 | 248.1 | 283.3 | 325.1 | 20.0 |
| JD.com Inc | 64.1 | 132.9 | 250.9 | 260.5 | 279.2 | 44.5 |
| Giosis Group | 141.1 | 158.9 | 176.0 | 181.0 | 192.1 | 8.0 |
| Erajaya Swasembada Tbk PT | 52.5 | 65.7 | 87.6 | 93.5 | 103.1 | 18.4 |
| Bhinneka Mentari Dimensi PT | 65.9 | 68.1 | 73.4 | 74.7 | 78.6 | 4.5 |
| Others | 6,127.3 | 5,363.5 | 4,262.8 | 4,874.8 | 5,501.3 | −2.7 |
|
Source: Euromonitor, 2022 *CAGR: Compound annual growth rate |
||||||
| Company Name | 2017 | 2018 | 2019 | 2020 | 2021 | CAGR* % 2017-2021 |
|---|---|---|---|---|---|---|
| Total | 100.0 | 100.0 | 100.0 | 100.0 | 100.0 | |
| Tokopedia PT | 4.7 | 19.5 | 26.9 | 28.3 | 34.5 | 64.6 |
| Sea Ltd | 3.0 | 10.4 | 21.6 | 30.4 | 30.5 | 78.6 |
| Alibaba Group Holding Ltd | 7.7 | 7.6 | 14.1 | 11.1 | 9.3 | 4.8 |
| Bukalapak.com PT | 4.0 | 10.3 | 7.1 | 8.2 | 7.4 | 16.6 |
| Djarum Group | 1.5 | 2.3 | 1.7 | 1.2 | 0.9 | −12.0 |
| Rocket Internet AG | 1.9 | 1.6 | 1.4 | 1.0 | 0.9 | −17.0 |
| JD.com Inc | 0.8 | 1.1 | 1.4 | 0.9 | 0.7 | −3.3 |
| Giosis Group | 1.7 | 1.3 | 1.0 | 0.7 | 0.5 | −26.4 |
| Erajaya Swasembada Tbk PT | 0.6 | 0.5 | 0.5 | 0.3 | 0.3 | −15.9 |
| Bhinneka Mentari Dimensi PT | 0.8 | 0.6 | 0.4 | 0.3 | 0.2 | −29.3 |
| Others | 73.3 | 44.8 | 23.9 | 17.6 | 14.8 | −33.0 |
|
Source: Euromonitor, 2022 *CAGR: Compound annual growth rate |
||||||
Digital landscape in Indonesia
In 2021, there were 140.6 million internet users (55.6% of the population) in Indonesia, in comparison with 77.7 million in 2017 (32.3% of the population). The total number of internet users in Indonesia grew at a CAGR of 16.0% from 2017 to 2021, and is expected to grow at a CAGR of 6.2% from 2022-2026, with total internet users reaching 193.2 million in 2026 (72.5% of the population). In 2021 66.5% of the population accessed the internet daily, while 69.0% accessed the internet at least once a week. In 2021, 76.7% of households had access to the internet, a significant increase from the 57.3% that had access in 2017. The proportion of households that have access to the internet is expected to grow at a CAGR of 1.6% from 2022-2026, reaching 83.2% by 2026. In 2021, 16.6% of Indonesian accessed the internet through a mobile phone, compared with 11.2% who did so with a laptop, notebook, or tablet.
In 2021, 2.6% of Indonesian used the internet for selling goods and services, and 1.1% used the internet for online banking. 99.7% of Indonesian were covered by a mobile cell network, and 98.2% had LTE/WiMax coverage or higher. There were 367.6 million mobile telephone subscribers, which is expected to reach 431.3 million by 2026, growing at a CAGR of 3.2% from 2022-2026.
| Category (unit) | 2017 | 2021 | CAGR* % 2017-2021 | 2022 | 2026 | CAGR* % 2022-2026 |
|---|---|---|---|---|---|---|
| Internet Users ('000) | 77,675.3 | 140,630.4 | 16.0 | 151,815.2 | 193,167.4 | 6.2 |
| Population using the internet (%) | 32.3 | 55.6 | 14.5 | 59.3 | 72.5 | 5.2 |
| Population using the internet from home/workplace (%) | 19.6 | 36.6 | 16.9 | 41.0 | 57.4 | 8.8 |
| Households with access to internet (%) | 57.3 | 76.7 | 7.6 | 78.2 | 83.2 | 1.6 |
| Households with access to broadband internet (%) | 26.9 | 41.0 | 11.1 | 43.1 | 51.3 | 4.5 |
| Frequency of internet access: daily (%) | 20.1 | 42.9 | 20.9 | 47.6 | 64.7 | 8.0 |
| Internet use: internet banking (%) | 0.5 | 1.1 | 21.8 | |||
| Internet use: selling goods/services (%) | 1.0 | 2.6 | 27.0 | |||
| Access internet: via laptop, notebook, tablet (%) | 10.3 | 11.2 | 2.1 | |||
| Access internet: via mobile phone (%) | 12.6 | 16.6 | 7.1 | |||
| Internet subscribers ('000) | 267,267.9 | 288,202.1 | 1.9 | 301,151.3 | 351,626.5 | 3.9 |
| Fixed narrowband subscribers ('000) | 1,510.1 | 1,129.0 | −7.0 | 1,017.7 | 560.8 | −13.8 |
| Fixed broadband subscribers ('000) | 6,215.9 | 12,155.1 | 18.3 | 13,461.3 | 17,338.4 | 6.5 |
| Wireless broadband subscribers ('000) | 259,541.9 | 274,918.0 | 1.4 | 286,672.3 | 333,727.3 | 3.9 |
| Mobile telephone subscribers ('000) | 435,193.6 | 367,570.0 | −4.1 | 379,753.9 | 431,349.0 | 3.2 |
| Population covered by mobile-cell network (%) | 98.6 | 99.7 | 0.3 | 99.8 | 100.0 | 0.1 |
| Population covered by ≥3G mobile network (%) | 93.8 | 98.9 | 1.3 | 99.2 | 99.8 | 0.2 |
| Population covered by ≥LTE/WiMax network (%) | 90.4 | 98.2 | 2.1 | 98.5 | 99.2 | 0.2 |
|
Source: Euromonitor, 2022 *CAGR: Compound annual growth rate |
||||||
In 2021, mobile telephone ownership in Indonesia was nearly universal, with 92.4% of households owning a mobile telephone. 71.7% of households owned a smartphone, having increased from 51.0% in 2017 (CAGR of 8.9%). The percentage of households that own smartphones is expected to grow at a CAGR of 3.4% from 2022-2026, reaching 86.6% of households by 2026. Laptop ownership was less common, with 17.7% of households owning a laptop, expected to rise to 25.9% by 2026. 23.1% of households owned a personal computer in 2021, expected to rise to 28.6% by 2026, while 13.6% owned a tabled, expected to rise to 23.1% by 2026.
| Category (% of households) | 2017 | 2021 | CAGR* % 2017-2021 | 2022 | 2026 | CAGR* % 2022-2026 |
|---|---|---|---|---|---|---|
| Possession of mobile telephone | 89.0 | 92.4 | 0.9 | 93.1 | 95.4 | 0.6 |
| Possession of personal computer | 19.1 | 23.1 | 4.9 | 24.2 | 28.6 | 4.3 |
| Possession of laptop | 11.5 | 17.7 | 11.4 | 19.3 | 25.9 | 7.6 |
| Possession of smartphone | 51.0 | 71.7 | 8.9 | 75.7 | 86.6 | 3.4 |
| Possession of tablet | 6.2 | 13.6 | 21.7 | 15.6 | 23.1 | 10.3 |
|
Source: Euromonitor, 2022 *CAGR: Compound Annual Growth Rate |
||||||
Trade overview and opportunities for Canada
In 2021, Canada was the 29th biggest consumer-oriented agri-food products exporter to Indonesia, reaching US$12.7 million in 2021 with a CAGR of −7.6% from 2017 to 2021.
| 2017 | 2018 | 2019 | 2020 | 2021 | CAGR* % 2017-2021 | |
|---|---|---|---|---|---|---|
| World | 5,018.5 | 5,151.5 | 5,756.3 | 5,398.2 | 6,328.2 | 6.0 |
| China | 1,330.5 | 1,253.2 | 1,485.5 | 1,467.6 | 1,528.6 | 3.5 |
| Australia | 526.5 | 539.4 | 618.9 | 532.5 | 720.6 | 8.2 |
| United States | 450.6 | 482.9 | 602.7 | 643.7 | 673.3 | 10.6 |
| New Zealand | 453.9 | 440.5 | 471.4 | 510.7 | 629.5 | 8.5 |
| India | 229.2 | 419.8 | 444.7 | 407.8 | 451.5 | 18.5 |
| Singapore | 386.6 | 366.0 | 349.9 | 336.5 | 398.2 | 0.7 |
| Malaysia | 376.8 | 382.4 | 332.2 | 276.2 | 357.0 | −1.3 |
| Thailand | 243.2 | 236.1 | 286.3 | 248.0 | 304.7 | 5.8 |
| Belgium | 87.2 | 94.1 | 130.0 | 112.6 | 169.7 | 18.1 |
| France | 139.1 | 129.3 | 115.6 | 94.4 | 162.6 | 4.0 |
| Canada (29th) | 17.4 | 16.8 | 14.5 | 10.2 | 12.7 | −7.6 |
|
Source: Global Trade Tracker, 2022 *CAGR: Compound annual growth rate |
||||||
In 2021, food preparations, milk and cream in solid forms and frozen French fries were the top-three consumer-oriented agri-food products that Canada exported to Indonesia. Among the top-ten products, sweet biscuits recorded the highest growth at CAGR of 51.4 % from 2017 to 2021.
| HS Code | Description | 2017 | 2018 | 2019 | 2020 | 2021 | CAGR* % 2017-2021 |
|---|---|---|---|---|---|---|---|
| 210690 | food preparations, not elsewhere specified | 1,786,553 | 2,488,884 | 1,915,113 | 2,640,044 | 3,439,209 | 17.8 |
| 040210 | milk and cream in solid forms, fat content <= 1,5% | 5,876,321 | 5,825,486 | 6,699,528 | 3,767,571 | 2,941,224 | −15.9 |
| 200410 | frozen French fries | 5,453,686 | 4,776,604 | 3,695,708 | 874,713 | 2,296,552 | −19.4 |
| 070190 | fresh or chilled potatoes | 1,458,600 | 2,115,566 | 569,686 | 1,642,683 | 2,010,114 | 8.4 |
| 190190 | food preparations of flour, meal, starch, malt extract or milk products | 0 | 0 | 0 | 0 | 522,737 | |
| 230910 | dog or cat food | 450,378 | 376,658 | 185,329 | 475,467 | 484,752 | 1.9 |
| 070110 | seed potatoes | 0 | 234,240 | 15,389 | 292,759 | 484,024 | 27.4 |
| 080929 | fresh cherries | 93,856 | 152,010 | 0 | 41,892 | 189,013 | 19.1 |
| 190531 | sweet biscuits | 16,391 | 15,763 | 52,594 | 74,184 | 86,066 | 51.4 |
| 210390 | preparations for sauces and prepared sauces; mixed condiments and seasonings | 48,384 | 131,804 | 158,346 | 82,174 | 60,159 | 5.6 |
|
Source: Global Trade Tracker, 2022 *CAGR: Compound annual growth rate |
|||||||
Trade assistance for Canadian exporters
Canada Agriculture and Food Trade Commissioner Service (TCS) can help companies who are looking to start doing business online with customers abroad, or who are already selling internationally. TCS' CanExport for Small and Medium Sized Enterprises (will be opening in April 2022) offers up to $50,000 to:
- help you break into international markets
- cover some costs related to digital adoption such as adaptation and translation of marketing tools
- search engine optimization
- expert advice from legal and business experts
- intellectual property protection
Source: Government of Canada, September 2020
Canada' trade commissioner service has created following resources for Canadian agri-trade practitioners aiming to sell their products online internationally:
Export Development Canada (EDC) has built Export Help Hub which is "a collection of free, reliable resources about international sales, up-to-date market insights, regulations on customs, taxes and logistics and other related topics. With EDC's US market expertise, Canadian exporters will get trustable information about customs, market research, paying taxes, setting up US operations and more" (EDC, 2021)
Business Development Bank of Canada (BDC) provides e-commerce toolkit and suite of solutions to help Canadian entrepreneurs with various projects related to their online presence. Plus, BDC can finance the cost of its advisory services ( BDC, 2021).
Canada Post offers e-commerce solutions and resources for Canadian exporters. Its e-commerce service can "help you turn online browsers into buyers, use your inventory more effectively, give your customers a great receiving experience, and build loyalty with them by offering easy returns" (Post Canada, 2021).
Product launch analysis
Between January 2017 and December 2021, 4,464 food and drink products were launched online in Indonesia. The top categories of food and drink products offered were sauces and seasonings, snacks, bakery, hot beverages, and processed fish, meat and egg products. The top claims (may contain more than one claim per package) were social media, halal, no additives/preservatives, free from added/artificial preservatives, and organic. The top five companies were BeOrganik, House of Organix, Oma Elly, Nutrifood, and Kylafood. The top three storage types were shelf stable, frozen and chilled.
| Product attributes | Yearly launch count | ||||
|---|---|---|---|---|---|
| 2017 | 2018 | 2019 | 2020 | 2021 | |
| Yearly product launches | 6 | 22 | 296 | 1659 | 2481 |
| Top five categories | |||||
| Sauces and seasonings | 0 | 1 | 51 | 269 | 419 |
| Snacks | 0 | 4 | 65 | 182 | 277 |
| Bakery | 0 | 0 | 22 | 161 | 317 |
| Hot beverages | 0 | 0 | 65 | 169 | 241 |
| Processed fish, meat and egg products | 0 | 0 | 20 | 121 | 128 |
| Top five claims | |||||
| Social media | 1 | 11 | 86 | 719 | 1258 |
| Halal | 3 | 13 | 139 | 720 | 965 |
| No additives/preservatives | 1 | 3 | 56 | 513 | 713 |
| Free from added/artificial preservatives | 0 | 3 | 45 | 398 | 575 |
| Organic | 1 | 1 | 15 | 242 | 433 |
| Top five companies | |||||
| BeOrganik | 0 | 0 | 0 | 0 | 173 |
| House of Organix | 0 | 0 | 9 | 76 | 71 |
| Oma Elly | 0 | 0 | 0 | 0 | 40 |
| Nutrifood | 0 | 0 | 1 | 1 | 37 |
| Kylafood | 0 | 0 | 0 | 13 | 25 |
| Top five launch types | |||||
| New product | 2 | 15 | 269 | 1068 | 1433 |
| New variety/range extension | 2 | 6 | 13 | 361 | 684 |
| New packaging | 2 | 1 | 13 | 193 | 297 |
| Relaunch | 0 | 0 | 1 | 34 | 62 |
| New formulation | 0 | 0 | 0 | 3 | 5 |
| Top five price groups (US dollars) | |||||
| 0.03 - 5.02 | 6 | 19 | 244 | 1240 | 1768 |
| 5.03 - 10.02 | 0 | 2 | 39 | 328 | 467 |
| 10.03 - 15.02 | 0 | 0 | 5 | 64 | 148 |
| 15.03 - 20.02 | 0 | 0 | 3 | 15 | 59 |
| 20.03 - 27.00 | 0 | 1 | 5 | 11 | 39 |
| Top three storage types | |||||
| Shelf stable | 6 | 22 | 283 | 1258 | 1954 |
| Frozen | 0 | 0 | 8 | 187 | 277 |
| Chilled | 0 | 0 | 5 | 214 | 250 |
|
Source: Mintel Global New Products Database, 2022 Note: The online food and drinks products are defined as food and drink products ordered from internet/mail: this option is used to identify products available through online (web-based) retailers or through mail-order catalogs |
|||||
Product launch examples
Creamy Vanilla Flavoured Milk Powder

Source: Mintel Global New Products Database, 2022
| Company | Sarihusada Generasi Mahardhika |
|---|---|
| Brand | SGM Family Yummi-Nutri |
| Category | Dairy |
| Store name | www.shopee.co.id |
| Store type | Internet / mail order |
| Date published | April 2022 |
| Launch type | New product |
| Price in US dollars | 4.67 |
SGM Family Yummi-Nutri Susu Bubuk Rasa Vanila (Creamy Vanilla Flavoured Milk Powder) is formulated with Pro-Gress Maxx formula which is said to provide the following nutrients: IronC, a combination of iron and vitamin C; fish oil with DHA; high in zinc and vitamin D; high in vitamin C to help contribute to the normal functioning of the immune system; high in calcium, which helps in the formation and density maintenance of bones and teeth; and high in vitamins A, E, B1, B3, B5, B6, B9, to help meet the nutritional needs of the family. The halal certified product retails in a 690 gram pack featuring recipe suggestions, the Bangga Buatan Indonesia (Proudly Indonesian Made) logo and QR codes.
Tom Yum Shirataki Noodles
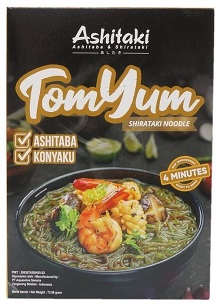
Source: Mintel Global New Products Database, 2022
| Company | Aquasolve Sanaria |
|---|---|
| Brand | Ashitaki Ashitaba & Shirataki |
| Category | Meals and Meal Centers |
| Store name | www.tokopedia.com |
| Store type | Internet / mail order |
| Date published | March 2022 |
| Launch type | New formulation |
| Price in US dollars | 1.54 |
Ashitaki Ashitaba & Shirataki Tom Yum Shirataki Noodles are said to have been improved, and can be prepared in four minutes. The microwaveable product is made with ashitaba and konjac, and retails in a 73.58 gram pack featuring WhatsApp and Instagram logos, a QR code and cooking instructions.
Choco Nut Granola Cereal

Source: Mintel Global New Products Database, 2022
| Company | Indospirit Natura |
|---|---|
| Brand | Healthy Choice |
| Category | Breakfast cereals |
| Store name | www.shopee.co.id |
| Store type | Internet / mail order |
| Date published | March 2022 |
| Launch type | New product |
| Price in US dollars | 4.40 |
Healthy Choice Choco Nut Granola Cereal is described as a delicious and nutritious cereal mix made from a combination of premium rolled oats, almond nuts, corn flakes, cashew, sunflower seeds and dark chocolate, with honey as sweetener. This low-calorie, vegan-friendly and 100% local product is rich in fibre and protein, contains no preservatives or added sugar, and retails in a 300 gram pack featuring the Bangga Buatan Indonesia (Proudly Indonesian Made) logo.
Norwegian Smoked Salmon

Source: Mintel Global New Products Database, 2022
| Company | Brødr. Remø |
|---|---|
| Brand | Brødr. Remø Stormy |
| Category | Processed fish |
| Location of manufacture | Norway |
| Import Status | Imported product |
| Store name | www.tokopedia.com |
| Store type | Internet / mail order |
| Date published | March 2020 |
| Launch type | New product |
| Price in US dollars | 22.03 |
Brødr. Remø Stormy Norwegian Smoked Salmon is said to be made from the freshest Norwegian salmon, raised in some of cleanest sea water, Norwegian fjord. The kosher certified award-winning product is smoked and packed in Norway in a modern smoke-house, following original hand-craft recipes under strict government hygiene control, and is free from artificial colours, flavours, nitrate and preservatives. According to the manufacturer the salting, curing and smoking create a natural preservative. It is a source of omega 3, and retails in a 0.692 kilogram pack bearing serving suggestions.
Canola Oil

Source: Mintel Global New Products Database, 2022
| Company | Dinamik Multi Sukses |
|---|---|
| Brand | Lily Flower |
| Category | Sauces and Seasonings |
| Store name | www.tokopedia.com |
| Store type | Internet / mail order |
| Date published | December 2021 |
| Launch type | New packaging |
| Price in US dollars | 17.40 |
Lily Flower Canola Oil has been repackaged. The product now retails in a newly designed 5 litre pack bearing a QR code.
Sirloin Steak with Montreal Spice Rub

Source: Mintel Global New Products Database, 2022
| Company | Bali Boga Sejati |
|---|---|
| Brand | Bali Boga Sejati |
| Category | Processed fish, meat and egg products |
| Store name | www.shopee.co.id |
| Store type | Internet / mail order |
| Date published | February 2022 |
| Launch type | New variety / range extension |
| Price in US dollars | 4.69 |
Metzger Sirloin Steak with Montreal Spice Rub is now available. This premium and halal certified product is said to be made from selected fresh meat and retails in a 200 gram pack with the NKV logo.
For more information
The Canadian Trade Commissioner Service:
International Trade Commissioners can provide Canadian industry with on-the-ground expertise regarding market potential, current conditions and local business contacts, and are an excellent point of contact for export advice.
More agri-food market intelligence:
International agri-food market intelligence
Discover global agriculture and food opportunities, the complete library of Global Analysis reports, market trends and forecasts, and information on Canada's free trade agreements.
Agri-food market intelligence service
Canadian agri-food and seafood businesses can take advantage of a customized service of reports and analysis, and join our email subscription service to have the latest reports delivered directly to their inbox.
More on Canada's agriculture and agri-food sectors:
Canada's agriculture sectors
Information on the agriculture industry by sector. Data on international markets. Initiatives to support awareness of the industry in Canada. How the department engages with the industry.
Resources
- Bank Indonesia, March 2021, 2020 economic report on Indonesia
- Bank Indonesia, March 2021, Consumer survey February 2022: consumer optimism remains solid
- Bank Indonesia, March 2021, Retail sales February 2022 : retail sales performance are expected to continuer with slightly restrained growth
- Business Development Bank of Canada, 2021, E-commerce and online presence
- Canadian Trade Commissioner Service, 2022
- Export Development Canada, 2021, Export Help Hub, Insights to guide smart export decisions
- Euromonitor International, 2020, Indonesia in 2040: the future demographic
- Euromonitor International, January 2022, Business Dynamics: Indonesia
- Euromonitor International, February 2022, E-Commerce (Goods) in Indonesia
- Euromonitor International, February 2022, Food and Drink E-Commerce in Indonesia
- Euromonitor, 2022, e-commerce readiness model
- Global Trade Tracker, 2022
- Government of Canada, September 2020, E-commerce Grow your global presence
- IMF, January 202, World economic outlook
- ING Group, February 2022, Indonesia's central bank keeps rates steady as expected, wary of recent Covid surge
- Mintel Global New Products Database, 2022.
- Post Canada, 2021, Enhance your e-commerce operations
- The Word Bank, December 2021, Indonesia's Economy Grew in 2021 Despite COVID-19, Will Accelerate in 2022, World Bank Report Says
- The Word Bank, March 2022, Population, total - Indonesia
- The Word Bank, March 2022, GDP – Indonesia
Sector Trend Analysis – E-commerce trends in Indonesia
Global Analysis Report
Prepared by: Zhiduo Wang, Market Analyst
© Her Majesty the Queen in Right of Canada, represented by the Minister of Agriculture and Agri-Food (2022).
Photo credits
All photographs reproduced in this publication are used by permission of the rights holders.
All images, unless otherwise noted, are copyright Her Majesty the Queen in Right of Canada.
To join our distribution list or to suggest additional report topics or markets, please contact:
Agriculture and Agri-Food Canada, Global Analysis1341 Baseline Rd, Tower 5, 3rd floor
Ottawa ON K1A 0C5
Canada
Email: aafc.mas-sam.aac@agr.gc.ca
The Government of Canada has prepared this report based on primary and secondary sources of information. Although every effort has been made to ensure that the information is accurate, Agriculture and Agri-Food Canada (AAFC) assumes no liability for any actions taken based on the information contained herein.
Reproduction or redistribution of this document, in whole or in part, must include acknowledgement of agriculture and agri-food Canada as the owner of the copyright in the document, through a reference citing AAFC, the title of the document and the year. Where the reproduction or redistribution includes data from this document, it must also include an acknowledgement of the specific data source(s), as noted in this document.
Agriculture and Agri-Food Canada provides this document and other report services to agriculture and food industry clients free of charge.