

Note: This report includes forecasting data that is based on baseline historical data.
Executive summary
Canada produced 0.9 million tonnes of fish and seafood, with a value of Can$5.0 billion in 2020. Over the last five years (2016 to 2020), the quantity produced decreased at a compound annual growth rate (CAGR) of 3.3%, while its value increased by 1.5%. In 2021, per household consumption of fish and seafood in Canada reached Can$314, representing an increase of CAGR at 5.6% from 2017 to 2021. Fish and seafood per household consumption is expected to increase to Can$348.1 in 2026 with a growth of CGAR at 2.1% from 2021 to 2026
With exports of Can$9.0 billion in 2021, Canada is the 5th largest fish and seafood exporter in the world. Canadian exports grew in value at a CAGR of 4.2% from 2017 to 2021. The U.S is by far Canada's largest export market, with a 70.3% market share in 2021. China is the second-largest market for Canadian and seafood, with a 12.6% share, followed by Japan (2.8%), Hong Kong (1.9%), and the United Kingdom (1.4%).
In Canada, total imports of fish and seafood grew at a 4.5% CAGR from 2017 to 2021, reaching Can$4.6 billion in value in 2021. The United States is by far Canada's largest supplier, with a 35.5% market share in 2021. China is the second-largest supplier of fish and seafood to Canada, with a 11.3% share, followed by Vietnam (6.7%), Chile (5.7%), and Thailand (5.3%).
Canada's total retail sales of fish and seafood grew in value at a CAGR of 5.5% from 2018 to 2022 and were valued at Can$5.4 billion in 2022. They are expected to increase at a rate of 3.5%, to Can$6.4 billion, by 2027.
In 2022, foodservice sales of processed fish and seafood in Canada reached a total volume of 66.7 thousand tonnes, increased at a CAGR of 0.04% (2018 to 2022). Foodservice sales are expected to increase at a rate of 3.42%, 78.9 thousand tonnes, by 2027.
In 2020, the top 10 processed fish and seafood companies in Canada accounted for 58.7% of the market.
According to Mintel's Global New Products Database (GNPD), there were 1,603 launches of processed fish products in Canada between January 2018 and December 2022.
Production and consumption trends
Global fish production, trade, and consumption all contracted strongly over the first half of 2020, whereby trends differed across species and products. The slight decline in production was driven by lower aquaculture output rather than capture fisheries that remained largely unchanged (Organisation for Economic Co-operation and Development, June 2022).
Canada produced 0.9 million tonnes of fish and seafood, with a value of Can$5.0 billion in 2020. Over the last five years (2016 to 2020), the quantity produced decreased at a CAGR of 3.3%, while its value increased by 1.5%.
| Fishing activity | 2016 | 2017 | 2018 | 2019 | 2020 | CAGR* % 2016-2020 |
|---|---|---|---|---|---|---|
| Total | 4,723 | 5,273 | 5,217 | 5,220 | 5,022 | 1.5 |
| Seafisheries | 3,301 | 3,797 | 3,707 | 3,921 | 3,921 | 4.4 |
| Freshwater fisheries | 74 | 84 | 78 | 68 | 58 | −6.1 |
| Aquaculture production | 1,347 | 1,392 | 1,432 | 1,231 | 1,043 | −6.2 |
|
Source: Fisheries and Oceans Canada, 2022 |
||||||
| Fishing activity | 2016 | 2017 | 2018 | 2019 | 2020 | CAGR* % 2016-2020 |
|---|---|---|---|---|---|---|
| Total | 1,079,112 | 1,042,621 | 1,027,517 | 1,033,142 | 945,474 | −3.3 |
| Seafisheries | 848,165 | 822,349 | 811,034 | 822,202 | 752,648 | −2.9 |
| Freshwater fisheries | 30,382 | 29,161 | 26,299 | 23,768 | 22,021 | −7.7 |
| Aquaculture production | 200,565 | 191,111 | 190,184 | 187,172 | 170,805 | −3.9 |
|
Source: Euromonitor International, 2022 *CAGR: Compound Annual Growth Rate |
||||||
In 2021, per household consumption of fish and seafood in Canada reached Can$314, representing an increase of CAGR at 5.6% from 2017 to 2021. Fish and seafood per household consumption is expected to increase to Can$348.1 in 2026 with a growth of CGAR at 2.1% from 2021 to 2026.
| Category | 2017 | 2021 | CAGR* % 2017-2021 | 2022 | 2026 | CAGR* % 2021-2026 |
|---|---|---|---|---|---|---|
| Fish and seafood | 252.5 | 314.0 | 5.6 | 341.6 | 348.1 | 2.1 |
|
Source: Euromonitor International, 2022 *CAGR: Compound Annual Growth Rate |
||||||
Trade overview
Exports
With exports of Can$9.0 billion in 2021, Canada is the 5th largest fish and seafood exporter in the world. Canadian exports grew in value at a CAGR of 4.2% from 2017 to 2021. Canada is projected to maintain a strong fish and seafood export balance in the medium term with overall net export value projected to increase by more than 40% by 2027 (Fisheries and Oceans Canada, December 2018).
| Country | 2017 | 2018 | 2019 | 2020 | 2021 | CAGR* % 2017-2021 | Market share % 2021 |
|---|---|---|---|---|---|---|---|
| World | 186.3 | 395.3 | 255.4 | 194.9 | 212.5 | 3.3 | 100.0 |
| China | 26.9 | 28.4 | 27.0 | 25.1 | 27.0 | 0.0 | 12.7 |
| Norway | 14.7 | 15.6 | 15.9 | 14.9 | 17.4 | 4.3 | 8.2 |
| India | 9.3 | 9.0 | 9.1 | 7.8 | 9.5 | 0.4 | 4.5 |
| Vietnam | 0.0 | 196.7 | 8.9 | 9.3 | 9.5 | N/C | 4.4 |
| Canada | 7.0 | 7.1 | 7.6 | 6.6 | 9.0 | 6.4 | 4.2 |
| Ecuador | 6.0 | 6.3 | 7.3 | 7.3 | 9.0 | 10.6 | 4.2 |
| Chile | 8.0 | 9.0 | 8.9 | 8.1 | 8.6 | 1.7 | 4.0 |
| Netherlands | 6.8 | 7.3 | 7.6 | 7.5 | 8.1 | 4.5 | 3.8 |
| Russia | 4.7 | 5.8 | 6.5 | 6.5 | 7.7 | 13.0 | 3.6 |
| United States | 8.1 | 8.1 | 7.7 | 6.6 | 7.2 | −2.8 | 3.4 |
|
Source: Global Trade Tracker, 2022 *CAGR: Compound Annual Growth Rate |
|||||||
Canada's total exports of fish and seafood grew at a 6.4% CAGR from 2017 to 2021, reaching Can$9.0 billion in value in 2021. The U.S is by far Canada's largest export market, with a 70.3% market share in 2021. China is the second-largest market for Canadian and seafood, with a 12.6% share, followed by Japan (2.8%), Hong Kong (1.9%), and the U.K (1.4%).
| Country | 2017 | 2018 | 2019 | 2020 | 2021 | CAGR* % 2017-2021 | Market share % 2021 |
|---|---|---|---|---|---|---|---|
| World | 7,011.4 | 7,089.5 | 7,608.0 | 6,617.6 | 8,976.0 | 6.4 | 100.0 |
| United States | 4,380.8 | 4,340.9 | 4,648.9 | 4,225.4 | 6,307.4 | 9.5 | 70.3 |
| China | 959.4 | 1,176.3 | 1,312.2 | 1,041.7 | 1,128.2 | 4.1 | 12.6 |
| Japan | 349.5 | 287.3 | 285.8 | 221.1 | 253.4 | −7.7 | 2.8 |
| Hong Kong | 199.8 | 195.5 | 251.3 | 135.7 | 173.1 | −3.5 | 1.9 |
| United Kingdom | 145.8 | 145.7 | 134.2 | 110.8 | 129.7 | −2.9 | 1.4 |
| South Korea | 107.9 | 121.4 | 121.8 | 106.3 | 129.1 | 4.6 | 1.4 |
| France | 73.0 | 64.3 | 82.1 | 80.7 | 83.9 | 3.5 | 0.9 |
| Belgium | 68.0 | 51.3 | 56.9 | 64.2 | 82.0 | 4.8 | 0.9 |
| Denmark | 97.5 | 81.2 | 91.9 | 65.6 | 72.0 | −7.3 | 0.8 |
| Spain | 43.8 | 42.5 | 47.6 | 51.8 | 71.2 | 12.9 | 0.8 |
|
Source: Global Trade Tracker, 2022 *CAGR: Compound Annual Growth Rate |
|||||||
In 2021, the top five commodities exported by Canada were frozen crabs (Can$2.0 billion), frozen lobsters (Can$1.4 billion), lobsters, live/ fresh/chilled (Can$1.2 billion), fresh/chilled atlantic salmon and danube salmon (Can$806.9 million), and lobster, prepared/ preserved (Can$668.4 million).
| HS code | Description | 2017 | 2018 | 2019 | 2020 | 2021 | CAGR* % 2017-2021 |
|---|---|---|---|---|---|---|---|
| Total | 7,011.4 | 7,089.5 | 7,608.0 | 6,617.6 | 8,976.0 | 6.4 | |
| 030614 | Frozen crabs | 1,320.5 | 1,132.0 | 1,259.3 | 1,160.0 | 1,966.5 | 10.5 |
| 030612 | Frozen lobsters | 828.3 | 913.9 | 1,067.1 | 794.4 | 1,353.9 | 13.1 |
| 030632 | Lobsters, live / fresh / chilled | 908.9 | 980.0 | 1,165.3 | 985.2 | 1,239.0 | 8.1 |
| 030214 | Fresh / chilled atlantic salmon and danube salmon | 778.4 | 814.7 | 774.1 | 681.8 | 806.9 | 0.9 |
| 160530 | lobster, prepared / preserved | 383.3 | 329.4 | 358.0 | 312.5 | 668.4 | 14.9 |
| 030616 | Frozen cold-water shrimps and prawns | 385.8 | 393.7 | 369.3 | 317.6 | 336.3 | −3.4 |
| 030633 | Crabs, live / fresh / chilled | 134.3 | 161.7 | 202.4 | 185.2 | 251.8 | 17.0 |
| 030441 | Fresh / chilled fillets of pacific salmon | 141.5 | 168.4 | 131.4 | 157.1 | 151.6 | 1.7 |
| 030221 | Fresh / chilled halibut | 114.6 | 120.0 | 128.9 | 122.1 | 150.1 | 7.0 |
| 030772 | Frozen clams | 83.9 | 101.4 | 114.3 | 90.0 | 101.3 | 4.8 |
|
Source: Global Trade Tracker, 2022 *CAGR: Compound Annual Growth Rate |
|||||||
| HS code | Description | 2017 | 2018 | 2019 | 2020 | 2021 | CAGR* % 2017-2021 |
|---|---|---|---|---|---|---|---|
| Total | 4,380.8 | 4,340.9 | 4,648.9 | 4,225.4 | 6,307.4 | 9.5 | |
| 030614 | Frozen crabs | 912.6 | 812.0 | 976.6 | 996.3 | 1,734.2 | 17.4 |
| 030612 | Frozen lobsters | 554.1 | 684.0 | 777.1 | 596.3 | 1,071.3 | 17.9 |
| 030214 | Fresh or chilled atlantic salmon and danube salmon | 733.5 | 728.4 | 725.3 | 653.0 | 775.3 | 1.4 |
|
Source: Global Trade Tracker, 2022 *CAGR: Compound Annual Growth Rate |
|||||||
| HS code | Description | 2017 | 2018 | 2019 | 2020 | 2021 | CAGR* % 2017-2021 |
|---|---|---|---|---|---|---|---|
| Total | 959.4 | 1,176.3 | 1,312.2 | 1,041.7 | 1,128.2 | 4.1 | |
| 030632 | Lobsters, live / fresh / chilled | 173.1 | 257.6 | 457.6 | 371.8 | 455.1 | 27.3 |
| 030616 | Frozen cold-water shrimps and prawn | 172.6 | 201.2 | 181.4 | 158.9 | 151.2 | −3.3 |
| 030633 | Crabs, whether in shell or not, live, fresh or chilled | 124.6 | 149.1 | 157.7 | 132.5 | 124.9 | 0.1 |
|
Source: Global Trade Tracker, 2022 *CAGR: Compound Annual Growth Rate |
|||||||
| HS code | Description | 2017 | 2018 | 2019 | 2020 | 2021 | CAGR* % 2017-2021 |
|---|---|---|---|---|---|---|---|
| Total | 349.5 | 287.3 | 285.8 | 221.1 | 253.4 | −7.7 | |
| 030614 | Frozen crabs | 112.9 | 60.2 | 65.5 | 37.2 | 73.2 | −10.3 |
| 030612 | Frozen lobsters | 41.3 | 27.7 | 42.6 | 20.1 | 17.3 | −19.5 |
| 030389 | Frozen fish | 14.8 | 14.5 | 12.8 | 12.5 | 17.0 | 3.6 |
|
Source: Global Trade Tracker, 2022 *CAGR: Compound Annual Growth Rate |
|||||||
| HS code | Description | 2017 | 2018 | 2019 | 2020 | 2021 | CAGR* % 2017-2021 |
|---|---|---|---|---|---|---|---|
| Total | 199.8 | 195.5 | 251.3 | 135.7 | 173.1 | −3.5 | |
| 030192 | Live eels | 37.4 | 80.1 | 137.2 | 48.8 | 62.9 | 13.9 |
| 030632 | lobsters, Live / fresh / chilled | 25.7 | 16.8 | 13.6 | 12.6 | 26.8 | 1.0 |
| 030771 | Live / fresh / chilled, clams | 13.8 | 16.8 | 17.8 | 23.7 | 24.2 | 15.1 |
|
Source: Global Trade Tracker, 2022 *CAGR: Compound Annual Growth Rate |
|||||||
| HS code | Description | 2017 | 2018 | 2019 | 2020 | 2021 | CAGR* % 2017-2021 |
|---|---|---|---|---|---|---|---|
| Total | 145.8 | 145.7 | 134.2 | 110.8 | 129.7 | −2.9 | |
| 030616 | Frozen cold-water shrimps | 38.3 | 20.6 | 17.1 | 12.0 | 33.3 | −3.5 |
| 030612 | Frozen lobsters | 4.5 | 4.6 | 8.7 | 6.9 | 23.1 | 50.1 |
| 160411 | Prepared/ preserved salmon | 34.0 | 49.3 | 42.2 | 46.6 | 18.5 | −14.2 |
|
Source: Global Trade Tracker, 2022 *CAGR: Compound Annual Growth Rate |
|||||||
Imports
With imports of Can$4.6 billion in 2021, Canada is the 14th largest fish and seafood importer in the world. Canadian imports grew in value at a CAGR of 4.5% from 2017 to 2021.
| Country | 2017 | 2018 | 2019 | 2020 | 2021 | CAGR* % 2017-2021 | Market share % 2021 |
|---|---|---|---|---|---|---|---|
| World | 191.3 | 212.4 | 214.3 | 200.3 | 216.2 | 3.1 | 100.0 |
| United States | 29.8 | 31.1 | 31.2 | 30.8 | 37.8 | 6.1 | 17.5 |
| China | 14.4 | 19.1 | 24.4 | 20.5 | 22.3 | 11.5 | 10.3 |
| Japan | 20.0 | 20.5 | 20.7 | 18.2 | 18.0 | −2.6 | 8.3 |
| Spain | 10.5 | 11.2 | 10.8 | 9.8 | 11.2 | 1.6 | 5.2 |
| France | 8.9 | 9.3 | 9.0 | 8.7 | 9.9 | 2.6 | 4.6 |
| Italy | 8.6 | 9.2 | 8.9 | 8.2 | 9.5 | 2.4 | 4.4 |
| Germany | 7.7 | 8.0 | 7.9 | 8.1 | 7.6 | −0.1 | 3.5 |
| South Korea | 6.8 | 7.9 | 7.6 | 7.4 | 7.6 | 2.9 | 3.5 |
| Sweden | 6.4 | 7.3 | 7.0 | 6.8 | 7.0 | 2.3 | 3.3 |
| Netherlands | 5.6 | 5.9 | 6.0 | 6.2 | 6.5 | 3.7 | 3.0 |
| Canada (14th) | 3.9 | 4.0 | 4.3 | 4.0 | 4.6 | 4.5 | 2.1 |
|
Source: Global Trade Tracker, 2022 *CAGR: Compound Annual Growth Rate |
|||||||
In Canada, total imports of fish and seafood grew at a 4.5% CAGR from 2017 to 2021, reaching Can$4.6 billion in value in 2021. The U.S is by far Canada's largest supplier, with a 35.5% market share in 2021. China is the second-largest supplier of fish and seafood to Canada, with a 11.3% share, followed by Vietnam (6.7%), Chile (5.7%), and Thailand (5.3%).
| Country | 2017 | 2018 | 2019 | 2020 | 2021 | CAGR* % 2017-2021 | Market share % 2021 |
|---|---|---|---|---|---|---|---|
| World | 3,897.6 | 4,005.3 | 4,317.9 | 3,984.3 | 4,638.9 | 4.5 | 100.0 |
| United States | 1,308.5 | 1,363.0 | 1,430.2 | 1,215.0 | 1,647.8 | 5.9 | 35.5 |
| China | 557.9 | 562.1 | 628.4 | 522.0 | 523.5 | −1.6 | 11.3 |
| Vietnam | 278.0 | 302.7 | 308.9 | 334.2 | 311.7 | 2.9 | 6.7 |
| Chile | 177.2 | 229.9 | 225.4 | 281.0 | 265.9 | 10.7 | 5.7 |
| Thailand | 348.7 | 317.8 | 319.4 | 280.1 | 244.9 | −8.5 | 5.3 |
| India | 194.5 | 197.9 | 178.9 | 188.6 | 235.0 | 4.8 | 5.1 |
| Norway | 118.3 | 99.3 | 140.9 | 133.4 | 171.5 | 9.7 | 3.7 |
| Peru | 139.6 | 110.8 | 134.5 | 153.8 | 167.0 | 4.6 | 3.6 |
| Russia | 46.1 | 54.9 | 67.7 | 93.8 | 119.6 | 26.9 | 2.6 |
| Indonesia | 48.2 | 58.0 | 62.7 | 75.0 | 83.1 | 14.6 | 1.8 |
|
Source: Global Trade Tracker, 2022 *CAGR: Compound Annual Growth Rate |
|||||||
In 2021, the top five commodities imported by Canada were lobsters, live/fresh/chilled (Can$531.6 million), frozen shrimps and prawns (Can$494.1 million), fresh/chilled fillets of pacific salmon (Can$270.3 million), prepared/preserved tunas, skipjack and atlantic bonito (Can$194.5 million), and fats and oils of fish (Can$184.4 million).
| HS code | Description | 2017 | 2018 | 2019 | 2020 | 2021 | CAGR* % 2017-2021 |
|---|---|---|---|---|---|---|---|
| Total | 3,897.6 | 4,005.3 | 4,317.9 | 3,984.3 | 4,638.9 | 4.5 | |
| 030632 | Lobsters, live / fresh / chilled | 289.0 | 382.5 | 407.9 | 277.2 | 531.6 | 16.5 |
| 030617 | Frozen shrimps and prawns | 498.6 | 459.3 | 439.4 | 435.8 | 494.1 | −0.2 |
| 030441 | Fresh / chilled fillets of pacific salmon | 169.4 | 195.9 | 193.0 | 229.8 | 270.3 | 12.4 |
| 160414 | Prepared / preserved tunas, skipjack and atlantic bonito | 192.6 | 217.6 | 215.1 | 223.3 | 194.5 | 0.3 |
| 150420 | Fats and oils of fish | 171.8 | 148.5 | 163.1 | 181.2 | 184.4 | 1.8 |
| 160521 | Shrimps and prawns, prepared / preserved | 179.0 | 178.5 | 175.1 | 174.5 | 169.0 | −1.4 |
| 030481 | Frozen fillets of pacific salmon | 123.7 | 147.1 | 140.9 | 138.2 | 161.1 | 6.8 |
| 160411 | Prepared / preserved salmon | 120.0 | 106.2 | 125.8 | 146.6 | 135.9 | 3.2 |
| 230120 | Flours, meals and pellets of fish or crustaceans, molluscs | 113.4 | 100.6 | 138.9 | 130.1 | 129.3 | 3.3 |
| 030214 | Fresh / chilled atlantic salmon and danube salmon | 85.7 | 103.0 | 113.1 | 96.9 | 128.2 | 10.6 |
|
Source: Global Trade Tracker, 2022 *CAGR: Compound Annual Growth Rate |
|||||||
| HS code | Description | 2017 | 2018 | 2019 | 2020 | 2021 | CAGR* % 2017-2021 |
|---|---|---|---|---|---|---|---|
| Total | 1,308.5 | 1,363.0 | 1,430.2 | 1,215.0 | 1,647.8 | 5.9 | |
| 030632 | Lobsters, live / fresh / chilled | 288.5 | 382.0 | 406.4 | 276.5 | 530.6 | 16.5 |
| 160411 | Prepared / preserved salmon | 110.5 | 97.7 | 106.0 | 125.8 | 115.0 | 1.0 |
| 030311 | Frozen sockeye salmon | 56.9 | 50.6 | 63.7 | 59.3 | 106.1 | 16.9 |
|
Source: Global Trade Tracker, 2022 *CAGR: Compound Annual Growth Rate |
|||||||
| HS code | Description | 2017 | 2018 | 2019 | 2020 | 2021 | CAGR* % 2017-2021 |
|---|---|---|---|---|---|---|---|
| Total | 557.9 | 562.1 | 628.4 | 522.0 | 523.5 | −1.6 | |
| 030617 | Frozen shrimps and prawns | 70.4 | 72.8 | 59.4 | 38.9 | 53.7 | −6.5 |
| 030472 | Frozen fillets of haddock | 34.6 | 38.2 | 48.1 | 44.5 | 45.4 | 7.0 |
| 030743 | Cuttle fish and squid, frozen | 38.4 | 41.1 | 48.0 | 29.1 | 34.0 | −3.0 |
|
Source: Global Trade Tracker, 2022 *CAGR: Compound Annual Growth Rate |
|||||||
| HS code | Description | 2017 | 2018 | 2019 | 2020 | 2021 | CAGR* % 2017-2021 |
|---|---|---|---|---|---|---|---|
| Total | 278.0 | 302.7 | 308.9 | 334.2 | 311.7 | 2.9 | |
| 030617 | Frozen shrimps and prawns | 114.2 | 117.4 | 116.2 | 133.2 | 118.9 | 1.0 |
| 160521 | Shrimps and prawns, prepared / preserved | 62.8 | 73.6 | 70.5 | 88.9 | 74.3 | 4.3 |
| 030462 | Frozen fillets of catfish | 33.7 | 37.3 | 33.6 | 23.6 | 22.0 | −10.2 |
|
Source: Global Trade Tracker, 2022 *CAGR: Compound Annual Growth Rate |
|||||||
| HS code | Description | 2017 | 2018 | 2019 | 2020 | 2021 | CAGR* % 2017-2021 |
|---|---|---|---|---|---|---|---|
| Total | 177.2 | 229.9 | 225.4 | 281.0 | 265.9 | 10.7 | |
| 030441 | Fresh or chilled fillets of pacific salmon | 67.8 | 101.2 | 68.4 | 104.9 | 125.0 | 16.5 |
| 030481 | Frozen fillets of pacific salmon | 52.6 | 65.9 | 69.0 | 75.1 | 75.8 | 9.6 |
| 030214 | Fresh or chilled atlantic salmon and danube salmon | 8.1 | 13.3 | 19.9 | 24.9 | 26.9 | 34.9 |
|
Source: Global Trade Tracker, 2022 *CAGR: Compound Annual Growth Rate |
|||||||
| HS code | Description | 2017 | 2018 | 2019 | 2020 | 2021 | CAGR* % 2017-2021 |
|---|---|---|---|---|---|---|---|
| Total | 348.7 | 317.8 | 319.4 | 280.1 | 244.9 | −8.5 | |
| 160414 | Prepared / preserved tunas, skipjack and atlantic bonito | 166.1 | 181.8 | 170.4 | 169.6 | 130.6 | −5.9 |
| 030617 | Frozen shrimps and prawns | 83.2 | 48.5 | 46.0 | 28.3 | 34.0 | −20.1 |
| 160521 | Shrimps and prawns, prepare / preserved | 47.2 | 29.7 | 26.6 | 22.0 | 16.9 | −22.6 |
|
Source: Global Trade Tracker, 2022 *CAGR: Compound Annual Growth Rate |
|||||||
Market sizes
Canada's total retail sales of fish and seafood grew in value at a CAGR of 5.5% from 2018 to 2022 and were valued at Can$5.4 billion in 2022. They are expected to increase at a rate of 3.5%, to Can$6.4 billion, by 2027. Fresh types consisting of fish, crustaceans, molluscs and cephalopods accounted for 62.7%, while processed seafood categories (shelf stable, frozen, chilled) accounted for the remaining 37.3% of value sales. Growing disposable income and rising health awareness have encouraged Canadian consumers to increase their spending on fish and seafood products (IBISWorld, August 2022).
| Category | 2018 | 2022 | CAGR* % 2018-2022 | 2023 | 2027 | CAGR* % 2022-2027 |
|---|---|---|---|---|---|---|
| Total | 4,377.7 | 5,432.0 | 5.5 | 5,670.5 | 6,442.5 | 3.5 |
| Fresh fish and seafood | 2,744.8 | 3,443.6 | 5.8 | 3,617.9 | 4,185.0 | 4.0 |
| Crustaceans | 613.6 | 780.6 | 6.2 | 819.7 | 946.6 | 3.9 |
| Fish | 1,308.9 | 1,718.6 | 7.0 | 1,813.9 | 2,105.3 | 4.1 |
| Molluscs and cephalopods | 822.3 | 944.4 | 3.5 | 984.3 | 1,133.1 | 3.7 |
| Processed seafood | 1,632.9 | 1,988.4 | 5.0 | 2,052.6 | 2,257.5 | 2.6 |
| Shelf stable seafood | 490.2 | 621.6 | 6.1 | 657.0 | 760.9 | 4.1 |
| Chilled processed seafood | 482.9 | 562.0 | 3.9 | 580.4 | 626.0 | 2.2 |
| Frozen processed seafood | 659.8 | 804.8 | 5.1 | 815.2 | 870.7 | 1.6 |
|
Source: Euromonitor International, 2021 *CAGR: Compound Annual Growth Rate |
||||||
In 2022, foodservice sales of processed fish and seafood in Canada reached a total volume of 66.7 thousand tonnes, increased at a CAGR of 0.04% (2018-2022). Foodservice sales are expected to increase at a rate of 3.42%, 78.9 thousand tonnes, by 2027.
| Category | 2018 | 2022 | CAGR* % 2018-2022 | 2023 | 2027 | CAGR* % 2022-2027 |
|---|---|---|---|---|---|---|
| Processed Seafood | 66.6 | 66.7 | 0.04 | 69.9 | 78.9 | 3.42 |
| Shelf Stable Seafood | 31.5 | 29.9 | −1.29 | 31.2 | 35.1 | 3.26 |
| Chilled Processed Seafood | 1.2 | 1.2 | 0.00 | 1.2 | 1.3 | 1.61 |
| Frozen Processed Seafood | 33.9 | 35.6 | 1.23 | 37.4 | 42.5 | 3.61 |
|
Source: Euromonitor International, 2021 *CAGR: Compound Annual Growth Rate |
||||||
Competitive landscape
In 2022, the top 10 processed fish and seafood companies in Canada accounted for 58.7% of the market.
High Liner Foods Inc, FCF Co Ltd and Jim Pattison Group were the top three companies in 2022. Tree of Life Canada ULC saw the largest growth (46.7%) in retail sales, from Can$3.8 million in 2018 to Can$17.6 million in 2022.
| Company Name | 2018 | 2019 | 2020 | 2021 | 2022 | CAGR* % 2018-2022 | Market share % 2022 |
|---|---|---|---|---|---|---|---|
| High Liner Foods Inc | 284.7 | 291.8 | 345.2 | 331.0 | 345.2 | 4.9 | 17.4 |
| FCF Co Ltd | 283.3 | 281.4 | 292.2 | N/C | 14.7 | ||
| Jim Pattison Group | 181.0 | 189.3 | 229.4 | 227.5 | 235.4 | 6.8 | 11.8 |
| Nippon Suisan Kaisha Ltd | 111.4 | 115.8 | 135.8 | 130.7 | 137.4 | 5.4 | 6.9 |
| Cooke Aquaculture Inc | 56.3 | 56.7 | 61.8 | 61.5 | 66.8 | 4.4 | 3.4 |
| Sofina Foods Inc | 30.5 | 32.4 | 40.3 | 39.1 | 40.4 | 7.3 | 2.0 |
| Oceanfood Sales Ltd | 21.9 | 22.6 | 23.9 | 23.9 | 26.0 | 4.4 | 1.3 |
| Tree of Life Canada ULC | 3.8 | 9.6 | 14.8 | 16.7 | 17.6 | 46.7 | 0.9 |
| Dom International Ltd | 2.7 | 2.7 | 3.0 | 3.0 | 3.4 | 5.9 | 0.2 |
| Grizzly Smokehouse Inc | 1.9 | 2.0 | 2.2 | 2.2 | 2.4 | 6.0 | 0.1 |
| Private Label | 384.7 | 390.9 | 435.8 | 429.6 | 442.4 | 3.6 | 22.2 |
| Others | 554.0 | 564.5 | 351.6 | 352.8 | 379.2 | −9.0 | 19.1 |
| Total | 1,632.9 | 1,678.3 | 1,927.1 | 1,899.4 | 1,988.4 | 5.0 | 100.0 |
|
Source: Euromonitor, 2022 *CAGR: Compound Annual Growth Rate N/C: not calculable |
|||||||
New product launch analysis
According to Mintel's Global New Products Database (GNPD), there were 1,603 launches of processed fish products in Canada between January 2018 and December 2022. In 2022, the top claims (may contain more than one claim per package) were ethical - environmentally friendly product, ethical - sustainable, ease of Use, ethical - animal, and Kosher.The top five brands were PC President's Choice, Clover Leaf, Kirkland Signature, Great Value, and Toppits. The top flavours were unflavoured / plain, smoke, cocktail sauce, lemon and pepper / peppercorn, garlic and herbs / herbal.
| Product attributes | Yearly launch count | ||||
|---|---|---|---|---|---|
| 2018 | 2019 | 2020 | 2021 | 2022 | |
| Yearly product launches | 370 | 325 | 268 | 380 | 260 |
| Top five claims | |||||
| Ethical - Environmentally Friendly Product | 141 | 123 | 121 | 166 | 128 |
| Ethical - Sustainable (Habitat/Resources) | 137 | 124 | 122 | 165 | 128 |
| Ease of Use | 94 | 85 | 71 | 80 | 43 |
| Ethical - Animal | 77 | 37 | 50 | 71 | 48 |
| Kosher | 69 | 43 | 51 | 64 | 41 |
| Imported status | |||||
| Imported | 245 | 182 | 162 | 247 | 134 |
| Not imported | 66 | 71 | 45 | 48 | 63 |
| Top five brands | |||||
| PC President's Choice | 24 | 6 | 11 | 14 | 6 |
| Clover Leaf | 23 | 6 | 7 | 4 | 4 |
| Kirkland Signature | 10 | 5 | 6 | 4 | 13 |
| Great Value | 6 | 9 | 6 | 2 | 13 |
| Toppits | 2 | 3 | 10 | 10 | 10 |
| Top five launch types | |||||
| New Variety/Range Extension | 191 | 141 | 123 | 194 | 101 |
| New Packaging | 111 | 91 | 101 | 126 | 122 |
| New Product | 52 | 84 | 37 | 51 | 33 |
| Relaunch | 16 | 9 | 6 | 8 | 4 |
| New Formulation | 0 | 0 | 1 | 1 | 0 |
| Top five flavours (including blend) | |||||
| Unflavoured/Plain | 242 | 235 | 177 | 236 | 186 |
| Smoke | 39 | 27 | 22 | 36 | 20 |
| Cocktail Sauce | 8 | 2 | 8 | 10 | 3 |
| Lemon and Pepper/Peppercorn | 5 | 3 | 4 | 2 | 3 |
| Garlic and Herbs/Herbal | 4 | 1 | 2 | 4 | 2 |
| Top store type | |||||
| Supermarket | 222 | 190 | 144 | 242 | 152 |
| Mass Merchandise/Hypermarket | 86 | 55 | 59 | 77 | 52 |
| Club Store | 46 | 18 | 28 | 18 | 33 |
| Natural/Health Food Store | 12 | 14 | 20 | 28 | 16 |
| Specialist Retailer | 1 | 48 | 13 | 14 | 7 |
| Top five price groups in US$ | |||||
| 4.76 - 8.75 | 87 | 91 | 73 | 118 | 68 |
| 8.76 - 12.75 | 86 | 82 | 47 | 78 | 49 |
| 0.76 - 4.75 | 96 | 53 | 41 | 91 | 40 |
| 12.76 - 16.75 | 50 | 56 | 37 | 48 | 38 |
| 16.76 - 25.00 | 23 | 27 | 34 | 21 | 30 |
|
Source: Mintel, 2023 |
|||||
Examples of new product launches
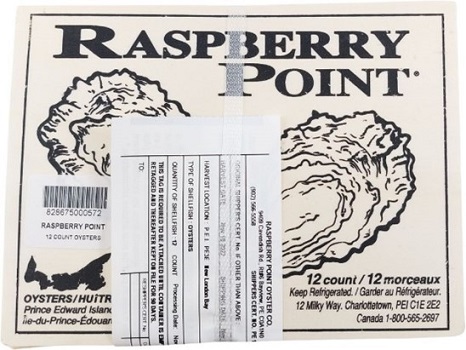
Prince Edward Island Oysters
Source: Mintel, 2023
| Company | Raspberry Point Oyster |
|---|---|
| Brand | Raspberry Point |
| Category | Processed fish, meat and egg products |
| Store name | Provigo |
| Store type | Supermarket |
| Date published | December 2022 |
| Launch type | New packaging |
| Price in local currency | Can$23.49 |
| Price in US dollars | 17.56 |
Raspberry Point Prince Edward Island Oysters have been repackaged, and retail in a newly designed 12-count pack.
Crunchy Breaded Haddock Fish Fillets

Source: Mintel, 2023
| Company | Bluewater Seafoods |
|---|---|
| Importer | Bluewater Seafoods |
| Brand | Blue Water Seafoods |
| Category | Processed fish, meat and egg products |
| Location of manufacture | United States |
| Import status | Imported product |
| Store name | IGA |
| Store type | Supermarket |
| Date published | November 2022 |
| Launch type | New packaging |
| Price in local currency | Can$18.49 |
| Price in US dollars | 13.72 |
Blue Water Seafoods Crunchy Breaded Haddock Fish Fillets have been repackaged, and retail in a 525 gram pack containing seven fillets. - Golden toasted breadcrumbs - Uncooked - Made with wild caught fish - A tasty topping to any salad - The freshest ideas in sustainable seafood - Resealable pack - Logos and certifications: Trusted Catch, Kosher
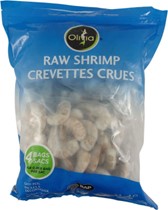
Raw Shrimp
Source: Mintel, 2023
| Company | IFC Seafood |
|---|---|
| Brand | Olivia |
| Category | Processed fish, meat and egg products |
| Market | Canada |
| Location of manufacture | India |
| Store name | Costco |
| Store type | Club store |
| Date published | August 2022 |
| Launch type | New packaging |
| Price in local currency | Can$29.99 |
| Price in US dollars | 23.48 |
Olivia Raw Shrimp has been repackaged. It contains deveined, shell on shrimps that are individually quick frozen and said to be easy peel. This BAP certified product retails in a 1.82 kilogram resealable pack, containing four 454 gram bags containing 31 to 40 shrimps per pound and featuring the Best Aquaculture Practices logo and suggested cooking guidelines.
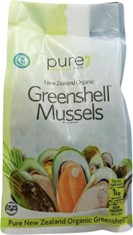
New Zealand Organic Greenshell Mussels
Source: Mintel, 2023
| Company | Southern Seafoods |
|---|---|
| Distributor | Frobisher |
| Brand | Pure Aotearoa |
| Category | Processed fish, meat and egg products |
| Location of manufacture | New Zealand |
| Store name | T & T Supermarket |
| Store type | Supermarket |
| Date published | July 2022 |
| Launch type | New product |
| Price in local currency | Can$21.99 |
| Price in US dollars | 16.83 |
Pure Aotearoa New Zealand Organic Greenshell Mussels are described as premium, clean seafood harvested from the remote waters of Aotearoa in New Zealand. This organic and halal certified product is said to have been hand-selected for its superior taste and visual appeal, and is convenient and easy to prepare. It is claimed to be suited to many types of preparations including sauté, frying, baking, steaming, broiling, stewing and grilling, and retails in a 1 kilogram pack featuring the Ocean Wise Recommended logo, a recipe directions and cooking instructions.
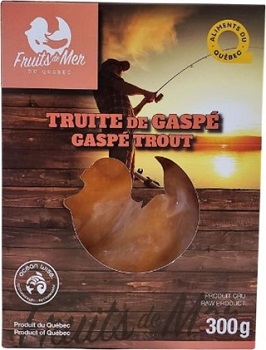
Gaspé Trout
Source: Mintel, 2023
| Company | Fruits de Mer du Québec |
|---|---|
| Brand | Fruits de Mer du Québec |
| Category | Processed fish, meat and egg products |
| Store name | IGA |
| Store type | Supermarket |
| Date published | May 2022 |
| Launch type | New variety / range extension |
| Price in local currency | Can$15.49 |
| Price in US dollars | 12.28 |
Fruits de Mer du Québec Gaspé Trout is described as locally farmed and prepared, and features fine flesh, semi-firm texture, dark red to pale pink colour, and delicate and refined taste. The product retails in a 300 gram pack bearing the Ocean Wise Recommended and Facebook logos, a QR code and culinary inspirations.
Solid Light Tuna in Olive Oil
Source: Mintel, 2023
| Company | Bolton Food |
|---|---|
| Importer | Sofina Foods |
| Brand | Rio Mare |
| Category | Processed fish, meat and egg products |
| Location of manufacture | Italy |
| Store name | Avril Supermarché Santé |
| Store type | Natural / health food store |
| Date published | February 2022 |
| Launch type | New packaging |
| Price in local currency | Can$7.49 |
| Price in US dollars | 5.87 |
Rio Mare Solid Light Tuna in Olive Oil has been repackaged. It is made using traceable fish and contains 12 grams of protein per can. The product retails in a newly designed 240 gram pack containing three 80 gram cans and bearing the Dolphin Safe logo.
Wild Caught Canadian Snow Crab Legs and Claws
Source: Mintel, 2023
| Company | Toppits Foods |
|---|---|
| Brand | Toppits |
| Category | Processed fish, meat and egg products |
| Store name | Provigo |
| Store type | Supermarket |
| Date published | January 2022 |
| Product source | Shopper |
| Launch type | New variety / range extension |
| Price in local currency | Can$29.99 |
| Price in US dollars | 23.72 |
Toppits Wild Caught Canadian Snow Crab Legs and Claws comprise unscored and fully cooked legs and claws. This chemical-free product retails in a 500 gram pack bearing the MSC, Instagram, Facebook and Twitter logos.
Lobster & Scallop Seafood Bake with Mussels and Shrimp

Source: Mintel, 2023
| Company | Loblaws |
|---|---|
| Brand | PC President's Choice |
| Category | Processed fish, meat and egg products |
| Store name | Fortinos |
| Store type | Supermarket |
| Date published | November 2021 |
| Launch type | New variety / range extension |
| Price in local currency | Can$19.99 |
| Price in US dollars | 15.93 |
PC President's Choice Lobster & Scallop Seafood Bake with Mussels and Shrimp is now available for winter 2021. It comprises a medley of mussels, shrimp, lobster and scallops, in a buttery garlic and herb sauce. It is said to be a quick and delicious seafood bake brimming with responsibly farmed and sustainably sourced seafood including Canadian mussels, shrimp, Canadian lobster scored for easy shell removal, and scallops. Seasoned with garlic, butter and parsley, the one-pan recipe is said to be perfect for feeding a crowd. The uncooked product contains no artificial flavours or synthetic colours, and retails in a 700 gram pack made from 100% recycled paperboard with a minimum of 35% post-consumer content, and bearing preparation instructions.
White Cockle Clams

Source: Mintel, 2023
| Company | Clearwater Seafoods |
|---|---|
| Brand | Clearwater |
| Category | Processed fish, meat and egg products |
| Market | Canada |
| Store name | Kim Phat |
| Store type | Supermarket |
| Date published | June 2021 |
| Launch type | New variety / range extension |
| Price in local currency | Can$8.99 |
| Price in US dollars | 7.45 |
Clearwater White Cockle Clams are claimed to be ideal for Asian cuisines. The ready to use frozen at sea product is said to feature mild sweet flavour and unique shellfish delicacy, and is described as wild caught from Canadian North Atlantic, natural, and individually quick frozen. It retails in a 400 gram pack.
Lobster Tails
Source: Mintel, 2023
| Company | Toppits Foods |
|---|---|
| Brand | Toppits |
| Category | Processed fish, meat and egg products |
| Store name | Marchés TAU |
| Date published | February 2021 |
| Launch type | New packaging |
| Price in local currency | Can$14.99 |
| Price in US dollars | 11.81 |
Toppits Lobster Tails have been repackaged. The uncooked sustainably sourced product retails in a 140 gram pack containing two units and featuring the MSC logo.
Atlantic Salmon Fillet

Source: Mintel, 2023
| Company | Metro |
|---|---|
| Brand | Metro |
| Category | Processed fish, meat and egg products |
| Store name | Metro |
| Store type | Mass merchandise / hypermarket |
| Date published | February 2021 |
| Launch type | Relaunch |
| Price in local currency | Can$20.94 |
| Price in US dollars | 16.42 |
Metro Farm Raised Atlantic Salmon Fillet has been relaunched with a new brand name, previously known as Metro Plus, and with a new pack design. The 100% Canadian product retails in a newly designed 722 gram pack.
Skinless Boneless Sustainably Sourced Wild Pollock Fillets
Source: Mintel, 2023
| Company | Loblaws |
|---|---|
| Brand | Sea Quest |
| Category | Processed fish, meat and egg products |
| Location of manufacture | China |
| Store name | Provigo |
| Store type | Supermarket |
| Date published | January 2021 |
| Launch type | New variety / range extension |
| Price in local currency | Can$6.99 |
| Price in US dollars | 5.51 |
Sea Quest Skinless Boneless Sustainably Sourced Wild Pollock Fillets can be prepared in the frying pan, barbecue or conventional oven. They retail in a 400 gram pack bearing the MSC logo.
For more information
The Canadian Trade Commissioner Service:
International Trade Commissioners can provide Canadian industry with on-the-ground expertise regarding market potential, current conditions and local business contacts, and are an excellent point of contact for export advice.
More agri-food market intelligence:
International agri-food market intelligence
Discover global agriculture and food opportunities, the complete library of Global Analysis reports, market trends and forecasts, and information on Canada's free trade agreements.
Agri-food market intelligence service
Canadian agri-food and seafood businesses can take advantage of a customized service of reports and analysis, and join our email subscription service to have the latest reports delivered directly to their inbox.
More on Canada's agriculture and agri-food sectors:
Canada's agriculture sectors
Information on the agriculture industry by sector. Data on international markets. Initiatives to support awareness of the industry in Canada. How the department engages with the industry.
Resources
- Euromonitor International, 2022
- Fisheries and Oceans Canada (2022), Economic analysis
- Fisheries and Oceans Canada (December 2018), Outlook to 2027 for Canadian Fish and Seafood
- IBISWorld (August 2022), Fish & Seafood Wholesaling in Canada - Market Research Report
- Global Trade Tracker, 2022
- Mintel Global New Products Database, 2022
- OECD (January 2021), Fisheries and Aquaculture in Canada
- OECD (June 2022), OECD-FAO Agricultural Outlook 2022-2031
- Statistics Canada (November 2022) Aquaculture, production and value, Retrieved December 19, 2022.
- Statistics Canada, (November 2022) Aquaculture, 2021 (final), Retrieved December 19, 2022.
Sector Trend Analysis – Fish and seafood trends in Canada
Global Analysis Report
Prepared by: Zhiduo Wang, Market Analyst
© His Majesty the King in Right of Canada, represented by the Minister of Agriculture and Agri-Food (2023).
Photo credits
All photographs reproduced in this publication are used by permission of the rights holders.
All images, unless otherwise noted, are copyright His Majesty the King in Right of Canada.
To join our distribution list or to suggest additional report topics or markets, please contact:
Agriculture and Agri-Food Canada, Global Analysis1341 Baseline Rd, Tower 5, 3rd floor
Ottawa ON K1A 0C5
Canada
Email: aafc.mas-sam.aac@agr.gc.ca
The Government of Canada has prepared this report based on primary and secondary sources of information. Although every effort has been made to ensure that the information is accurate, Agriculture and Agri-Food Canada (AAFC) assumes no liability for any actions taken based on the information contained herein.
Reproduction or redistribution of this document, in whole or in part, must include acknowledgement of agriculture and agri-food Canada as the owner of the copyright in the document, through a reference citing AAFC, the title of the document and the year. Where the reproduction or redistribution includes data from this document, it must also include an acknowledgement of the specific data source(s), as noted in this document.
Agriculture and Agri-Food Canada provides this document and other report services to agriculture and food industry clients free of charge.