

Note: This report includes forecasting data that is based on baseline historical data.
Executive summary
With Chinese consumers increasing their spending on high quality, value-added fish and seafood products (Wang et al., 2021), per capita consumption of fish and seafood will grow faster than that of meat.
Fish and seafood consumption has increased in response to the rapid increase in disposable income. Consumption grew faster in rural areas than in urban areas from 2015 to 2019. As Chinese consumers living in third-tier (and below) cities and rural areas are expected to drive the next wave of consumption (Tan & Wang, 2020), high-end imported seafood products will find new opportunities for growth in China.
With imports of US$15.3 billion, China was the second largest fish and seafood importer in the in the world in 2020, after the United States (US$23.0 billion). Chinese imports grew in value at a compound annual growth rate (CAGR) of 13.7% from 2016 to 2020. In terms of volume, China ranked 1st in the world.
From 2016 to 2020, Canadian fish and seafood exports to China grew faster in value than in volume (7.6% vs. 1.3%). Much of this increase is attributable to growth in luxury seafood products such as lobster, frozen cold-water shrimp, crabs and sea cucumbers. The unit value of Canadian fish and seafood exports also rose significantly at a CAGR of 6.2% from 2016 to 2020.
The total value of retail sales of fish and seafood in China grew at a CAGR of 10.3% from 2016 to 2020. Retail sales were valued at US$89.2 billion (42,267.4 thousand tonnes) in 2020. They are expected to increase at a slower rate (5.8%), to US$100.6 billion (50,015.3 thousand tonnes), by 2025. Retail sales in 2020 show that Chinese consumers prefer fresh fish and seafood and frozen processed seafood. This preference is expected to continue during the forecast period.
Market trends
China is not only the world's largest aquaculture producer and exporter (OECD-FAO, 2021), it also leads the world in fish and seafood consumption (USDA, 2019). With Chinese consumers increasing their spending on high quality, value-added fish and seafood products (Wang et al., 2021), the per capita consumption on fish and seafood will grow faster than that of meat.
| Category | 2016 | 2020 | CAGR* % 2016-2020 | 2021 | 2025 | CAGR* % 2021-2025 |
|---|---|---|---|---|---|---|
| Meat | 188.9 | 248.2 | 7.1 | 262.0 | 338.0 | 6.6 |
| Fish and seafood | 66.1 | 87.2 | 7.2 | 92.1 | 119.2 | 6.7 |
|
Source: Euromonitor International, 2021 *CAGR - Compound Annual Growth Rate
|
||||||
China's coastal urban areas, where fish and seafood products have been a traditional source of protein, have the highest per capita consumption of such products. The Chinese seafood catering industry is highly concentrated in areas such as the Yangtze River Delta, Bohai Rim, and Pearl River Delta (Tian et al., 2021).
The rapid development of fresh food e-commerce in China is slowly changing the stereotypes related to regional dietary preferences. A Chinese market report published in 2019 found that the city with the highest preference for fish and seafood products is Lanzhou, the capital city of northwest China's Gansu province (CBNData & Alibaba local life service company, 2019). According to the Canadian Association of Prawn Producers, although northwest China does not directly import Canadian cold-water shrimp (called Arctic shrimp in the Chinese market), it is an important market for cold-water shrimp in China. Each year, a large volume of Canadian cold-water shrimp is exported to Qingdao, Dalian and other coastal ports and then reshipped to northeastern cities like Xi'an, Lanzhou, Xining and Urumqi, where they have become a favourite dish (Canadian Association of Prawn Producers, 2021).
With the rapid increase in disposable income, fish and seafood consumption grew faster in rural areas than in urban areas from 2015 to 2019. As Chinese consumers living in third-tier (and below) cities and rural areas are expected to drive the next wave of consumption (Tan & Wang, 2020), high-end imported seafood products like Canadian lobster will find new opportunities for growth in China. Big e-commerce platforms and fresh supermarkets such as Pinduoduo, Alibaba, RT-MART and Yonghui Superstores are bringing an affordable middle-class lifestyle to rural residents through live streaming and aquatic counters, while the ever-improving supply chain logistics and community retail models such as fresh group buying and front-warehousing-to-home are making imported fish and seafood products fresher and more affordable (Wu, 2021).
| Category | 2015 | 2016 | 2017 | 2018 | 2019 | *CAGR % 2015-2019 |
|---|---|---|---|---|---|---|
| Urban | 14.7 | 14.8 | 14.8 | 14.3 | 16.7 | 3.2 |
| Rural | 7.2 | 7.5 | 7.4 | 7.8 | 9.6 | 7.5 |
| National | 11.2 | 11.4 | 11.5 | 11.4 | 13.6 | 5.0 |
|
Source: China Statistical Yearbook, 2020 *CAGR: Compound Annual Growth Rate |
||||||
In 2021, China Nutrition Society, the country's dietary advisory body, recommended that Chinese residents optimize their animal protein consumption by moving away from consumption focused primarily on pork and increasing their intake of seafood products rich in omega-3 fatty acids. The average intake of fish and shrimp in China is 24.3 grams/day currently; this consumption has not increased significantly over the years but is expected to rise to 40.0 grams/day (China Nutrition Society, 2021).
Securing an affordable and sufficient supply of fish and seafood has been an indispensable pillar of China's food security strategy (Government of China, 2008; Han & Li, 2015; Ministry of Agriculture and Rural Affairs of China, 2017). Mariculture is seen as a "blue granary" that can help solve China's food security challenges as it can reduce demand for pork and raw grains and meet the varied nutritional needs of the Chinese people (Yu & Han, 2020). As domestic production capacity is unable to satisfy Chinese consumer demand for fish and seafood, the supply shortage in China is forecast to reach 6 to 18 million tonnes by 2030 (Crona et al., 2020). China will rely on a combination of domestic freshwater and offshore aquaculture, fish and seafood imports, distant water fishing, and investment in global seafood production to meet the increasing demand (Crona et al., 2020).
All these trends indicate that there are still opportunities for Canadian fish and seafood exporters to further expand their market share in China.
Trade overview
With imports of US$15.3 billion in 2020, China is the second largest fish and seafood importer in the world, after the United States (US$23.0 billion). Chinese imports grew in value at a CAGR of 13.7% from 2016 to 2020. In terms of volume, China's imports ranked 1st in the world.
| Country | 2016 | 2017 | 2018 | 2019 | 2020 | CAGR* % 2016-2020 | Market share % 2020 |
|---|---|---|---|---|---|---|---|
| World | 136.9 | 149.2 | 160.7 | 160.0 | 148.3 | 2.0 | 100 |
| United States | 20.8 | 23.0 | 24.0 | 23.5 | 23.0 | 2.6 | 15.5 |
| China | 9.1 | 11.1 | 14.7 | 18.4 | 15.3 | 13.7 | 10.3 |
| Japan | 14.3 | 15.4 | 15.8 | 15.6 | 13.6 | −1.3 | 9.2 |
| Spain | 7.2 | 8.1 | 8.7 | 8.2 | 7.4 | 0.6 | 5.0 |
| France | 6.4 | 6.9 | 7.2 | 6.8 | 6.5 | 0.5 | 4.4 |
| Italy | 6.2 | 6.6 | 7.1 | 6.7 | 6.1 | −0.5 | 4.1 |
| Germany | 5.8 | 5.9 | 6.2 | 6.0 | 6.0 | 1.2 | 4.1 |
| South Korea | 4.7 | 5.2 | 6.1 | 5.7 | 5.5 | 4.0 | 3.7 |
| Sweden | 5.2 | 5.0 | 5.6 | 5.3 | 5.1 | −0.6 | 3.4 |
| Netherlands | 3.8 | 4.3 | 4.5 | 4.5 | 4.6 | 4.9 | 3.1 |
|
Source: Global Trade Tracker, 2021 *CAGR: Compound Annual Growth Rate |
|||||||
| Country | 2016 | 2017 | 2018 | 2019 | 2020 | CAGR* % 2016-2020 | Market share % 2020 |
|---|---|---|---|---|---|---|---|
| World | 35.7 | 36.5 | 308.2 | 38.4 | 36.9 | 0.8 | 100.0 |
| China | 4.0 | 4.9 | 5.2 | 6.3 | 5.7 | 8.9 | 15.4 |
| United States | 2.7 | 2.8 | 2.9 | 2.8 | 2.9 | 1.5 | 7.9 |
| Japan | 2.4 | 2.5 | 2.4 | 2.5 | 2.3 | −1.4 | 6.1 |
| Thailand | 1.9 | 1.9 | 2.1 | 2.0 | 2.1 | 3.7 | 5.8 |
| Spain | 1.7 | 1.8 | 1.8 | 1.8 | 1.7 | −0.1 | 4.6 |
| South Korea | 1.4 | 1.5 | 1.6 | 1.5 | 1.5 | 1.5 | 4.2 |
| France | 1.2 | 1.2 | 1.2 | 1.2 | 1.2 | 1.1 | 3.3 |
| Germany | 1.3 | 1.2 | 1.2 | 1.2 | 1.2 | −1.3 | 3.3 |
| Denmark | 1.4 | 1.3 | 1.3 | 1.2 | 1.2 | −3.8 | 3.2 |
| Netherlands | 1.0 | 1.1 | 1.1 | 1.1 | 1.1 | 2.3 | 3.0 |
|
Source: Global Trade Tracker, 2021 *CAGR: Compound Annual Growth Rate |
|||||||
China has a diverse network of suppliers of fish and seafood products, with imports coming primarily from Russia, Ecuador, Vietnam, Peru and the United States. Russia is China's largest supplier of fish and seafood in 2020, and the value of its imports has been growing steadily. Other fast-growing suppliers are Ecuador and India.
Canada ranked 8th among the leading suppliers of fish and seafood to China in 2020. Canada's share of imports grew at a CAGR of 8.1% from 2016 to 2020, but its market share was 5.5% in 2020.
| Country | 2016 | 2017 | 2018 | 2019 | 2020 | CAGR* % 2016-2020 | Market share % 2020 |
|---|---|---|---|---|---|---|---|
| World | 9,122.3 | 11,110.5 | 14,745.2 | 18,413.6 | 15,267.6 | 13.7 | 100 |
| Russia | 1,514.8 | 1,567.9 | 2,223.2 | 2,295.8 | 1,971.6 | 6.8 | 12.9 |
| Ecuador | 176.0 | 192.1 | 533.9 | 1,928.1 | 1,750.0 | 77.6 | 11.5 |
| Vietnam | 302.7 | 400.3 | 729.7 | 1,146.8 | 1,246.3 | 42.5 | 8.2 |
| Peru | 838.3 | 1,493.8 | 1,479.9 | 1,516.0 | 1,125.8 | 7.7 | 7.4 |
| United States | 1,237.5 | 1,503.7 | 1,421.7 | 1,056.7 | 977.8 | −5.7 | 6.4 |
| Indonesia | 439.2 | 492.0 | 733.1 | 840.8 | 847.7 | 17.9 | 5.6 |
| India | 97.0 | 127.6 | 401.6 | 1,237.7 | 844.8 | 71.8 | 5.5 |
| Canada | 613.9 | 755.0 | 1,014.0 | 1,136.0 | 839.0 | 8.1 | 5.5 |
| Australia | 95.0 | 317.6 | 681.3 | 777.0 | 550.4 | 55.1 | 3.6 |
| Norway | 363.1 | 473.5 | 585.9 | 699.6 | 522.4 | 9.5 | 3.4 |
|
Source: Global Trade Tracker, 2021 *CAGR: Compound Annual Growth Rate |
|||||||
China's total fish and seafood imports grew from US$9.1 billion in 2016 to US$15.3 billion in 2020, a CAGR of 13.7%. In 2020, the top five commodities imported by China were frozen shrimp and prawns (US$3.1 billion), flours, meals and pellets of fish or crustaceans, molluscs, inedible (US$2.0 billion), live/fresh/chilled rock lobster (US$897.3 million), frozen fish (US$825.0 million), and live/fresh/chilled crabs (US$803.1 million).
| HS code | Description | 2016 | 2017 | 2018 | 2019 | 2020 | CAGR* % 2016-2020 |
|---|---|---|---|---|---|---|---|
| Total | 9,122.3 | 11,110.5 | 14,745.2 | 18,413.6 | 15,267.6 | 13.7 | |
| 030617 | Frozen shrimps and prawns | 443.8 | 472.5 | 1,356.5 | 3,973.9 | 3,107.5 | 62.7 |
| 230120 | Flours, meals and pellets of fish or crustaceans, molluscs, inedible | 1,616.3 | 2,228.4 | 2,227.3 | 1,974.7 | 1,965.3 | 5.0 |
| 030631 | Rock lobster, live/fresh/chilled | 384.0 | 470.9 | 912.3 | 941.4 | 897.3 | 23.6 |
| 030389 | Frozen fish, not elsewhere specified | 482.1 | 443.9 | 600.8 | 881.7 | 825.0 | 14.4 |
| 030633 | Crabs, live/fresh/chilled | 392.3 | 484.9 | 793.6 | 779.0 | 803.1 | 19.6 |
| 030367 | Frozen Alaska pollack | 654.5 | 639.0 | 654.6 | 940.8 | 690.6 | 1.4 |
| 030743 | Cuttlefish and squid, frozen | 0.0 | 501.3 | 527.9 | 861.3 | 662.8 | N/C |
| 030363 | Frozen cod | 567.5 | 677.1 | 727.3 | 640.7 | 497.0 | −3.3 |
| 030632 | Lobsters, live/fresh/chilled | 245.2 | 299.6 | 444.2 | 475.1 | 452.7 | 16.6 |
| 030462 | Frozen catfish fillets | 52.3 | 92.7 | 267.6 | 449.2 | 347.1 | 60.5 |
|
Source: Global Trade Tracker, 2021 *CAGR: Compound Annual Growth Rate N/C: not calculable |
|||||||
Top five global suppliers of fish and seafood to China, by top three products, in US$ million, historical
| HS code | Description | 2016 | 2017 | 2018 | 2019 | 2020 | CAGR* % 2016-2020 |
|---|---|---|---|---|---|---|---|
| Total | 1,514.8 | 1,567.9 | 2,223.2 | 2,295.8 | 1,971.6 | 6.8 | |
| 030367 | Frozen Alaska pollack | 580.9 | 564.0 | 584.0 | 874.0 | 647.3 | 2.7 |
| 030633 | Crabs, live/fresh/chilled | 38.6 | 102.7 | 287.3 | 310.6 | 411.0 | 80.6 |
| 030363 | Frozen cod | 252.7 | 328.8 | 390.1 | 360.5 | 286.1 | 3.1 |
|
Source: Global Trade Tracker, 2021 *CAGR: Compound Annual Growth Rate |
|||||||
| HS code | Description | 2016 | 2017 | 2018 | 2019 | 2020 | CAGR* % 2016-2020 |
|---|---|---|---|---|---|---|---|
| Total | 176.0 | 192.1 | 533.9 | 1,928.1 | 1,750.0 | 77.6 | |
| 030617 | Frozen shrimps and prawns | 95.7 | 107.5 | 480.4 | 1,848.8 | 1,689.4 | 105.0 |
| 230120 | Flours, meals and pellets of fish or crustaceans, molluscs, inedible | 77.2 | 78.3 | 38.4 | 27.5 | 28.5 | −22.0 |
| 030389 | Frozen fish, not elsewhere specified | 1.8 | 2.9 | 6.8 | 31.9 | 28.3 | 98.2 |
|
Source: Global Trade Tracker, 2021 *CAGR: Compound Annual Growth Rate |
|||||||
| HS code | Description | 2016 | 2017 | 2018 | 2019 | 2020 | CAGR* % 2016-2020 |
|---|---|---|---|---|---|---|---|
| Total | 302.7 | 400.3 | 729.7 | 1,146.8 | 1,246.3 | 42.5 | |
| 030462 | Frozen catfish fillets | 52.2 | 92.6 | 267.6 | 449.2 | 347.1 | 60.6 |
| 030617 | Frozen shrimps and prawns | 7.7 | 11.2 | 88.8 | 254.3 | 182.2 | 120.9 |
| 030631 | Rock lobster and other sea crawfish, live/fresh/chilled | 0.01 | 0.1 | 0.3 | 16.5 | 169.8 | 1,014.5 |
|
Source: Global Trade Tracker, 2021 *CAGR: Compound Annual Growth Rate |
|||||||
| HS code | Description | 2016 | 2017 | 2018 | 2019 | 2020 | CAGR* % 2016-2020 |
|---|---|---|---|---|---|---|---|
| Total | 838.3 | 1,493.8 | 1,479.9 | 1,516.0 | 1,125.8 | 7.7 | |
| 230120 | Flours, meals and pellets of fish or crustaceans, molluscs, inedible | 727.7 | 1,285.6 | 1,235.7 | 1,141.3 | 905.8 | 5.6 |
| 030743 | Cuttlefish and squid, frozen | 4.1 | 23.0 | 31.9 | 141.5 | 53.5 | 89.7 |
| 160554 | Cuttlefish and squid, prepared/preserved | 13.6 | 72.9 | 116.3 | 113.7 | 53.0 | 40.5 |
|
Source: Global Trade Tracker, 2021 *CAGR: Compound Annual Growth Rate |
|||||||
| HS code | Description | 2016 | 2017 | 2018 | 2019 | 2020 | CAGR* % 2016-2020 |
|---|---|---|---|---|---|---|---|
| Total | 1,237.5 | 1,503.7 | 1,421.7 | 1,056.7 | 977.8 | −5.7 | |
| 030339 | Frozen flatfish | 149.6 | 183.7 | 181.7 | 180.0 | 151.6 | 0.3 |
| 230120 | Flours, meals and pellets of fish or crustaceans, molluscs, inedible | 183.9 | 161.3 | 129.2 | 92.8 | 132.6 | −7.8 |
| 030632 | Lobsters, live/fresh/chilled | 116.5 | 122.9 | 121.4 | 9.3 | 105.1 | −2.5 |
|
Source: Global Trade Tracker, 2021 *CAGR: Compound Annual Growth Rate |
|||||||
Canada's performance
Since 2016, Canada has increased its fish and seafood exports to China. Canada was China's 8th largest supplier of fish and seafood in 2020. China imported US$839.0 million of fish and seafood from Canada in 2020, with these imports having increased by CAGR of 8.1% from US$613.9 million in 2016. The top Canadian fish and seafood imports were live/fresh/chilled lobsters, (US$344.2 million), frozen cold-water shrimps and prawns (US$100.4 million), live/fresh/chilled crabs (US$86.6 million), and frozen crabs (US$49.3 million).
| HS code | Description | 2016 | 2017 | 2018 | 2019 | 2020 | CAGR* % 2016-2020 |
|---|---|---|---|---|---|---|---|
| Total | 613.9 | 755.0 | 1,014.0 | 1,136.0 | 839.0 | 8.1 | |
| 030632 | Lobsters, live/fresh/chilled | 127.8 | 175.2 | 320.1 | 462.7 | 344.2 | 28.1 |
| 030616 | Frozen cold-water shrimps and prawns | 121.1 | 157.3 | 160.5 | 139.4 | 100.4 | −4.6 |
| 030633 | Crabs, live/fresh/chilled | 71.4 | 64.7 | 81.8 | 109.8 | 86.6 | 4.9 |
| 030614 | Frozen crabs | 86.4 | 140.9 | 117.3 | 71.4 | 49.3 | −13.1 |
| 030772 | Frozen clams (even in shell) | 15.3 | 16.7 | 44.8 | 59.7 | 44.5 | 30.5 |
|
Source: Global Trade Tracker, 2021 *CAGR: Compound Annual Growth Rate |
|||||||
From 2016 to 2020, Canadian fish and seafood exports to China grew faster in value than in volume (7.6% vs. 1.3%). Much of this increase is attributable to growth in exports of luxury seafood products such as lobsters, frozen cold-water shrimps, crabs and sea cucumbers. The unit value of Canadian fish and seafood exports also rose (CAGR of 6.2%) from 2016 to 2020.
| Year | Value US$ in million | Volume metric tonnes | Unit value US$/kilogram |
|---|---|---|---|
| 2016 | 577.9 | 105,118.2 | 5.5 |
| 2017 | 734.6 | 111,074.8 | 6.6 |
| 2018 | 901.4 | 118,975.8 | 7.6 |
| 2019 | 986.6 | 133,786.1 | 7.4 |
| 2020 | 774.8 | 110,861.9 | 7.0 |
| CAGR* % 2016-2020 | 7.6 | 1.3 | 6.2 |
|
Source: Global Trade Tracker, 2021 *CAGR: Compound Annual Growth Rate |
|||
The increase in exports of luxury seafood products to China is associated with multiple factors including the popularity of famous regional seafood cuisines (Shandong's lucai (鲁菜) and Cantonese yuecai (粤菜), the influence of traditional Chinese medicine, and most importantly, the prevailing notion of social status ("mianzi") and conspicuous consumption linked to the increase in the size of the middle class and in the number of affluent consumers (Fabinyi, 2011, 2015, 2018).
Retail sales
China's total retail sales of fish and seafood grew in value at a CAGR of 10.3% from 2016 to 2020 and were valued at US$89.2 billion (42,267.4 thousand tonnes) in 2020. They are expected to increase at a rate of 5.8%, to US$100.6 billion (50,015.3 thousand tonnes), by 2025. Retail sales in 2020 indicate that Chinese consumers show a preference for fresh fish and seafood and frozen processed seafood. This preference is expected to continue during the forecast period.
Due to the COVID-19 national lockdown, food service closures and losses via institutional sales, the Chinese fish and seafood market experienced a contraction in the overall volume of sales in 2020. Meanwhile, the average unit price for fish and seafood products declined in 2020 as a result of the oversupply situation created by food service closures and reduced exports. Nevertheless, fish increased its share of the overall category in 2020 as it is widely popular among the majority of Chinese households and can be more easily cooked at home than crustaceans, molluscs and cephalopods (Euromonitor International, 2021).
Moving forward, the Chinese fish and seafood market is expected to recover in 2021 with growth set to return to pre-pandemic levels beginning in 2022. However, significant economic fallout from the pandemic could negatively impact disposable incomes, meaning that people are likely to cut back on their out-of-home consumption of fish and seafood compared to the situation prior to the pandemic (Euromonitor International, 2021).
| Category | 2016 | 2020 | CAGR* % 2016-2020 | 2021 | 2025 | CAGR* % 2021-2025 |
|---|---|---|---|---|---|---|
| Total fish and seafood | 60,339.9 | 89,166.7 | 10.3 | 80,451.2 | 100,629.9 | 5.8 |
| Fresh fish and seafood | 58,534.9 | 86,793.8 | 10.3 | 78,040.6 | 97,760.2 | 5.8 |
| Crustaceans | 22,530.1 | 33,236.1 | 10.2 | 30,291.0 | 40,519.1 | 7.5 |
| Fish | 25,524.9 | 37,707.7 | 10.2 | 34,100.0 | 40,755.6 | 4.6 |
| Molluscs and cephalopods | 10,479.9 | 15,850.0 | 10.9 | 13,649.7 | 16,485.6 | 4.8 |
| Processed seafood | 1,805.0 | 2,372.9 | 7.1 | 2,410.6 | 2,869.7 | 4.5 |
| Shelf stable seafood | 307.8 | 391.1 | 6.2 | 420.8 | 518.7 | 5.4 |
| Frozen processed seafood | 1,497.2 | 1,981.8 | 7.3 | 1,989.7 | 2,351.1 | 4.3 |
|
Source: Euromonitor International, 2021 *CAGR: Compound Annual Growth Rate |
||||||
| Category | 2016 | 2020 | CAGR* % 2016-2020 | 2021 | 2025 | *CAGR % 2021-2025 |
|---|---|---|---|---|---|---|
| Total fish and seafood | 40,734.4 | 42,267.4 | 0.9 | 46,041.0 | 50,015.3 | 2.1 |
| Fresh fish and seafood | 40,012.9 | 41,347.0 | 0.8 | 45,050.9 | 48,750.4 | 2.0 |
| Crustaceans | 4,311.0 | 4,605.8 | 1.7 | 5,093.5 | 6,018.6 | 4.3 |
| Fish | 25,097.9 | 26,054.7 | 0.9 | 28,131.4 | 30,057.8 | 1.7 |
| Molluscs and cephalopods | 10,604.0 | 10,686.5 | 0.2 | 11,825.9 | 12,673.9 | 1.7 |
| Processed seafood | 721.5 | 920.4 | 6.3 | 990.1 | 1,264.9 | 6.3 |
| Shelf stable seafood | 66.5 | 77.8 | 4.0 | 80.6 | 89.4 | 2.6 |
| Frozen processed seafood | 654.9 | 842.6 | 6.5 | 909.4 | 1,175.4 | 6.6 |
|
Source: Euromonitor International, 2021 *CAGR: Compound Annual Growth Rate |
||||||
Competitive landscape
In 2020, the top 10 processed fish and seafood companies in China accounted for 37.2% of the market.
Fujian Anjoy Food, Guangdong Ganzhu Canned Food and Fujian Haixin Food were the top three companies in 2020. Fujian Anjoy Food saw the largest growth (23.8%) in retail sales, from US$120.6 million in 2016 to US$283.5 million in 2020.
| Company Name | 2015 | 2016 | 2017 | 2018 | 2019 | 2020 | CAGR* % 2016-2020 | Market share % 2020 |
|---|---|---|---|---|---|---|---|---|
| Fujian Anjoy Food Co Ltd | 120.6 | 130.6 | 144.5 | 170.8 | 214.9 | 283.5 | 23.8 | 11.9 |
| Guangdong Ganzhu Canned Food Co Ltd | 103.6 | 106.6 | 113.7 | 125.0 | 130.8 | 147.7 | 9.3 | 6.2 |
| Fujian Haixin Food Co Ltd | 74.8 | 75.2 | 79.6 | 90.5 | 98.3 | 117.2 | 11.9 | 4.9 |
| Hai Pa Wang International Food Group | 58.9 | 60.2 | 63.5 | 68.8 | 69.6 | 81.9 | 8.6 | 3.5 |
| Laurel Enterprises Corp | 35.6 | 35.3 | 42.4 | 47.6 | 49.9 | 59.6 | 13.7 | 2.5 |
| Fujian Haiyi Food Drink Co Ltd | 47.9 | 38.8 | 37.1 | 41.0 | 42.4 | 46.6 | −0.7 | 2.0 |
| Zhengzhou Pangge Frozen Food Co Ltd | 25.6 | 27.1 | 30.2 | 35.4 | 38.8 | 46.0 | 15.8 | 1.9 |
| Xiamen Gulong Canned Food Co Ltd | 38.6 | 30.9 | 31.3 | 34.0 | 34.4 | 37.4 | −0.8 | 1.6 |
| Century Pacific Food Inc | 31.7 | 30.3 | 43.0 | 46.3 | 32.5 | 33.8 | 1.6 | 1.4 |
| Guangzhou Eagle Coin Enterprise Group Co | 37.7 | 40.9 | 29.7 | 26.5 | 26.6 | 28.7 | −6.6 | 1.2 |
| Others | 1,218.7 | 1,229.1 | 1,288.8 | 1,389.2 | 1,366.9 | 1,490.5 | 5.2 | 62.8 |
| Total | 1,793.7 | 1,805.0 | 1,903.8 | 2,075.1 | 2,105.1 | 2,372.9 | 7.2 | 100.0 |
|
Source: Euromonitor International, 2021 *CAGR: Compound Annual Growth Rate |
||||||||
New product launch analysis
According to Mintel's Global New Products Database (GNPD), there were 1,251 launches of processed fish products in China between January 2016 and December 2020. In 2020, the top claims (may contain more than one claim per package) were ease of use, social media, no additives/preservatives, microwaveable and ethical or environmentally friendly product. The top five brands were Blue Snow, Hai Xin Yu Ji, Four Seas, Da Yu Shi / Harvest Fish Harbor and Ocean Gala. The top flavours were unflavoured/plain, hot, spice/spicy, cheese and garlic.
Despite the economic decline caused by COVID-19, Chinese consumers are still willing to pay a premium price for fish and seafood products that they perceive to be of better quality, natural, safe and healthy. Also, traditional delicacies like abalone, sea cucumber and fish maw, which are usually served on special occasions, are gaining retail presence and are likely to appeal to consumers (Mintel, 2020).
| Product attributes | Yearly launch count | ||||
|---|---|---|---|---|---|
| 2016 | 2017 | 2018 | 2019 | 2020 | |
| Yearly product launches | 267 | 290 | 254 | 216 | 224 |
| Top five price groups in US$ | |||||
| 0.56-4.55 US$ | 100 | 115 | 91 | 95 | 97 |
| 4.56-8.55 US$ | 48 | 65 | 52 | 55 | 64 |
| 8.56-12.55 US$ | 34 | 38 | 47 | 35 | 22 |
| 12.56-16.55 US$ | 33 | 29 | 32 | 13 | 20 |
| 16.56-25.00 US$ | 32 | 28 | 18 | 16 | 16 |
| Top five claims | |||||
| Ease of use | 25 | 45 | 31 | 26 | 22 |
| Social media | 21 | 27 | 33 | 28 | 24 |
| No additives / preservatives | 40 | 16 | 31 | 14 | 10 |
| Microwaveable | 13 | 20 | 27 | 12 | 32 |
| Ethical or environmentally friendly product | 3 | 11 | 16 | 21 | 33 |
| Imported status | |||||
| Not imported | 248 | 248 | 206 | 192 | 197 |
| Imported | 5 | 4 | 16 | 6 | 10 |
| Top five brands | |||||
| Blue Snow | 13 | 7 | 9 | 12 | 6 |
| Hai Xin Yu Ji | 8 | 9 | 7 | 5 | 2 |
| Four Seas | 18 | 1 | 2 | 4 | 1 |
| Da Yu Shi / Harvest Fish Harbor | 13 | 9 | 3 | 0 | 0 |
| Ocean Gala | 2 | 5 | 3 | 7 | 8 |
| Top five launch types | |||||
| New variety / range extension | 128 | 146 | 110 | 121 | 110 |
| New product | 113 | 116 | 113 | 63 | 87 |
| New packaging | 26 | 27 | 30 | 28 | 24 |
| Relaunch | 0 | 1 | 0 | 2 | 2 |
| New formulation | 0 | 0 | 1 | 2 | 1 |
| Top five flavours (including blend) | |||||
| Unflavoured/plain | 215 | 234 | 176 | 152 | 158 |
| Hot | 5 | 4 | 11 | 6 | 16 |
| Spice/spicy | 5 | 4 | 9 | 11 | 9 |
| Cheese | 2 | 5 | 9 | 2 | 3 |
| Garlic | 1 | 6 | 3 | 5 | 5 |
| Top store type | |||||
| Supermarket | 107 | 137 | 108 | 132 | 121 |
| Mass merchandise / hypermarket | 109 | 100 | 66 | 53 | 47 |
| Internet / mail order | 15 | 36 | 75 | 26 | 33 |
| Department store | 32 | 17 | 2 | 3 | 14 |
| Club store | 4 | 0 | 0 | 0 | 6 |
| Source: Mintel, 2021 | |||||
Examples of new product launches
Cold Water Shrimp

Source: Mintel, 2021
| Company | Hao Da Food |
|---|---|
| Distributor | Bei Yang Jia Mei Aquatic |
| Brand | Seamix |
| Import status | Not imported |
| Store name | Auchan |
| Store type | Mass merchandise / hypermarket |
| Date published | June 2019 |
| Launch type | New packaging |
| Price in local currency | CNY29.60 |
| Price in US dollars | 4.29 |
Seamix Bei Ji Xia (Cold Water Shrimp) have been repackaged. They are caught in the North Atlantic, and are described as firm, fleshy and sweet. This protein-rich premium product is microwaveable and retails in a new 365 gram pack bearing the MSC logo, a QR code and Tao Xian Da mobile Apps information.
Frozen Arctic Surf Clams

Source: Mintel, 2021
| Company | Clearwater Seafoods |
|---|---|
| Importer | Hao Kang Trading |
| Brand | Clearwater |
| Location of manufacture | Canada |
| Import status | Imported product |
| Store name | Tmall |
| Store type | Internet / mail order |
| Date published | March 2018 |
| Launch type | New product |
| Price in local currency | CNY98.0 |
| Price in US dollars | 15.48 |
Clearwater Leng Dong Bei Ji Bei (Frozen Arctic Surf Clams) are described as wild surf clams that have been frozen and cooked aboard the boat. This ready-to-serve product is MSC certified and retails in a 350 gram pack bearing a QR code and preparation instructions.
Boston Lobster

Source: Mintel, 2021
| Company | Rui Nian Trade |
|---|---|
| Manufacturer | Shuang Yi Trading |
| Import status | Not imported |
| Store name | Aeon Supermarket |
| Store type | Supermarket |
| Date published | March 2020 |
| Launch type | New variety / range extension |
| Price in local currency | CNY118.00 |
| Price in US dollars | 16.80 |
Scfwin Bo Shi Dun Long Xia (Boston Lobster) is grown in cold sea water, and is described as fleshy, juicy, delicate, tender, firm and smooth. This fresh and tasty product retails in a 400 gram pack featuring cooking recipes, and bearing a QR code.
Snow Crab

Source: Mintel, 2021
| Company | Fu Bao Food |
|---|---|
| Brand | Fu Zhi Bao |
| Import status | Not imported |
| Store name | Aeon Supermarket |
| Store type | Supermarket |
| Date published | March 2020 |
| Launch type | New variety / range extension |
| Price in local currency | CNY149.00 |
| Price in US dollars | 21.21 |
Fu Zhi Bao Xue Xie (Snow Crab) is now available. This frozen and cooked product retails in a 500 gram pack.
Iceland Wild Sea Cucumber
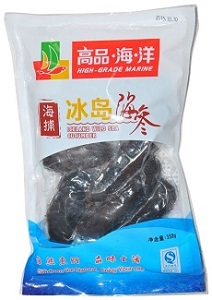
Source: Mintel, 2021
| Company | Rui Nian Trade |
|---|---|
| Brand | High-Grade Marine |
| Import status | Not imported |
| Store name | Huarunwanjia supermarket |
| Store type | Supermarket |
| Launch type | New variety / range extension |
| Price in local currency | CNY57.80 |
| Price in US dollars | 9.16 |
High-Grade Marine Hai Bu Bing Dao Hai Shen (Iceland Wild Sea Cucumber) is processed using a quick freezing technique to preserve the nutrients and taste without adding chemical ingredients and preservatives. This nutritious product is rich in amino acids and retails in a 330 gram pack.
Novwegian Arctic Cod

Source: Mintel, 2021
| Company | Spring Food |
|---|---|
| Brand | Ai Chi Yu |
| Location of manufacture | China |
| Import status | Not imported |
| Store name | Walmart |
| Store type | Merchandise / hypermarket |
| Date published | January 2020 |
| Launch type | New variety / range extension |
| Price in local currency | CNY138.00 |
| Price in US dollars | 19.81 |
Ai Chi Yu Nuo Wei Bei Ji Xue Yu (Norwegian Arctic Cod) consists of wild caught Arctic cod fillets which are high in protein and low in fat. This MSC certified product bearing a QR code retails in a 1 kilogram pack containing four units of two fillets each.
Frozen New Zealand Greenshell Mussels

Source: Mintel, 2021
| Company | Zhang Shi Seafood Process |
|---|---|
| Distributor | Rizheng Trading |
| Brand | Ocean Gala |
| Market | China |
| Import status | Not imported |
| Store name | Ole |
| Store type | Supermarket |
| Date published | December 2020 |
| Launch type | New variety / range extension |
| Price in local currency | CNY68.00 |
| Price in US dollars | 10.41 |
Ocean Gala Su Dong Xin Xi Lan Qing Kou Bei (Frozen New Zealand Greenshell Mussels) are mussels that are naturally grown in New Zealand's pure sea. The cooked half shell mussels are described as clean, tender, delicate, fresh, sweet and tasty. This product retails in a 400 gram pack bearing cooking suggestions and a QR code.
New Zealand King Salmon Bites

Source: Mintel, 2021
| Company | Future Cuisine Trading |
|---|---|
| Manufacturer | He Cheng Food |
| Brand | Future Cuisine |
| Import status | Not imported |
| Store name | He Ma Xian Sheng |
| Store type | Supermarket |
| Date published | November 2019 |
| Launch type | New variety / range extension |
| Price in local currency | CNY68.00 |
| Price in US dollars | 9.66 |
Future Cuisine Xin Xi Lan Di Wang Gui Yi Kou Zhuang (New Zealand King Salmon Bites) are sourced from the Southern Alps in New Zealand, and contain multi-vitamins, trace elements and omega-3 fish oil fatty acid. The salmon is described as melt-in-the-mouth, fresh tasting and nutritious. The product retails in a 200 gram pack with a recipe suggestion.
Japanese Style Roasted Eel

Source: Mintel, 2021
| Company | Sandugang Aquatic Food |
|---|---|
| Manufacturer | Jin Sheng Aquatic Product |
| Brand | Sandugang |
| Import status | Not imported |
| Store name | Ito Yokado |
| Store type | Supermarket |
| Date published | November 2020 |
| Launch type | New packaging |
| Price in local currency | CNY79.90 |
| Price in US dollars | 12.09 |
Sandugang Ri Shi Pu Shao Man Yu Duan (Japanese Style Roasted Eel) retails in a newly designed 300 gram pack. The product can be heated in a microwave.
Five Star Family Feast Stewed Abalone with Abalone Sauce

Source: Mintel, 2021
| Company | Liang Feng Yuan Food |
|---|---|
| Manufacturer | Guang Yun Food |
| Brand | Liangfengyuan |
| Import status | Not imported |
| Store name | JD |
| Store type | Internet / mail order |
| Date published | November 2020 |
| Launch type | New product |
| Price in local currency | CNY89.00 |
| Price in US dollars | 13.31 |
Liangfengyuan Wu Xing Jia Yan Xiao Jin Wan Da Shi Ji Pin Bao (Five Star Family Feast Stewed Abalone with Abalone Sauce) is now available. This product retails in a 220 gram pack bearing a QR code and heating instructions.
Wild Rice Fish Maw

Source: Mintel, 2021
| Company | Hydewin Marine Technology Development |
|---|---|
| Manufacturer | Zheng Fang Sheng Food Industrial |
| Brand | Hydewin |
| Import status | Not imported |
| Store name | wan jia |
| Store type | Supermarket |
| Date published | February 2020 |
| Launch type | New formulation |
| Price in local currency | CNY28.90 |
| Price in US dollars | 4.13 |
Hydewin Ye Mi Hua Jiao (Wild Rice Fish Maw) has been reformulated with a new recipe. This healthy product is described as easy and quick to prepare, and retails in a 300 gram pack with serving instructions, a WeChat QR code and a regular QR code.
Ling Long Cooked Crabs in Wine

Source: Mintel, 2021
| Company | Zi Qi Cultural Communication |
|---|---|
| Manufacturer | Pang Xie Aquatic |
| Brand | Li Zi Qi |
| Import status | Not imported |
| Store name | Tmall |
| Store type | Internet / mail order |
| Date published | January 2020 |
| Launch type | New product |
| Price in local currency | CNY139.00 |
| Price in US dollars | 19.96 |
Li Zi Qi Ling Long Shu Zui Xie (Ling Long Cooked Crabs in Wine) is steamed in Huadiao Chinese wine. The product is described as tasty and nutritious with a floral aroma, and retails in an 850 gram pack.
For more information
The Canadian Trade Commissioner Service:
International Trade Commissioners can provide Canadian industry with on-the-ground expertise regarding market potential, current conditions and local business contacts, and are an excellent point of contact for export advice.
More agri-food market intelligence:
International agri-food market intelligence
Discover global agriculture and food opportunities, the complete library of Global Analysis reports, market trends and forecasts, and information on Canada's free trade agreements.
Agri-food market intelligence service
Canadian agri-food and seafood businesses can take advantage of a customized service of reports and analysis, and join our email subscription service to have the latest reports delivered directly to their inbox.
More on Canada's agriculture and agri-food sectors:
Canada's agriculture sectors
Information on the agriculture industry by sector. Data on international markets. Initiatives to support awareness of the industry in Canada. How the department engages with the industry.
For additional information on China Fisheries & Seafood Expo, please contact:
Ben Berry, Deputy Director
Trade Show Strategy and Delivery
Agriculture and agri-food Canada
ben.berry@agr.gc.ca
Resources
- Canadian Association of Prawn Producers. 2021. 北极虾"南下"趋势锐不可当,"南宋版图"等待您开疆拓土! (Arctic shrimp "south" trend is unstoppable, "Southern Song map" waiting for you to open up the territory!)
- China Nutrition Society. 2021. 中国居民膳食指南科学研究报告(2021) (Scientific research report on dietary guidelines for Chinese residents (2021)).
- Crona, B., Wassénius, E., Troell, M., Barclay, K., Mallory, T., Fabinyi, M., Zhang, W., Lam, V. W. Y., Cao, L., Henriksson, P. J. G., & Eriksson, H. 2020. China at a Crossroads: An Analysis of China's Changing Seafood Production and Consumption.
- CBNData & Alibaba local life service company, 2019, CBNData 发布《2019线上生鲜消费发展趋势报告》 CBNData released the "2019 Online Fresh Consumption Development Trend Report"
- Euromonitor International. 2021.
- Euromonitor International. 2021. Fish and Seafood in China.
- Fabinyi, M. 2011. Historical, cultural and social perspectives on luxury seafood consumption in China. Environmental Conservation.
- Fabinyi, M. 2015. Producing for Chinese luxury seafood value chains: Different outcomes for producers in the Philippines and North America.
- Fabinyi, M. 2018. The Chinese seafood market: Opportunities and challenges for Australian exporters [Text]. Australia-China Relations Institute.
- Global Trade Tracker. 2021.
- Godfrey, Mark. 2021. Demand for seafood outstripping supply in China.
- Government of China. 2008. 国家粮食安全中长期规划纲要(2008-2020年 National Food Security Medium and Long-Term Planning Outline [2008-2020].
- Han, L. M., & Li, D. 2015. 蓝色粮仓":国家粮食安全的战略保障 (Blue Food System: Guarantee of China's Food Security).
- Mintel Global New Products Database. 2021.
- Mintel. 2020. A year of innovation in fish, 2020.
- Ministry of Agriculture and Rural Affairs of China. 2017. 大力推进供给侧结构性改革 加快实现渔业现代化——农业部副部长于康震就《全国渔业发展第十三个五年规划(2016-2020年)》发布答记者问(Vigorously promote the structural reform of the supply side to accelerate the modernization of fisheries—Vice Minister of Agriculture Yu Kangzhen on the release of the 13th Five-Year Plan for National Fisheries Development (2016-2020) Answer reporters' questions).
- Tan, S., and Wang, Y. (2020). Can China's "Stall Economy" Save Its Stalled Economy? Center for Strategic and International Studies.
- National Bureau of Statistics of China. 2020. China Statistical Yearbook 2020.
- OECD-FAO. 2021. Agricultural Outlook 2021-2030.
- Tian, C., Luan, W., Li, S., Xue, Y., & Jin, X. 2021. Spatial imbalance of Chinese seafood restaurants and its relationship with socioeconomic factors. Ocean & Coastal Management, 211, 105764.
- USDA. 2020. Continued Seafood Import Growth in 2019.
- Wang, O., Somogyi, S., & Ablett, R. 2021. The influences of quality attributes and socio-demographics on Chinese consumers' general and online consumptions of Canadian, US and Australian lobsters.
- Wu, L. 2021. 1年吃掉2.5万吨波龙,谁把高端海鲜端上了下沉市场的餐桌? (One year to eat 25,000 tons of Boston lobster, who put high-end seafood on the table of the sinking market?). CBNData.
- Yu, J., & Han, Q. 2020. Food security of mariculture in China: Evolution, future potential and policy.
Sector Trend Analysis – Fish and seafood trends in China
Global Analysis Report
Prepared by: Zhiduo Wang, Market Analyst
© Her Majesty the Queen in Right of Canada, represented by the Minister of Agriculture and Agri-Food (2022).
Photo credits
All photographs reproduced in this publication are used by permission of the rights holders.
All images, unless otherwise noted, are copyright Her Majesty the Queen in Right of Canada.
To join our distribution list or to suggest additional report topics or markets, please contact:
Agriculture and Agri-Food Canada, Global Analysis1341 Baseline Rd, Tower 5, 3rd floor
Ottawa ON K1A 0C5
Canada
Email: aafc.mas-sam.aac@agr.gc.ca
The Government of Canada has prepared this report based on primary and secondary sources of information. Although every effort has been made to ensure that the information is accurate, Agriculture and Agri-Food Canada (AAFC) assumes no liability for any actions taken based on the information contained herein.
Reproduction or redistribution of this document, in whole or in part, must include acknowledgement of agriculture and agri-food Canada as the owner of the copyright in the document, through a reference citing AAFC, the title of the document and the year. Where the reproduction or redistribution includes data from this document, it must also include an acknowledgement of the specific data source(s), as noted in this document.
Agriculture and Agri-Food Canada provides this document and other report services to agriculture and food industry clients free of charge.