

Note: This report includes forecasting data that is based on baseline historical data.
Executive summary
Mexico was a net exporter of fish and seafood products, representing a trade surplus of US$347.2 million in 2021. Over the same period, Mexico exported US$1.3 billion to the world.
Mexico was the 27th largest importer of fish and seafood products from the world at a value of US$975.9 million (304,013 tonnes), representing a 0.6% value market share in 2021. Mexico's top three suppliers was China, Chile, and the United States (US), which accounted for 62.8% of all its fish and seafood imports over the last year. Canada was the 20th largest supplier to Mexico at exports of US$3.2 million (market share: 0.4%).
In 2021, Mexico's top six products imported from the world were frozen types of fish and seafood: frozen fillets of tilapia, fillets of Pacific, Atlantic and Danube salmon, shrimps and prawns, even smoked (excluding cold-water), fillets of catfish, and skipjack or stripe-bellied bonito. Mexico's imports from the world have been declining by a compound annual growth rate (CAGR) of −9.4% between 2017 and 2021.
Canada exported Can$1.6 million of fish and seafood products to Mexico in 2021, decreasing at a 5-year CAGR of −0.3%. The top Canadian export products were live lobsters, frozen sea fish not elsewhere specified (n.e.s.), frozen Capelin or herrings, and other products of fish, shellfish, aqua invertebrates and dead animals n.e.s., not for human consumption. Nova Scotia (Can$737.1 thousand) was the largest Canadian export province to Mexico, followed by Newfoundland (Can$600.7 thousand), and British Columbia (Can$254.4 thousand).
In 2021, Mexico's retail sales of fresh and packaged fish and seafood products reached a total of US$5.3 billion (667,200 tonnes); and foodservice sales reached a total volume of 282,800 tonnes. When the COVID-19 pandemic hit the country, sales within the fresh category was severely impacted where many consumers shifted towards pre-packaged processed fish and seafood products that were ready-to-go and could be stored for several days - contrary to the norm purchasing habits in Mexico with particular increased demand during the lent season (pre-pandemic).
Production and consumption
Global fish production, trade, and consumption all contracted strongly over the first half of 2020, whereby trends differed across species and products. The slight decline in production was driven by lower aquaculture output rather than capture fisheries that remained largely unchanged. According to the FAO Fish Price Index, International fish prices were 7% lower on average in 2020 (compared to 2019), due to the significantly lower demand from out-of-home food services (HORECA - hotel, restaurant, catering) during the pandemic. Overall, global per capita fish intake declined by about 0.5 kilograms in 2020 to 20.2 kilograms (14 kilograms in Mexico) with nominal fish prices expected to increase at a rate between 0.8% and 1.6% per annum over the 2021-2030 period (OECD-FAO Agricultural Outlook 2021-2030).
Mexico produced 1.7 million tonnes of fish (including molluscs and crustaceans) with a value of US$2,799.7 million in 2018. This amount consisted of 29% coming from aquaculture and 71% from fisheries (capture of wild resources). Over the last decade (2008-2018), the quantity produced increased by 5%, while its value increased by 85%. (OECD - Fisheries and Aquaculture in Mexico, 2021).
Globally, fisheries and aquaculture production is an important source of nutrition, and a basis of livelihoods. However, the demand for quality, sustainable, yet cost-effective fish and seafood products has proven to be challenging for small local fishing cooperatives (co-ops). Access to competitive markets is costly and small entrepreneurs in Mexico have to rely on expensive middlemen to prepare and market their catch. However, the SmartFish seafood company has a model to help small fishing co-ops succeed by adopting sustainable practices that can for the first time cut out the middleman, and better prepare them to compete directly with large commercial operators.Footnote 1
Trade overview
In 2021, the world imported a total of US$163.7 billion (37,399.3 kilotonnes) in fish and seafood products. The top five global import markets were the US, China, Japan, Spain, and France, which accounted for a total of US$79.0 billion or a market share of 47.4% in 2021.
In 2021, Mexico was a net exporter of fish and seafood products with an export value of US$1.3 billion and an import value of US$975.9 million, representing a trade surplus of US$347.2 million. Mexico was the 28th largest fish and seafood import market in the world with a 0.6% market share in 2021, and a declining CAGR of −9.4% (2017-2021). Over the same period, Canada ranked as the 14th largest import market (2.2%) with an increasing 5-year CAGR of 5.2%.
| Country | 2017 | 2018 | 2019 | 2020 | 2021 | CAGR* % 2017-2021 | Market share (%) in 2021 |
|---|---|---|---|---|---|---|---|
| Total - world imports | 149.2 | 161.2 | 160.6 | 150.1 | 163.7 | 2.4 | 100.0 |
| 1. United States | 23.0 | 24.0 | 23.5 | 23.0 | 30.2 | 7.1 | 18.1 |
| 2. China | 11.1 | 14.7 | 18.4 | 15.3 | 17.8 | 12.4 | 10.6 |
| 3. Japan | 15.4 | 15.8 | 15.6 | 13.6 | 14.3 | −1.9 | 8.6 |
| 4. Spain | 8.1 | 8.7 | 8.2 | 7.4 | 8.9 | −3.1 | 5.3 |
| 5. France | 6.9 | 7.2 | 6.8 | 6.5 | 7.9 | 3.3 | 4.7 |
| 6. Italy | 6.6 | 7.1 | 6.7 | 6.2 | 6.8 | −2.4 | 4.1 |
| 7. Korea | 5.2 | 6.1 | 5.7 | 5.5 | 6.0 | 3.8 | 3.6 |
| 8. Germany | 5.9 | 6.2 | 6.0 | 6.1 | 5.9 | 1.0 | 3.5 |
| 9. Sweden | 5.0 | 5.6 | 5.3 | 5.1 | 5.5 | 2.9 | 3.3 |
| 10. Netherlands | 4.3 | 4.5 | 4.5 | 4.6 | 5.0 | 3.6 | 3.0 |
| Subtotal - top 10 markets | 91.5 | 99.9 | 100.7 | 93.1 | 108.3 | 4.3 | 64.9 |
| 14. Canada | 3.0 | 3.1 | 3.3 | 3.0 | 3.7 | 5.2 | 2.2 |
| 28. Mexico | 0.940 | 0.928 | 0.834 | 0.700 | 0.976 | −9.4 | 0.6 |
|
Source: Global Trade Tracker, 2022 *CAGR: Compound Annual Growth Rate |
|||||||
In 2021, Mexico ranked as the 29th largest fish and seafood market globally in terms of volume share (0.8%) at imports of 304,013 tonnes, increasing at a CAGR of 0.2% (2017-2021). Canada ranked 18th in the world in volume terms (1.6% market share) with a CAGR of 2.1% over the same period.
| Country | 2017 | 2018 | 2019 | 2020 | 2021 | CAGR* % 2017-2021 | Market share (%) in 2021 |
|---|---|---|---|---|---|---|---|
| Total - world imports | 38,301.8 | 309,937.6 | 39,938.5 | 40,726.4 | 37,399.3 | −1.0 | 100.0 |
| 1. China | 4,889.7 | 5,214.9 | 6,256.8 | 5,667.2 | 5,744.6 | 4.1 | 15.4 |
| 2. United States | 2,820.2 | 2,901.3 | 2,825.7 | 2,907.4 | 3,267.5 | 3.7 | 8.7 |
| 3. Japan | 2,476.6 | 2,380.7 | 2,464.4 | 2,251.3 | 2,199.6 | −2.9 | 5.9 |
| 4. Thailand | 1,902.2 | 2,126.5 | 2,047.6 | 2,149.3 | 2,102.5 | 2.5 | 5.6 |
| 5. Spain | 1,775.7 | 1,768.4 | 1,820.8 | 1,713.7 | 1,815.1 | −1.5 | 4.9 |
| 6. Korea | 1,481.4 | 1,558.4 | 1,531.4 | 1,536.6 | 1,652.7 | 2.8 | 4.4 |
| 7. France | 1,200.2 | 1,212.9 | 1,227.7 | 1,222.6 | 1,346.5 | 2.9 | 3.6 |
| 8. Denmark | 1,251.0 | 1,293.5 | 1,245.6 | 1,183.7 | 1,244.7 | −1.7 | 3.3 |
| 9. Germany | 1,185.8 | 1,203.8 | 1,172.9 | 1,216.1 | 1,124.5 | −3.8 | 3.0 |
| 10. Netherlands | 1,089.9 | 1,097.6 | 1,066.9 | 1,104.7 | 1,106.8 | 0.4 | 3.0 |
| Subtotal - top 10 markets | 20,072.6 | 20,758.0 | 21,659.7 | 20,952.5 | 21,604.5 | 1.9 | 57.8 |
| 11. Italy | 1,103.8 | 1,133.7 | 1,145.0 | 1,046.8 | 1,051.1 | −3.7 | 2.5 |
| 12. Sweden | 733.2 | 815.9 | 818.5 | 860.7 | 845.7 | 3.6 | 2.3 |
| 18. Canada | 536.4 | 523.0 | 544.3 | 520.4 | 582.0 | 2.1 | 1.6 |
| 29. Mexico | 301.4 | 294.8 | 268.6 | 251.8 | 304.0 | 0.2 | 0.8 |
|
Source: Global Trade Tracker, 2022 *CAGR: Compound Annual Growth Rate |
|||||||
In terms of value in 2021, China, Chile and the United States were the top suppliers of fish and seafood to Mexico with a market share of 37%, 14.5% and 11.3%, respectively. Canada was the 20th largest supplier to Mexico at exports of US$3.2 million and a market share of 0.3%. The value of Canadian fish and seafood exports to Mexico decreased continuously at a CAGR of −17.3% from 2017 to 2021.
| Country | 2017 | 2018 | 2019 | 2020 | 2021 | CAGR* % 2017-2021 | Market share (%) in 2021 |
|---|---|---|---|---|---|---|---|
| Total - world imports | 940.3 | 927.7 | 833.8 | 699.9 | 975.9 | −9.4 | 100.0 |
| 1. China | 311.4 | 349.3 | 284.6 | 261.6 | 361.3 | −5.6 | 37.0 |
| 2. Chile | 143.3 | 137.5 | 140.8 | 123.7 | 141.2 | −4.8 | 14.5 |
| 3. United States | 105.3 | 76.1 | 71.8 | 85.4 | 110.1 | −6.8 | 11.3 |
| 4. Vietnam | 126.4 | 118.0 | 127.5 | 63.4 | 85.4 | −20.5 | 8.8 |
| 5. Honduras | 36.2 | 5.9 | 21.1 | 12.7 | 52.9 | −29.5 | 5.4 |
| 6. Nicaragua | 14.0 | 13.7 | 8.5 | 6.8 | 31.5 | −21.5 | 3.2 |
| 7. Peru | 11.6 | 21.8 | 26.7 | 26.1 | 26.6 | 30.9 | 2.7 |
| 8. Ecuador | 14.0 | 13.8 | 12.5 | 16.1 | 19.1 | 4.6 | 2.0 |
| 9. Norway | 19.6 | 15.6 | 18.1 | 15.2 | 18.5 | −8.0 | 1.9 |
| 10. Taiwan | 1.2 | 3.6 | 0.147 | 8.6 | 14.9 | 90.9 | 1.5 |
| Subtotal - top 10 markets | 783.1 | 755.4 | 711.6 | 619.7 | 861.5 | 2.4 | 88.3 |
| Canada (20th) | 5.9 | 5.7 | 4.8 | 3.4 | 3.2 | −17.3 | 0.3 |
|
Source: Global Trade Tracker, 2022 *CAGR: Compound Annual Growth Rate |
|||||||
In terms of volume, China (share: 43.2%), Vietnam (12.9%) and the United States (9.9%) were the top suppliers of fish and seafood to Mexico in 2021, growing or declining at a CAGR of +6.1%, −11.3% and −5.5%, respectively from 2017 to 2021. Canada was the 20th largest supplier at 1,105 tonnes and a market volume share of 0.4%. Mexico's imports from Canada declined by −11.5% between 2017 and 2021.
| Country | 2017 | 2018 | 2019 | 2020 | 2021 | CAGR* % 2017-2021 | Market share (%) in 2021 |
|---|---|---|---|---|---|---|---|
| Total - world imports | 301,369 | 294,752 | 268,584 | 251,778 | 304,013 | 0.2 | 100.0 |
| 1. China | 103,797 | 120,667 | 109,105 | 113,297 | 131,442 | 6.1 | 43.2 |
| 2. Vietnam | 63,290 | 47,403 | 50,538 | 30,133 | 39,213 | −11.3 | 12.9 |
| 3. United States | 37,821 | 22,984 | 20,969 | 32,530 | 30,108 | −5.5 | 9.9 |
| 4. Chile | 23,019 | 19,961 | 18,262 | 19,331 | 19,368 | −4.2 | 6.4 |
| 5. Peru | 5,701 | 7,072 | 9,557 | 10,575 | 12,113 | 20.7 | 4.0 |
| 6. Taiwan | 622 | 1,919 | 102 | 5,571 | 9,986 | 100.2 | 3.3 |
| 7. Ecuador | 7,127 | 7,046 | 6,614 | 8,687 | 9,959 | 8.7 | 3.3 |
| 8. Nauru | − | 1,000 | 1,010 | 4,349 | 8,599 | 104.9 | 2.8 |
| 9. Korea | 13,150 | 10,088 | 12,870 | 246 | 8,225 | −11.1 | 2.7 |
| 10. Honduras | 5,145 | 823 | 3,563 | 4,019 | 7,371 | 9.4 | 2.4 |
| Subtotal - top 10 markets | 259,672 | 238,963 | 232,590 | 228,738 | 276,384 | 1.6 | 90.9 |
| 11. Nicaragua | 1,828 | 1,979 | 1,258 | 1,138 | 4,967 | 28.4 | 1.6 |
| 15. Norway | 2,448 | 1,870 | 2,083 | 2,244 | 2,550 | 1.0 | 0.8 |
| Canada (20th) | 1,801 | 2,454 | 1,460 | 1,234 | 1,105 | −11.5 | 0.4 |
|
Source: Global Trade Tracker, 2022 *CAGR: Compound Annual Growth Rate |
|||||||
Frozen types of fillets of tilapia, fillets of Pacific, Atlantic and Danube salmon, and shrimps and prawns, in shell or not, even smoked (excluding cold-water) were the top three products that Mexico imported from the world. Most imports of the top 10 products from the world have been decreasing, representing a small CAGR of 3.7% (2017-2021). Amongst these top products, there was only continued small growth in the imports of frozen fillets of tilapia and prepared/preserved fish, along with the import of frozen cuttle fish and squid in 2021. None of these top products were imported from Canada over the last five years, at the exception of frozen fillets of salmon (HS: 030481) back in 2018.
| HS code | Description | 2017 | 2018 | 2019 | 2020 | 2021 | CAGR* % 2017-2021 |
|---|---|---|---|---|---|---|---|
| Total - Mexico's imports from the world | 940.3 | 927.7 | 833.8 | 699.9 | 975.9 | −9.4 | |
| 030461 | Frozen fillets of tilapia | 129.9 | 183.4 | 162.3 | 154.9 | 226.2 | 6.0 |
| 030481 | Frozen fillets of Pacific, Atlantic and Danube salmon | 104.9 | 92.1 | 100.1 | 89.6 | 99.4 | −5.1 |
| 030617 | Frozen shrimps and prawns, whether in shell or not, even smoked (excluding cold-water) | 54.5 | 29.1 | 40.9 | 29.3 | 93.4 | −18.7 |
| 030462 | Frozen fillets of catfish | 103.8 | 96.8 | 102.0 | 48.6 | 65.3 | −22.3 |
| 030343 | Frozen skipjack or stripe-bellied bonito | 90.7 | 78.5 | 49.1 | 44.9 | 61.3 | −20.9 |
| 160414 | Tunas, skipjack and Atlantic bonito, whole or in pieces (excluding minced) | 68.4 | 69.8 | 28.6 | 46.2 | 57.5 | −12.2 |
| 160529 | Prepared/preserved shrimps and prawns, in airtight containers (excluding smoked) | 41.8 | 43.8 | 34.6 | 23.3 | 39.4 | −17.7 |
| 160521 | Prepared/preserved shrimps and prawns, not in airtight containers (excluding smoked) | 17.6 | 16.6 | 16.5 | 10.7 | 36.8 | −15.2 |
| 030743 | Frozen cuttle fish and squid, with or without shell | 33.2 | n/a | ||||
| 160420 | Prepared/preserved fish (excluding whole or in pieces) | 26.9 | 28.2 | 30.0 | 27.0 | 27.1 | 0.1 |
| Subtotal - top 10 imports | 638.5 | 638.4 | 564.2 | 474.6 | 739.7 | 3.7 | |
|
Source: Global Trade Tracker, 2022 *CAGR: Compound Annual Growth Rate n/a: Not applicable |
|||||||
Top ten fish and seafood suppliers to the Mexico in 2021 (US dollars)
| Description | Import value (in millions) |
|---|---|
| Frozen fillets of tilapia | 226.0 |
| Tunas, skipjack and Atlantic bonito, whole or in pieces (excluding minced) | 46.0 |
| Prepared* shrimps/prawns, not in airtight container (excluding smoked) | 26.6 |
| Frozen tilapia | 24.3 |
| Frozen cuttle fish and squid, with(out) shell | 6.2 |
|
Source: Global Trade Tracker, 2022 *Prepared: including preserved |
|
| Description | Import value (in millions) |
|---|---|
| Frozen fillets of Pacific, Atlantic and Danube salmon | 92.4 |
| Fresh/chilled fillets of Pacific, Atlantic and Danube salmon | 15.5 |
| Fresh/chilled Atlantic and Danube salmon | 9.8 |
| Frozen Atlantic and Danube salmon | 4.4 |
| Flours, meals and pellets of fish, crustaceans, molluscs or other, unfit for human consumption | 3.4 |
| Source: Global Trade Tracker, 2022 | |
| Description | Import value (in millions) |
|---|---|
| Prepared shrimps/prawns, not in airtight container (excluding smoked) | 20.1 |
| Prepared fish (excluding whole or in pieces) | 19.9 |
| Frozen skipjack or stripe-bellied bonito | 17.4 |
| Prepared shrimps/prawns, not in airtight container (excluding smoked) | 7.6 |
| Prepared salmon, whole or in pieces (excluding minced) | 5.4 |
| Source: Global Trade Tracker, 2022 | |
| Description | Import value (in millions) |
|---|---|
| Frozen fillets of catfish | 65.2 |
| Frozen fillets of tuna, skipjack or stripe-bellied bonito | 7.5 |
| Frozen catfish | 4.3 |
| Other frozen fish meat n.e.s.* (excluding fillets) | 3.3 |
| Other fish fillets, n.e.s.* | 3.2 |
|
Source: Global Trade Tracker, 2022 *n.e.s.: nowhere else specified |
|
| Description | Import value (in millions) |
|---|---|
| Frozen shrimps and prawns, with(out) shell, even smoked (excluding cold-water) | 46.4 |
| Prepared shrimps/prawns, not in airtight container (excluding smoked) | 5.5 |
| Frozen rock lobster and other sea crawfish, with(out) shell | 0.709 |
| Flours, meals and pellets of fish, crustaceans, molluscs or other, unfit for human consumption | 0.289 |
| Live, fresh, chilled, frozen, dried, salted or in brine, even smoked, jellyfish | 0.036 |
| Source: Global Trade Tracker, 2022 | |
| Description | Import value (in millions) |
|---|---|
| Frozen shrimps and prawns, with(out) shell, even smoked (excluding cold-water) | 29.6 |
| Prepared sea cucumbers (excluding smoked) | 0.849 |
| Other frozen fillets fillets, n.e.s.* | 0.652 |
| Frozen rock lobster and other sea crawfish, with(out) shell | 0.231 |
| Prepared shrimps/prawns, not in airtight container (excluding smoked) | 0.083 |
|
Source: Global Trade Tracker, 2022 *n.e.s.: nowhere else specified |
|
| Description | Import value (in millions) |
|---|---|
| Frozen cuttle fish and squid, with(out) shell | 21.0 |
| Flours, meals and pellets of fish, crustaceans, molluscs or other, unfit for human consumption | 3.5 |
| Fats and oils of fish and fractions, refined or not (excluding liver oils and chemically modified) | 0.517 |
| Frozen octopus | 0.476 |
| Other frozen fish fillets, n.e.s.* | 0.303 |
|
Source: Global Trade Tracker, 2022 *n.e.s.: nowhere else specified |
|
| Description | Import value (in millions) |
|---|---|
| Prepared sardines, sardinella and brisling or sprats, whole or in pieces (excluding minced) | 18.3 |
| Prepared fish (excluding whole or in pieces) | 0.510 |
| Frozen cuttlefish and squid, with(out) shell | 0.108 |
| Prepared shrimps/prawns, in airtight container (excluding smoked) | 0.084 |
| Prepared shrimps/prawns, not in airtight container (excluding smoked) | 0.083 |
| Source: Global Trade Tracker, 2022 | |
| Description | Import value (in millions) |
|---|---|
| Dried cod, even salted, not smoked (excluding fillets and offals) | 11.4 |
| Frozen fillets of Pacific, Atlantic and Danube salmon | 1.7 |
| Smoked Pacific, Atlantic and Danube salmon, including fillets (excluding offal) | 1.3 |
| Prepared salmon, whole or in pieces (excluding minced) | 1.2 |
| Dried fish (HS:030553), even salted/not smoked (excluding fillets, offal and cod) | 0.944 |
| Source: Global Trade Tracker, 2022 | |
| Description | Import value (in millions) |
|---|---|
| Frozen skipjack or stripe-bellied bonito | 11.8 |
| Frozen yellowfin tunas | 2.2 |
| Frozen bigeye tunas | 0.760 |
| Frozen meat of dogfish and other sharks, minced(not) | 0.037 |
| Frozen fillets of tilapia | 0.030 |
| Source: Global Trade Tracker, 2022 | |
Canada's performance
In 2021, Canada exported Can$1.6 million of fish and seafood products to Mexico. The top Canadian products exported to Mexico were live lobsters (43%), frozen Capelin, frozen herrings, frozen sea fish not elsewhere specified (n.e.s.) (27.5%), and other products of fish, shellfish, aqua invertebrates and dead animals n.e.s., not for human consumption (16%) (ie; fishmeal feed for the pet food industry and fish oil) in 2021. Between 2017 and 2021, the top 10 fish and seafood exports to Mexico have increased by a CAGR of 5.4%, while total exports decreased by a CAGR of −0.3%.
| HS code | Description | 2017 | 2018 | 2019 | 2020 | 2021 | CAGR* % 2017-2021 |
|---|---|---|---|---|---|---|---|
| Total - exports to Mexico | 1,622.4 | 2,556.6 | 1,806.6 | 1,456.8 | 1,601.5 | −0.3 | |
| 03063210 | Live lobsters | 779.0 | 849.5 | 913.7 | 342.0 | 688.3 | −3.0 |
| 03038919 | Frozen sea fish, n.e.s.[1] (excluding fish offal) | 0 | 0 | 0 | 0 | 440.8 | |
| 05119100 | Other products of fish, shellfish and aqua invertebrates and dead animals, n.e.s, not for human consumption | 0 | 0 | 0 | 71.7 | 254.0 | 254.5 |
| 03035910 | Frozen Capelin (excluding offal) | 418.0 | 596.2 | 333.4 | 414.5 | 167.2 | −20.5 |
| 03035100 | Frozen Herrings (excluding fish offal) | 101.4 | 95.9 | 44.8 | 112.2 | 39.7 | −20.9 |
| 23012090 | Other flour, meals and pellets of fish, crustaceans, molluscs, etc. n.e.s.[1], unfit human consumption | 0 | 0 | 0 | 6.2 | 9.6 | 55.9 |
| 03056200 | Cod, salted or in brine, but not dried or smoked (excluding edible fish offal) | 0 | 0 | 0 | 0 | 0.628 | |
| 03056910 | Pollock, salted or in brine, but not dried or smoked (excluding edible fish offal) | 0 | 0 | 0 | 0 | 0.516 | |
| 03053210 | Cod fillets, dried, salted or in brine, but not smoked | 0 | 0 | 0 | 0 | 0.325 | |
| 03055900 | Other fish, dried, salted (not), but not smoked, n.e.s.[1] (excluding edible fish offal) | 0 | 0 | 0 | 0 | 0.171 | |
| Subtotal - top 10 exports | 1,298.3 | 1,541.6 | 1,291.9 | 946.5 | 1,601.3 | 5.4 | |
|
Source: CATSNET - Statistics Canada, 2022 *CAGR:Compound Annual Growth Rate 1: not elsewhere specified |
|||||||
Canada's fish and seafood exports to Mexico (by province)
In 2021, Nova Scotia (NS) was the largest Canadian export province of fish and seafood products at a value of Can$737.1 thousand, followed by Newfoundland (Can$600.7 thousand), British Columbia (Can$254.4 thousand), and Quebec (Can$9.2 thousand). Exports from Newfoundland and British Columbia (BC) accounted for the largest growths at a CAGR of 86.2% and 4.7%, respectively, between 2017 and 2021. At the same time, exports from Québec (−46.8%) and Nova Scotia (−10.5%) registered steeper declines. Other provinces previously exporting fish and seafood products to Mexico over the last five years (zero exports in 2021) were Alberta, Ontario and Prince Edward Island (PEI).
Amongst Canada's top fish and seafood products exported to Mexico in 2021, all of its Canadian live lobsters came from Nova Scotia; all frozen sea fish n.e.s. (HS:03038919) were from Newfoundland; all other products of fish, shellfish, aqua invertebrates and dead animals n.e.s., not for human consumption (HS:05119100) were from BC; frozen Capelin mostly came from Newfoundland (72%) with its remainder coming from NS; and all frozen Herrings came from Newfoundland, previously exported mostly from BC. Other fish types such as Cod and Pollock came from Nova Scotia in 2021. Notably, Canadian salmon types that generally came from Alberta and British Columbia in previous years were not exported to Mexico in 2021. Canada's supply to Mexico of fish fats and oils in its fractions, n.e.s. that typically came from Ontario and mussel types from PEI have diminished to zero exports over the last few years.
| Province | 2017 | 2018 | 2019 | 2020 | 2021 | CAGR* % 2017-2021 |
|---|---|---|---|---|---|---|
| Total - exports | 1,622,447 | 2,556,558 | 1,806,648 | 1,456,750 | 1,601,473 | −0.3 |
| Nova Scotia | 1,146,915 | 1,275,887 | 1,014,084 | 443,763 | 737,124 | −10.5 |
| Newfoundland | 50,000 | 373,096 | 232,932 | 377,992 | 600,667 | 86.2 |
| British Columbia | 211,666 | 207,982 | 241,445 | 151,184 | 254,434 | 4.7 |
| Québec | 115,700 | 0 | 0 | 14,471 | 9,248 | −46.8 |
| Alberta | 0 | 30,402 | 0 | 410,744 | 0 | −100.0 |
| Ontario | 0 | 669,191 | 318,187 | 0 | 0 | −100.0 |
| PEI | 98,166 | 0 | 0 | 58,596 | 0 | −100.0 |
|
Source: CATSNET - Statistics Canada, 2022 *CAGR: Compound Annual Growth Rate |
||||||
| HS codes | Description | 2017 | 2018 | 2019 | 2020 | 2021 | CAGR* % 2017-2021 |
|---|---|---|---|---|---|---|---|
| Total - exports to Mexico | 1,146.9 | 1,275.9 | 1,014.1 | 443.8 | 737.1 | −10.5 | |
| 03063210 | Live lobsters | 779.0 | 849.5 | 913.7 | 342.0 | 688.3 | −3.0 |
| 03035910 | Frozen Capelin (excluding offal) | 368.0 | 245.5 | 100.4 | 61.0 | 47.0 | −40.2 |
| 03056200 | Cod, salted or in brine, not dried or smoked (excluding edible fish offal) | 0.0 | 0.0 | 0.0 | 0.0 | 0.628 | |
| 03056910 | Pollock, salted or in brine, not dried or smoked (excluding edible fish offal) | 0.0 | 0.0 | 0.0 | 0.0 | 0.516 | |
| 03053210 | Cod fillets, dried, salted or in brine, but not smoked | 0.0 | 0.0 | 0.0 | 0.0 | 0.325 | |
| Subtotal - top 5 exports | 1,146.9 | 1,095.1 | 1,014.1 | 403.0 | 736.8 | −10.5 | |
|
Source: CATSNET - Statistics Canada, 2022 *CAGR: Compound Annual Growth Rate |
|||||||
| HS codes | Description | 2017 | 2018 | 2019 | 2020 | 2021 | CAGR* % 2017-2021 |
|---|---|---|---|---|---|---|---|
| Total - exports to Mexico | 50.0 | 373.1 | 232.9 | 378.0 | 600.7 | 86.2 | |
| 03038919 | Frozen sea fish, n.e.s.[1] (excluding fish offal) | 0.0 | 0.0 | 0.0 | 0.0 | 440.8 | |
| 03035910 | Frozen Capelin (excluding offal) | 50. | 350.7 | 232.9 | 353.4 | 120.2 | 24.5 |
| 03035100 | Frozen herrings (excluding fish offal) | 0.0 | 22.4 | 0.0 | 24.4 | 39.7 | 20.9 |
| 03038913 | Frozen ocean perch (excluding fish offal) | 0.0 | 0.0 | 0.0 | 0.126 | 0.0 | |
|
Source: CATSNET - Statistics Canada, 2022 *CAGR:Compound Annual Growth Rate 1: not elsewhere specified |
|||||||
| HS codes | Description | 2017 | 2018 | 2019 | 2020 | 2021 | CAGR* % 2017-2021 |
|---|---|---|---|---|---|---|---|
| Total - exports to Mexico | 211.7 | 208.0 | 241.4 | 151.2 | 254.4 | 4.7 | |
| 05119100 | Products of fish, shellfish and aqua invertebrates and dead animals, n.e.s.[1], not for human consumption | 0.0 | 0.0 | 0.0 | 57.2 | 244.8 | 328.1 |
| 23012090 | Flour, meals and pellets of fish, crustaceans, molluscs etc., n.e.s.[1], unfit human consumption | 0.0 | 0.0 | 0.0 | 6.2 | 9.6 | 55.9 |
| 03031210 | Frozen salmon, chum (excluding fish offal) | 110.2 | 0.0 | 196.6 | 0.0 | 0.0 | −100.0 |
| 03048100 | Frozen Pacific, Atlantic and Danube salmon fillets | 0.0 | 134.5 | 0.0 | 0.0 | 0.0 | |
| 03035100 | Frozen herrings (excluding fish offal) | 101.4 | 73.5 | 44.8 | 87.8 | 0.0 | −100.0 |
|
Source: CATSNET - Statistics Canada, 2022 *CAGR:Compound Annual Growth Rate 1: not elsewhere specified |
|||||||
| HS codes | Description | 2017 | 2018 | 2019 | 2020 | 2021 | CAGR* % 2017-2021 |
|---|---|---|---|---|---|---|---|
| Total - exports to Mexico | 115.7 | 0.0 | 0.0 | 14.5 | 9.2 | −46.8 | |
| 05119100 | Products of fish, shellfish and aqua invertebrates and dead animals, n.e.s.[1], not for human consumption | 0.0 | 0.0 | 0.0 | 14.5 | 9.2 | −36.1 |
| 12122100 | Seaweeds and other algae, ground (not), fit for human consumption | 115.7 | 0.0 | 0.0 | 0.0 | 0.0 | −100.0 |
|
Source: CATSNET - Statistics Canada, 2022 *CAGR:Compound Annual Growth Rate 1: not elsewhere specified |
|||||||
| HS codes | Description | 2017 | 2018 | 2019 | 2020 | 2021 | CAGR* % 2017 to 2021 |
|---|---|---|---|---|---|---|---|
| Total - exports to Mexico | 0.0 | 30.4 | 0.0 | 410.7 | 0.0 | −100.0 | |
| 03031210 | Frozen salmon, chum (excluding fish offal) | 0.0 | 0.0 | 0.0 | 410.7 | 0.0 | |
| 03032900 | Other frozen Nile perch and snakeheads | 0.0 | 30.4 | 0.0 | 0.0 | 0.0 | |
|
Source: CATSNET - Statistics Canada, 2022 *CAGR:Compound Annual Growth Rate |
|||||||
| HS codes | Description | 2017 | 2018 | 2019 | 2020 | 2021 | CAGR* % 2017-2021 |
|---|---|---|---|---|---|---|---|
| 15042090 | Fish fats and oils and its fractions, whether refined or not, n.e.s.[1] (excluding liver or chemically modified) | 0.0 | 669.2 | 318.2 | 0.0 | 0.0 | −100.0 |
|
Source: CATSNET - Statistics Canada, 2022 *CAGR:Compound Annual Growth Rate 1: not elsewhere specified |
|||||||
| HS codes | Description | 2017 | 2018 | 2019 | 2020 | 2021 | CAGR* % 2017-2021 |
|---|---|---|---|---|---|---|---|
| Total - exports to Mexico | 98.2 | 0.0 | 0.0 | 58.6 | 0.0 | −100.0 | |
| 03073200 | Frozen mussels, shell (not) | 0.0 | 0.0 | 0.0 | 58.6 | 0.0 | |
| 03073900 | Dried/salted/brine/smoked mussels | 98.2 | 0.0 | 0.0 | 0.0 | 0.0 | −100.0 |
|
Source: CATSNET - Statistics Canada, 2022 *CAGR: Compound Annual Growth Rate |
|||||||
Market sizes
In 2021, Mexico's retail sales of fish and seafood reached a total of US$5.3 billion (667,200 tonnes) representing a total volume decline of −8.0% since last year. Fresh types consisting of fish, crustaceans, molluscs and cephalopods accounted for 70.9%, while processed seafood categories (shelf stable, frozen, chilled) accounted for the remaining 29.1% of value sales.
When the COVID-19 pandemic hit the country, purchases of most fresh food items in the fish and seafood segment significantly declined in its frequency - contrary to pre-COVID habits where many consumers preferably purchased fresh on the day of consumption (notably, approximately 19% of the annual consumption of fish and seafood takes place during lent season between March and April). Due to the importance of freshness in the category, the fish and seafood sector experienced a more adverse effect from the global crisis than some other food sources of protein.Footnote 2
Many consumers shifted to pre-packaged processed fish and seafood products that were ready-to-go and could be stored for several days. Shelf stable processed seafood products remained as the largest category in terms of retail sales at US$1.3 billion in 2021, yet declined in volume annual growth by −3.3%. Moving away from fresh seafood, consumers alternatively turned towards chilled (US$64.1 million) and frozen (US$227.4 million) processed seafood products that registered volume annual growths of 9.1% and 7.1%, respectively.
| Category | 2017 | 2021 | CAGR* (%) 2017-2021 | 2022 | 2026 | CAGR* (%) 2022-2026 |
|---|---|---|---|---|---|---|
| Fresh fish and seafood | 2,941.5 | 3,749.5 | 6.3 | 3,965.9 | 5,012.6 | 6.0 |
| Fish | 2,094.0 | 2,678.9 | 6.4 | 2,823.0 | 3,522.4 | 5.7 |
| Crustaceans | 533.3 | 668.6 | 5.8 | 710.9 | 936.2 | 7.1 |
| Molluscs and cephalopods | 314.2 | 402.0 | 6.4 | 432.0 | 554.0 | 6.4 |
| Processed meat and seafood | 2,860.2 | 3,981.6 | 8.6 | 4,291.6 | 5,753.1 | 7.6 |
| Processed meat | 1,689.3 | 2,439.2 | 9.6 | 2,699.7 | 3,807.6 | 9.0 |
| Processed seafood | 1,170.9 | 1,542.3 | 7.1 | 1,591.9 | 1,945.5 | 5.1 |
| Shelf stable | 971.9 | 1,250.9 | 6.5 | 1,274.6 | 1,492.4 | 4.0 |
| Frozen | 154.8 | 227.4 | 10.1 | 247.5 | 356.4 | 9.5 |
| Chilled | 44.1 | 64.1 | 9.8 | 69.7 | 96.7 | 8.5 |
| Total - fresh/processed fish and seafood | 4,112.4 | 5,291.8 | 6.5 | 5,557.8 | 6,958.1 | 5.8 |
|
Source: Euromonitor, 2022 *CAGR: Compound Annual Growth Rate |
||||||
| Category | 2017 | 2021 | CAGR* (%) 2017-2021 | 2022 | 2026 | CAGR* (%) 2022-2026 |
|---|---|---|---|---|---|---|
| Fresh fish and seafood | 414.2 | 437.4 | 1.4 | 440.6 | 466.9 | 1.5 |
| Fish | 312.3 | 328.7 | 1.3 | 329.9 | 346.2 | 1.2 |
| Molluscs and cephalopods | 56.6 | 60.2 | 1.6 | 61.7 | 66.6 | 1.9 |
| Crustaceans | 45.3 | 48.5 | 1.7 | 49.0 | 54.1 | 2.5 |
| Processed meat and seafood | 517.1 | 605.1 | 4.0 | 624.3 | 704.5 | 3.1 |
| Processed meat | 306.4 | 375.3 | 5.2 | 398.2 | 475.3 | 4.5 |
| Processed seafood | 210.7 | 229.8 | 2.2 | 226.1 | 229.2 | 0.3 |
| Shelf stable | 188.6 | 203.1 | 1.9 | 198.4 | 196.1 | −0.3 |
| Frozen | 21.1 | 25.6 | 5.0 | 26.6 | 31.7 | 4.5 |
| Chilled | 1.0 | 1.2 | 4.7 | 1.2 | 1.4 | 3.9 |
| Total - fresh/processed fish and seafood | 624.9 | 667.2 | 1.7 | 666.7 | 696.1 | 1.1 |
|
Source: Euromonitor, 2022 *CAGR: Compound Annual Growth Rate |
||||||
In 2021, foodservice sales of fresh and processed fish and seafood in Mexico reached a total volume of 282,800 tonnes, representing a declining CAGR of −0.7% (2017-2021). All on-trade categories were hit particularly hard in 2020 with foodservice outlets and resorts that were closed for more than three months, while operating at a reduced capacity for much of the time throughout the remainder of the year. Albeit, total volume growth almost returned to pre-COVID amounts in 2021 as restrictions were eased, consumer confidence increased and tourists started to return to Mexico.Footnote 2 Nevertheless, although foodservice sales are expected to spike further ahead in 2022 (375,100 tonnes), the country is forecast to have a declining 5-year CAGR of −3.7% with another dip in sales in 2023 - to only reach 322,100 tonnes in 2026.
| Category | 2017 | 2021 | CAGR* (%) 2017-2021 | 2022 | 2026 | CAGR* (%) 2022-2026 |
|---|---|---|---|---|---|---|
| Fresh fish and seafood | 272.6 | 266.0 | −0.6 | 274.1 | 302.2 | 2.5 |
| Fish | 173.2 | 168.6 | −0.7 | 173.6 | 191.4 | 2.5 |
| Molluscs and cephalopods | 55.1 | 53.3 | −0.8 | 54.8 | 59.8 | 2.2 |
| Crustaceans | 44.3 | 44.1 | −0.1 | 45.7 | 51.0 | 2.8 |
| Processed meat and seafood | 102.3 | 96.3 | −1.5 | 101.0 | 115.0 | 3.3 |
| Processed meat | 83.7 | 79.6 | −1.2 | 83.5 | 95.1 | 3.3 |
| Processed seafood | 18.5 | 16.8 | −2.4 | 17.5 | 19.9 | 3.3 |
| Shelf stable | 15.4 | 13.8 | −2.7 | 14.4 | 16.3 | 3.1 |
| Frozen | 3.1 | 2.9 | −1.7 | 3.1 | 3.6 | 3.8 |
| Total - fresh/processed fish and seafood | 291.1 | 282.8 | −0.7 | 375.1 | 322.1 | −3.7 |
|
Source: Euromonitor, 2022 *CAGR: Compound Annual Growth Rate |
||||||
Competitive landscape
In 2021, leading retail companies (and brands) of processed seafood products in Mexico included the Pescados Industrializados SA de CV - known as Grupo PINSA (Dolores, Mazatún) at 29.3% value share, Grupo Marítimo Industrial SA de CV - known as Grupomar (Tuny) at 16.8%, and Grupo Herdez SAB de CV (Herdez) at 6.5%. Private label brands also, represented a large share of 16.9% in 2021.
Although, specialist retailers did not fair very well during the pandemic due to less purchases for fresh products, major fish and seafood processors supporting these outlets such as Comercializadora Osa Mayor, Comercializadora Blanca Arena, and Alimentos del Mar SA de CV are expected to recover much of their former sales over the forecast period.Footnote 2
| Company | Brand(s) | Retail sales value (US$ million) | Market share (%) |
|---|---|---|---|
| Pescados Industrializados SA de CV | Dolores, Mazatún | 451.8 | 29.3 |
| Grupo Marítimo Industrial SA de CV | Tuny | 259.2 | 16.8 |
| Herdez SAB de CV, Grupo | Herdez | 100.2 | 6.5 |
| Procesadora Especializada de Alimentos SA de CV | Marina Azul | 59.3 | 3.8 |
| Ahumados Noruegos SA de CV | Fiordo | 44.8 | 2.9 |
| Grupo Piscimex SA de CV | Sierra Madre | 34.8 | 2.3 |
| FCF Co Ltd. (commercialized by Grupo PINSA) | Brunswick | 33.1 | 2.1 |
| Justo López Valcárcel SA | El Vigilante | 32.0 | 2.1 |
| Alimentos del Mar SA de CV | Neptuno Productos del Mar | 31.0 | 2.0 |
| Pando, Grupo SA de CV | Calmex | 27.9 | 1.8 |
| Private label | Private label | 261.2 | 16.9 |
| Others | Others | 179.0 | 11.6 |
| Total - processed seafood | 1,542.3 | 100.0 | |
| Source: Euromonitor, 2022 | |||
Distribution channels
According to The Mexican Council of Promotion of Fishery and Aquaculture Products (CONAPESCA), the fish markets La Nueva Viga in Mexico City and Mercado del Mar in Zapopan, concentrate the highest trading in fish and seafood products in Mexico. La Nueva Viga is the second largest fish market in the world, after Tokyo's famous Tsukiji Market. COMEPESCA estimates that La Nueva Viga market sells more than 500 marine species, accounting for 65% of Mexico’s national production.
The distribution channels in which consumers chose to purchase their meat, fish and seafood products did not alter much between 2020 and 2021. Mexicans continued to avoid frequent outings by most often shopping from within modern grocery retailers such as hyper/supermarkets and discounters, which offer a large variety of products under one location and are able to support online orders.
When compared to pre-COVID sales, specialist stores have seen the most significant decline in traffic as some consumers also turned to purchasing packaged fish and seafood products from modern grocery retailers during the pandemic. Although, specialist stores are expected to recover in the forecast period, this switch to modern grocery outlets will likely remain popular and dampen sales of fresh fish and seafood from specialist outlets due to its convenience, safety and long shelf life.Footnote 2
| Outlet type | Market share % in 2020 | Market share % in 2021 | Percent point change* 2021-2020 |
|---|---|---|---|
| Store-based retailing - grand total: | 98.6 | 98.7 | 0.1 |
| Total - grocery retailers | 89.0 | 89.1 | 0.1 |
| Subtotal - modern grocery retailers | 45.8 | 45.8 | 0.0 |
| Hypermarkets | 15.2 | 15.2 | 0.0 |
| Discounters | 14.6 | 14.6 | 0.0 |
| Supermarkets | 13.2 | 13.2 | 0.0 |
| Convenience stores | 2.7 | 2.8 | 0.1 |
| Subtotal - traditional grocery retailers | 43.3 | 43.3 | 0.0 |
| Independent small grocers | 38.4 | 38.4 | 0.0 |
| Food/drink/tobacco specialists | 4.9 | 4.9 | 0.0 |
| Total - mixed retailers | 9.6 | 9.6 | 0.0 |
| Non-store retailing (e-commerce) - grand total: | 1.4 | 1.3 | −0.1 |
| Total - distribution channels | 100.0 | 100.0 | 100.0 |
|
Source: Euromonitor, 2022 *Percent point change: difference between 2021 and 2020 values |
|||
New product launch analysis
Mintel indicated that there were 155 packaged food or drink (7) products containing fish (153) and/or seafood (5) ingredients launched (including new variety/range extension, packaging, formulation or relaunched) in Mexico between the period of January 1st, 2017 and March 9th, 2022.
Total product item count (155) from (January 2017 to March 9, 2022)
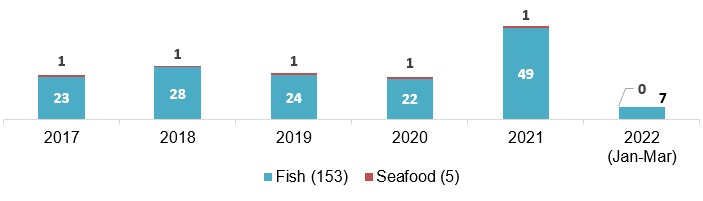
Description of above image
| 2017 | 2018 | 2019 | 2020 | 2021 | 2022 (January to March) | Total | |
|---|---|---|---|---|---|---|---|
| Fish | 23 | 28 | 24 | 22 | 49 | 7 | 153 |
| Seafood | 1 | 1 | 1 | 1 | 1 | 0 | 5 |
Source: Mintel, 2022
Fish and seafood ingredient products
Top parent companies launching fish food and drink products in Mexico over the five year period (January 2017-March 2022) were Nestlé (36), Laboratorios Ordesa (7), FrieslandCampina (6), and Nutricia (6) for its baby formula or milk powder products; Walmart for its varied fish and meal products (11); Novalimentos mostly for their sauces (11); Alimentos Kay for its fish stick, fillets, nuggets, and fish burger products (8), and Herdez for its tuna products (6). Mexico manufactured 57.4% of its fish and seafood products, followed by Spain (9.7%), the Netherlands (8.4%), and the US (5.8%) - no Canadian brands were found on the retail shelves. Top brands over this period were Nestlé Nido Kinder/NAN Optimal Pro (18), Herdez (6), Itto - Sushiitto (6), Ricamar (5), Great Value (5), Neptuno (4), Frisolac Gold (4), and Marketside (3).
Common fish and seafood ingredients found in these packaged products in Mexican retailers include shrimp, clam, mussel, fish Sirimi (pressed fish meat), and anchovy. Other related ingredients included clam/oyster/crab extract or natural clam flavor, hydrolized fish collagen or fish protein, fish fats (source of Omega-3 fatty acids), oxidized fish oil, fish sauce or seafood juice, squid ink, and bonito fish powder and extract.
In Mexico, the fish or seafood flavours that were launched the most were salmon, Caesar or seafood [Q1-2020-2021]. New or popular ingredients included fruit vinegar, Amaranth red, rapeseed, beetroot, and fibres. Health and wellness and other functional related or leading trend claims (mostly found on baby formula or milk products) included Kosher, Halal, vitamins/minerals plus, immune system support, brain/nervous system, bone health, functional - other, digestive health and premium. Amongst these products, top growing claims included ease of use.
In the Mexican market, baby food was the largest fish category with 62 (40%) new product launches, followed by processed fish, meat and egg at 46 products (29.7%), and sauces and seasonings or meal and meal centers at 32 combined products (20.6%) over the approximately 5-year period. The launch of new products had the largest growths in categories such as processed fish products, sauces and seasonings, juice drinks and meals and meal centers between Q1-2021 and Q1-2022. However, the baby food category has been declining by −22.2% during this period.
| Category | Top 50 brands launched (product item count) | Number of products |
|---|---|---|
| Baby food | Nestlé Nido Kinder/Pre-Escolar, Nestlé NAN Optimal Pro/Expert Pro Comfort/Supreme Pro (27), Frisolac Gold (4), Ordesa Sanfer Blemil Plus 1 or 2 (4), Nutricia Nutrilon Premium+ (3), Danone Aptamil - Pepti Allergy/Premium Pronutra+ (3), Friso Gold Comfort Next (1), Babynat Orgánico (1) | 62 |
| Processed fish, meat and egg products | Ricamar (5), Herdez (4), Great Value (2), Neptuno (4), Marketside (3), Nair (3), Member's Mark (2), Angulas Mayoz (2), Disney - Pixar Toy Story (2), Atún Dolores/ Nuestros Sabores (2), Foncard Gourmet (1), Chata (1), Avilés Altamar (1), Antiqua Delicatessen (1), Aquamar (1) | 46 |
| Sauces and seasonings | Itto - Sushiitto (6), Clemente Jacques (2), Blue Dragon (1), CJ Annie Chun's (1) | 16 |
| Meal and meal centers | Great Value (3), Bravisima (2), Blue Dragon (1), Productos Ahumados (2), Extra Special (1) | 16 |
| Snacks | Crazy Cuizine (1), Antonio y Ricardo (1) | 5 |
| Nutritional drinks and other beverages | Fresenius Kabi Supportan DKN (2), SimiBest D (2), Fresenius Kabi Fresekabi D (1) | 5 |
| Juice drinks | Clamato (1) | 2 |
| Savoury spreads | Herdez (2) | 2 |
| Soup | Fisher's (1) | 1 |
| Total sample size | 155 | |
| Source: Mintel, 2022 | ||
Product examples
New fish, seafood or drink brands launched recently (2021-2022) in the Mexican market include Pescanova (Hake Nuggets), Antiqua Delicatessen (Surimi in olive oil), Natural Good Shape (coconut water with fish collagen), and Meat Me (shrimp with cheese pastries).
Hake Nuggets

Source: Mintel, 2022
| Company | Pescanova |
|---|---|
| Importer | Tiendas Soriana |
| Brand | Pescanova |
| Sub-category | Processed fish, meat and egg products |
| Market | Mexico, imported from Spain |
| Related ingredients | Hake |
| Store name / type | Mega Soriana, merchandise / hypermarket |
| Launch type | New product |
| Date published | February 2022 |
| Price in US dollars | 3.75 |
The deep-frozen and crunchy product is free from lactose, gluten, preservatives, and colors, and contains omega 3, and excess amounts of sodium, according to the Secretariat of Health of Mexico. It retails in a 330 gram recyclable pack containing 11 to 13 pieces.
Salmon Snacks

Source: Mintel, 2022
| Company | Handy Seafood |
|---|---|
| Importer | Importadora Primex (for Costco) |
| Brand | Handy |
| Sub-category | Snacks, hors d'oeuvres / Canapes |
| Market | Mexico, imported from United States |
| Related ingredients | Red salmon, fish sauce (anchovy extract) |
| Store name / type | Costco, club store |
| Launch type | New product |
| Date published | December 2020 |
| Price in US dollars | 11.48 |
This product, according to the Mexican Ministry of Health, is high in sodium. It contains wild salmon, edamame, spinach, broccoli, chia seeds and chives and is free from artificial flavors, colors and preservatives. This snack contains 14 grams of protein per portion and other nutrients, including superfoods, and can be oven-baked, air-fried or pan-fried. This product retails in 340 gram pack containing 24 units.
Growing Up Dairy-Based Food Powder

Source: Mintel, 2022
| Company | Wal-Mart |
|---|---|
| Brand | Parent's Choice |
| Sub-category | Baby food, growing up milk (1 to 3 years) |
| Market | Manufactured in Mexico, not imported |
| Related ingredients | Fish oil (DHA), polyunsaturated fat (Omega 3) |
| Store name / type | Walmart, merchandise / hypermarket |
| Launch type | New product |
| Date published | July 2021 |
| Price in US dollars | 2.51 |
The product is fortified with vitamins and minerals, is free from added refined sugar, and contains DHA, prebiotics (inulin) and probiotics (bacterium probiotic). The product is suitable from children between one and three years of age, and retails in a 360 gram or an 800 gram pack.
Coconut Water with Collagen

Source: Mintel, 2022
| Company | Globa Distribuciones |
|---|---|
| Brand | Natural Good Shape |
| Sub-category | Juice drinks |
| Market | Manufactured in Mexico, not imported |
| Related ingredients | Hydrolyzed fish collagen |
| Store name / type | Chedraui Selecto, supermarket |
| Launch type | New product |
| Date published | May 2021 |
| Price in US dollars | 1.13 |
This pasteurized product is free from sugar, gluten and preservatives, contains antioxidants and minerals, and retails in a recyclable 330 millimetre pack.
Opportunities for Canada
Although, local fishing cooperatives (co-ops) are striving for access to competitive markets to selling directly to consumers, small fishing communities along Mexico's coast generally must rely on expensive middlemen to combine and market their catch - to meet the high-volume demand of large retailers. While some product is exported to international markets, the majority is sold to Mexican consumers and restaurants.Footnote 1
Niche opportunities, however, exist for premium products in higher-end restaurants and boutique hotels in major cities and tourist regions throughout Mexico for fresh and frozen fish and seafood such as lobster, mussels, cod, clams and other products: salmon, snow crab, blue fin tuna, etc.
Mexico is looking for innovative fish and seafood products with low prices, yet that are high in protein and nutritional content - to reach government strategic goals to boost consumption by one-third. Retailers have increased options of ready to consume frozen processed fish and seafood products and meal preparations including COSTCO, SAM's (Walmart de Mexico), among others. This product category has generated consumer interest associated to the pandemic and this trend may stay. There is opportunity for growth - in recognition of the need for cooperation amongst local stakeholders such as fish merchants, fishers and buyers - as Mexican initiatives looks to expand its consumer demand.
To better understand the differences between Mexican and Canadian business cultures, Canadian exporters should consider purchasing patterns, not only from a country basis, yet on a regional level as well. While some products might sell well in some regions, they may not be as popular in other areas. It is important for Canadian companies to work with local importers/distributors that are knowledgeable about Mexican trends, and whom can provide guidance on locating reputable business contacts, while also developing successful business relationships towards an appropriate strategy to enter the market. Local representatives can also assist with issues related to legal regulations, pricing, customs clearance, and provide other important technical/logistical sales support.Footnote 3
Some options for finding Mexican distributors include: participating in relevant trade shows (Expo ANTAD, Abastur, Expo Hotel), participating in trade missions aimed at the Mexican market, and contacting reliable sources of information such as Mexican industry associations or the Trade Commissioner Service in Mexico; which has three business development offices (Guadalajara, Mexico City and Monterrey).
For more information
The Canadian Trade Commissioner Service:
International Trade Commissioners can provide Canadian industry with on-the-ground expertise regarding market potential, current conditions and local business contacts, and are an excellent point of contact for export advice.
More agri-food market intelligence:
International agri-food market intelligence
Discover global agriculture and food opportunities, the complete library of Global Analysis reports, market trends and forecasts, and information on Canada's free trade agreements.
Agri-food market intelligence service
Canadian agri-food and seafood businesses can take advantage of a customized service of reports and analysis, and join our email subscription service to have the latest reports delivered directly to their inbox.
More on Canada's agriculture and agri-food sectors:
Canada's agriculture sectors
Information on the agriculture industry by sector. Data on international markets. Initiatives to support awareness of the industry in Canada. How the department engages with the industry.
Resources
- CATSNET, Statistics Canada, 2022
- Embassy of Canada, 2022. Canadian Trade Commissioner Service : Mexico
- Euromonitor Intelligence. January 2022. Country Report: Fish and Seafood in Mexico
- Global Trade Tracker, 2022.
- LaJornada, Mexico City. 2 May, 2022. La Nueva Viga concentrates 65% of the annual Mexican fishing : Sader (in Spanish only)
- Ministry of Agriculture and Rural Development (COMEPESCA). 15 April, 2019. The great fish and seafood markets of Mexico (in Spanish only)
- Muñoz Nuñez, Daylin. Walton Family Foundation. November 2021. Supporting Diverse Entrepreneurs: To Creat a Market for Sustainable Seafood in Mexico, Work "Smarter"
- National Aquaculture and Fisheries Commission (CONAPESCA). 1 April, 2021. Tuna, mojarra, dogfish, croaker, sea bass and shrimp among the most representative fishery and aquaculture products in national consumption (in Spanish only)
- OECD-FAO Agricultural Outlook 2021-2030
- OECD Review of Fisheries Country Notes . January 2021. Fisheries and Aquaculture in Mexico
Sector Trend Analysis – Fish and seafood trends in Mexico
Global Analysis Report
Prepared by: Erin-Ann Chauvin, Senior Market Analyst
© Her Majesty the Queen in Right of Canada, represented by the Minister of Agriculture and Agri-Food (2022).
Photo credits
All photographs reproduced in this publication are used by permission of the rights holders.
All images, unless otherwise noted, are copyright Her Majesty the Queen in Right of Canada.
To join our distribution list or to suggest additional report topics or markets, please contact:
Agriculture and Agri-Food Canada, Global Analysis1341 Baseline Rd, Tower 5, 3rd floor
Ottawa ON K1A 0C5
Canada
Email: aafc.mas-sam.aac@agr.gc.ca
The Government of Canada has prepared this report based on primary and secondary sources of information. Although every effort has been made to ensure that the information is accurate, Agriculture and Agri-Food Canada (AAFC) assumes no liability for any actions taken based on the information contained herein.
Reproduction or redistribution of this document, in whole or in part, must include acknowledgement of agriculture and agri-food Canada as the owner of the copyright in the document, through a reference citing AAFC, the title of the document and the year. Where the reproduction or redistribution includes data from this document, it must also include an acknowledgement of the specific data source(s), as noted in this document.
Agriculture and Agri-Food Canada provides this document and other report services to agriculture and food industry clients free of charge.