

Note: This report includes forecasting data that is based on baseline historical data.
Executive summary
Spain and Portugal are major fish and seafood consuming countries in the European Union (EU). In 2018, they were the second and third fish and seafood consumers in the EU, with per capita apparent consumption (PCAC) of 60.9 kilograms and 46.0 kilograms, respectively. Average PCAC in the EU is 24.4 kilograms (EUMOFA, 2020).
With imports of US$7.4 billion in 2020, Spain is the top fish and seafood importer in the EU and the fourth-largest market in the world. Portugal ranked 17th worldwide for imports of fish and seafood (US$2.2 billion in 2020). Both Spanish and Portuguese imports grew at a compound annual growth rate (CAGR) of 5.0% and 1.5% respectively from 2016 to 2020.
Since 2016, Canada has increased its fish and seafood exports to Spain. Canada was Spain's 36th largest supplier of fish and seafood in 2020. Spain imported US$43.1 million of fish and seafood from Canada in 2020, representing an increase of CAGR at 6.3% from US$33.8 million in 2016.
In 2020, Canada was Portugal's 55th largest supplier of fish and seafood. Portugal imported US$0.9 million of fish and seafood from Canada in 2020, down from US$4.2 million in 2016, representing a CAGR of −31.9%.
Spain's retail sales value of total fish and seafood grew from 2016 to 2020 at a CAGR of 0.3% and were valued at US$10.2 billion in 2020. They are expected to increase faster by 3.7% to US$12.1 billion by 2025. Portugal's retail sales value of total fish and seafood declined from 2016 to 2020 at a CAGR of 0.6%. Retail sales were valued at US$2.2 billion in 2020 and expected to increase by 3.5% to US$2.6 billion by 2025.
Introduction
Spain and Portugal are major fish and seafood consuming countries in the EU. In 2018, they were the second and third fish and seafood consumers in the EU, with per capita apparent consumption (PCAC) of 60.9 kilograms and 46.0 kilograms, respectively. Average PCAC in the EU is 24.4 kilograms (EUMOFA, 2020).
In 2019, consumption of processed fish and seafood through the foodservice through foodservice in the EU reached 734.800 tonnes, recorded the highest level in more than ten years. (EUMOFA, 2020). Spain and Portugal increased their out-of-home consumption of processed fish and seafood at a CAGR of 3.4% and 3.1%, respectively, from 2015 to 2019.
| Countries | 2015 | 2016 | 2017 | 2018 | 2019 | CAGR* % 2015-2019 |
|---|---|---|---|---|---|---|
| Spain | 116.8 | 120.2 | 124.8 | 129.5 | 133.6 | 3.4 |
| Portugal | 9.9 | 10.2 | 10.6 | 10.9 | 11.2 | 3.1 |
| EU total | 713.7 | 717.0 | 722.5 | 728.9 | 734.8 | 0.7 |
|
Source: EUMOFA, EU fish market - 2020 Edition *CAGR: Compound Annual Growth Rate |
||||||
Due to a much larger population, the total consumption of fish and seafood in Spain is much higher than in Portugal. In Spain, consumption of main fresh fish and seafood products consumed declined at a CAGR of −0.8%, from 666.1 thousand tonnes in 2016 to 645.6 thousand tonnes in 2020. In Portugal, consumption of main products increased at a CAGR of 7.0%, from 60.4 thousand tonnes in 2016 to 79.1 thousand tonnes in 2020.
| Products | 2016 | 2017 | 2018 | 2019 | 2020 | CAGR* % 2016-2020 |
|---|---|---|---|---|---|---|
| Total | 666.1 | 629.3 | 601.3 | 590.6 | 645.6 | −0.8 |
| Hake | 112.8 | 101.0 | 88.1 | 78.3 | 71.9 | −10.7 |
| Salmon | 41.3 | 45.0 | 47.7 | 53.1 | 67.9 | 13.2 |
| Sardine | 70.3 | 65.5 | 64.7 | 57.2 | 64.2 | −2.2 |
| Seabream, gilthead | 25.6 | 25.4 | 26.8 | 29.9 | 36.0 | 8.9 |
| Seabass, European | 24.4 | 21.2 | 24.0 | 27.4 | 33.9 | 8.5 |
| Sole, other | 29.4 | 27.8 | 27.2 | 27.7 | 27.5 | −1.7 |
| Cod | 27.1 | 29.7 | 29.8 | 25.0 | 26.9 | −0.2 |
| Tuna, miscellaneous | 21.4 | 18.7 | 16.2 | 16.9 | 17.3 | −5.1 |
| Mackerel | 18.9 | 14.3 | 15.3 | 13.8 | 14.4 | −6.7 |
| Monk | 12.8 | 12.5 | 10.8 | 10.4 | 12.2 | −1.2 |
| Others | 281.9 | 268.2 | 250.7 | 250.9 | 273.5 | −0.8 |
|
Source: EUMOFA database, 2021 *CAGR: Compound Annual Growth Rate |
||||||
| Products | 2016 | 2017 | 2018 | 2019 | 2020 | CAGR* % 2016-2020 |
|---|---|---|---|---|---|---|
| Total | 60.4 | 57.8 | 65.6 | 71.5 | 79.1 | 7.0 |
| Seabream, gilthead | 6.3 | 6.9 | 8.1 | 8.5 | 10.8 | 14.4 |
| Mackerel | 6.8 | 6.6 | 7.0 | 6.9 | 7.6 | 2.6 |
| Seabass, European | 3.7 | 3.3 | 4.5 | 5.6 | 6.3 | 13.9 |
| Hake | 5.5 | 5.3 | 6.0 | 5.9 | 5.8 | 1.1 |
| Salmon | 4.3 | 3.6 | 4.0 | 4.4 | 5.5 | 6.1 |
| Sardine | 3.1 | 3.1 | 3.8 | 4.3 | 4.8 | 11.6 |
| Shrimp, miscellaneous | 2.6 | 3.1 | 3.6 | 3.7 | 4.7 | 15.4 |
| Octopus | 3.0 | 2.5 | 2.4 | 3.3 | 3.7 | 5.7 |
| Clam | 2.0 | 2.1 | 2.1 | 2.2 | 2.6 | 6.3 |
| Scabbardfish | 1.9 | 1.6 | 1.6 | 2.3 | 2.5 | 7.4 |
| Others | 21.0 | 19.8 | 22.4 | 24.4 | 24.9 | 4.3 |
|
Source: EUMOFA database, 2021 *CAGR: Compound Annual Growth Rate |
||||||
Trade overview
With imports of US$7.4 billion in 2020, Spain is the top fish and seafood importer in the EU and the fourth-largest market in the world, after the United States (US$23.0 billion), China (US$15.3 billion) and Japan (US$13.6 billion). Portugal ranked 17th worldwide for imports of fish and seafood (US$2.2 billion in 2020). Both Spanish and Portuguese imports grew in value at a CAGR of 5.0% and 1.5% respectively from 2016 to 2020. In terms of volume, Spain and Portugal ranked 4th and 23rd, respectively, in the world.
| Country | 2016 | 2017 | 2018 | 2019 | 2020 | CAGR* % 2016-2020 | Market share % 2020 |
|---|---|---|---|---|---|---|---|
| World | 136.9 | 149.0 | 160.7 | 160.0 | 148.3 | 2.0 | 100.0 |
| United States | 20.8 | 23.0 | 24.0 | 23.5 | 23.0 | 2.5 | 15.5 |
| China | 9.1 | 11.1 | 14.7 | 18.4 | 15.3 | 13.7 | 10.3 |
| Japan | 14.3 | 15.4 | 15.8 | 15.6 | 13.6 | −1.3 | 9.2 |
| Spain | 7.2 | 8.1 | 8.7 | 8.2 | 7.4 | 0.6 | 5.0 |
| France | 6.4 | 6.9 | 7.2 | 6.8 | 6.5 | 0.5 | 4.4 |
| Italy | 6.2 | 6.6 | 7.1 | 6.7 | 6.1 | −0.5 | 4.1 |
| Germany | 5.8 | 5.9 | 6.2 | 6.0 | 6.0 | 1.2 | 4.1 |
| South Korea | 4.7 | 5.2 | 6.1 | 5.7 | 5.5 | 4.0 | 3.7 |
| Sweden | 5.2 | 5.0 | 5.6 | 5.3 | 5.1 | −0.6 | 3.4 |
| Netherlands | 3.8 | 4.3 | 4.5 | 4.5 | 4.6 | 4.9 | 3.1 |
| Canada (15th) | 2.9 | 3.0 | 3.1 | 3.3 | 3.0 | 0.8 | 2.0 |
| Portugal (17th) | 2.1 | 2.4 | 2.6 | 2.4 | 2.2 | 0.4 | 1.5 |
|
Source: Global Trade Tracker, 2021 *CAGR: Compound Annual Growth Rate |
|||||||
| Country | 2016 | 2017 | 2018 | 2019 | 2020 | CAGR* % 2016-2020 | Market share % 2020 |
|---|---|---|---|---|---|---|---|
| World | 35.7 | 36.5 | 308.2 | 38.4 | 36.9 | 0.8 | 100.0 |
| China | 4.0 | 4.9 | 5.2 | 6.3 | 5.7 | 8.9 | 15.4 |
| United States | 2.7 | 2.8 | 2.9 | 2.8 | 2.9 | 1.5 | 7.9 |
| Japan | 2.4 | 2.5 | 2.4 | 2.5 | 2.3 | −1.4 | 6.1 |
| Thailand | 1.9 | 1.9 | 2.1 | 2.0 | 2.1 | 3.7 | 5.8 |
| Spain | 1.7 | 1.8 | 1.8 | 1.8 | 1.7 | −0.1 | 4.6 |
| South Korea | 1.4 | 1.5 | 1.6 | 1.5 | 1.5 | 1.5 | 4.2 |
| France | 1.2 | 1.2 | 1.2 | 1.2 | 1.2 | 1.1 | 3.3 |
| Germany | 1.3 | 1.2 | 1.2 | 1.2 | 1.2 | −1.3 | 3.3 |
| Denmark | 1.4 | 1.3 | 1.3 | 1.2 | 1.2 | −3.8 | 3.2 |
| Netherlands | 1.0 | 1.1 | 1.1 | 1.1 | 1.1 | 2.3 | 3.0 |
| Canada (20th) | 0.5 | 0.5 | 0.5 | 0.5 | 0.5 | −0.8 | 1.4 |
| Portugal (23rd) | 0.5 | 0.5 | 0.5 | 0.5 | 0.5 | −2.0 | 1.3 |
|
Source: Global Trade Tracker, 2021 *CAGR: Compound Annual Growth Rate |
|||||||
Spain
Spain has a diverse network of suppliers of fish and seafood products, with imports coming primarily from Morocco, Ecuador, China, Portugal and Argentina. Morocco is Spain's largest supplier of fish and seafood, and the value of its supplies has been growing steadily. Other fast-growing suppliers are Sweden and Norway. Portugal was the fourth-largest supplier of fish and seafood to Spain.
Canada ranked 36thin terms of suppliers of fish and seafood to Spain in 2020. Canada's share of imports grew at a much faster rate than most of the top 10 suppliers since 2016, at a CAGR of 6.3%, but its market share remained small at 0.6% in 2020.
| Country | 2016 | 2017 | 2018 | 2019 | 2020 | CAGR* % 2016-2020 | Market share % 2020 |
|---|---|---|---|---|---|---|---|
| World | 7,192.8 | 8,093.7 | 8,679.8 | 8,151.8 | 7,357.2 | 0.6 | 100.0 |
| Morocco | 702.7 | 803.2 | 848.5 | 766.4 | 730.4 | 1.0 | 9.9 |
| Ecuador | 460.4 | 572.6 | 532.8 | 573.9 | 485.7 | 1.3 | 6.6 |
| China | 405.9 | 466.7 | 573.0 | 520.2 | 449.3 | 2.6 | 6.1 |
| Portugal | 400.9 | 463.4 | 501.2 | 456.8 | 381.6 | −1.2 | 5.2 |
| Argentina | 461.3 | 496.6 | 470.7 | 429.5 | 378.1 | −4.8 | 5.1 |
| France | 435.0 | 447.5 | 476.2 | 444.1 | 365.8 | −4.2 | 5.0 |
| Sweden | 135.5 | 254.2 | 285.2 | 255.1 | 258.2 | 17.5 | 3.5 |
| Netherlands | 263.7 | 274.9 | 248.4 | 235.2 | 256.6 | −0.7 | 3.5 |
| Norway | 201.8 | 196.9 | 177.7 | 224.3 | 243.7 | 4.8 | 3.3 |
| Namibia | 212.7 | 231.8 | 265.2 | 254.5 | 238.3 | 2.9 | 3.2 |
| Canada (36th) | 33.8 | 37.3 | 52.6 | 59.7 | 43.1 | 6.3 | 0.6 |
|
Source: Global Trade Tracker, 2021 *CAGR: Compound Annual Growth Rate |
|||||||
Spain's total fish and seafood imports grew from US$7.2 billion in 2016 to US$7.4 billion in 2020, a CAGR of 0.6%. The top commodities imported by Spain are frozen shrimp and prawns (US$1.0 billion), frozen cuttlefish and squid (US$1.0 billion), prepared/preserved tuna, skipjack and atlantic bonito (US$612.1 million), frozen octopus (US$384.4 million), and fresh/chilled salmon (US$326.2 million).
| HS code | Description | 2016 | 2017 | 2018 | 2019 | 2020 | CAGR* % 2016-2020 |
|---|---|---|---|---|---|---|---|
| Total | 7,192.8 | 8,093.7 | 8,679.8 | 8,151.8 | 7,357.2 | 0.6 | |
| 030617 | Frozen shrimps and prawns | 1,142.9 | 1,231.2 | 1,201.3 | 1,129.1 | 999.3 | −3.3 |
| 030743 | Frozen cuttle fish and squid, | 0.0 | 1,129.0 | 1,234.7 | 1,131.3 | 995.4 | N/C |
| 160414 | Prepared/preserved tunas, skipjack and atlantic bonito | 405.7 | 619.5 | 707.0 | 715.1 | 612.1 | 10.8 |
| 030752 | Frozen octopus | 0.0 | 575.1 | 769.3 | 510.0 | 384.4 | N/C |
| 030214 | Fresh/chilled atlantic salmon and danube salmon | 252.3 | 263.7 | 284.4 | 320.2 | 326.2 | 6.6 |
| 030474 | Frozen fillets of hake | 212.4 | 247.3 | 283.1 | 272.3 | 258.7 | 5.1 |
| 030342 | Frozen yellowfin tunas | 224.9 | 266.0 | 250.9 | 247.5 | 229.0 | 0.4 |
| 030471 | Frozen fillets of cod | 137.3 | 147.7 | 160.3 | 171.8 | 160.8 | 4.0 |
| 030289 | Fresh/chilled fish, not else specified | 153.0 | 158.0 | 160.2 | 160.6 | 146.2 | −1.1 |
| 030285 | Fresh/chilled sea bream | 107.3 | 104.1 | 101.3 | 112.0 | 141.1 | 7.1 |
|
Source: Global Trade Tracker, 2021 *CAGR: Compound Annual Growth Rate N/C: not calculable |
|||||||
Top five global suppliers of fish and seafood to Spain, by top three products, in US$ million, historical
| HS code | Description | 2016 | 2017 | 2018 | 2019 | 2020 | CAGR* % 2016-2020 |
|---|---|---|---|---|---|---|---|
| Total | 702.7 | 803.2 | 848.5 | 766.4 | 730.4 | 1.0 | |
| 030752 | Frozen octopus | 0.0 | 297.8 | 364.4 | 242.9 | 205.2 | N/C |
| 030743 | Frozen cuttle fish and squid | 0.0 | 187.6 | 155.0 | 173.4 | 179.7 | N/C |
| 160416 | Prepared/preserved anchovies | 55.6 | 56.5 | 65.3 | 65.6 | 58.9 | 1.5 |
|
Source: Global Trade Tracker, 2021 *CAGR: Compound Annual Growth Rate N/C: not calculable |
|||||||
| HS code | Description | 2016 | 2017 | 2018 | 2019 | 2020 | CAGR* % 2016-2020 |
|---|---|---|---|---|---|---|---|
| Total | 460.4 | 572.6 | 532.8 | 573.9 | 485.7 | 1.3 | |
| 030617 | Frozen shrimps and prawns | 231.7 | 251.1 | 226.0 | 224.3 | 249.3 | 1.8 |
| 160414 | Prepared/preserved tunas, skipjack and atlantic bonito | 191.7 | 287.3 | 256.9 | 295.0 | 201.6 | 1.3 |
| 030487 | Frozen fillets of tuna | 12.3 | 12.3 | 11.0 | 17.6 | 12.6 | 0.6 |
|
Source: Global Trade Tracker, 2021 *CAGR: Compound Annual Growth Rate |
|||||||
| HS code | Description | 2016 | 2017 | 2018 | 2019 | 2020 | CAGR* % 2016-2020 |
|---|---|---|---|---|---|---|---|
| Total | 405.9 | 466.7 | 573.0 | 520.2 | 449.3 | 2.6 | |
| 160414 | Prepared/preserved tunas, skipjack and atlantic bonito | 20.8 | 44.7 | 104.9 | 113.1 | 142.3 | 61.8 |
| 030617 | Frozen shrimps and prawns | 76.0 | 82.2 | 106.7 | 96.5 | 82.1 | 1.9 |
| 030743 | Frozen cuttle fish and squid | 0.0 | 164.7 | 181.8 | 124.3 | 82.0 | N/C |
|
Source: Global Trade Tracker, 2021 *CAGR: Compound Annual Growth Rate N/C: not calculable |
|||||||
| HS code | Description | 2016 | 2017 | 2018 | 2019 | 2020 | CAGR* % 2016-2020 |
|---|---|---|---|---|---|---|---|
| Total | 400.9 | 463.4 | 501.2 | 456.8 | 381.6 | −1.2 | |
| 030617 | Frozen shrimps and prawns | 31.3 | 44.4 | 52.2 | 38.8 | 35.3 | 3.1 |
| 030771 | Live/fresh/chilled clams | 25.1 | 23.8 | 22.2 | 26.0 | 25.9 | 0.8 |
| 030224 | Fresh/chilled turbot | 15.0 | 17.3 | 22.7 | 27.2 | 25.6 | 14.3 |
|
Source: Global Trade Tracker, 2021 *CAGR: Compound Annual Growth Rate |
|||||||
| HS code | Description | 2016 | 2017 | 2018 | 2019 | 2020 | CAGR* % 2016-2020 |
|---|---|---|---|---|---|---|---|
| Total | 461.3 | 496.6 | 470.7 | 429.5 | 378.1 | −4.9 | |
| 030617 | Frozen shrimps and prawns | 357.1 | 389.4 | 370.0 | 345.1 | 284.0 | −5.6 |
| 030743 | Frozen cuttle fish and squid | 0.0 | 51.5 | 53.5 | 34.3 | 46.6 | N/C |
| 030474 | Frozen fillets of hake | 41.1 | 37.9 | 29.3 | 33.9 | 34.0 | −4.7 |
|
Source: Global Trade Tracker, 2021 *CAGR: Compound Annual Growth Rate N/C: not calculable |
|||||||
Portugal
In Portugal, total imports of fish and seafood grew at a 0.5% CAGR from 2016 to 2020, reaching US$2.2 billion in value in 2020. Spain is by far Portugal's largest supplier, with a 40.7% market share in 2020. Sweden is the second-largest supplier of fish and seafood to Portugal, with a 13.0% share, followed by the Netherlands (8.5%), China (3.7%), and Denmark (3.3%). Portuguese imports from Canada declined at a CAGR of −31.9% from 2016 to 2020, and Canada's share of the market remains small at less than 0.5%.
| Country | 2016 | 2017 | 2018 | 2019 | 2020 | CAGR* % 2016-2020 | Market share % 2020 |
|---|---|---|---|---|---|---|---|
| World | 2,132.8 | 2,407.8 | 2,581.7 | 2,419.7 | 2,171.3 | 0.5 | 100.0 |
| Spain | 827.2 | 946.8 | 983.5 | 938.2 | 883.4 | 1.7 | 40.7 |
| Sweden | 251.8 | 245.3 | 273.8 | 282.4 | 283.2 | 3.0 | 13.0 |
| Netherlands | 201.9 | 216.7 | 199.3 | 188.0 | 184.6 | −2.2 | 8.5 |
| China | 82.3 | 110.1 | 112.3 | 104.3 | 80.6 | −0.5 | 3.7 |
| Denmark | 66.8 | 73.5 | 86.1 | 74.6 | 71.2 | 1.6 | 3.3 |
| Russia | 37.3 | 50.3 | 90.5 | 98.5 | 53.5 | 9.4 | 2.5 |
| India | 51.3 | 62.6 | 61.9 | 60.0 | 42.5 | −4.6 | 2.0 |
| Ecuador | 15.6 | 23.5 | 27.1 | 28.9 | 39.2 | 25.9 | 1.8 |
| Viet-Nam | 45.9 | 43.2 | 51.8 | 45.6 | 39.2 | −3.9 | 1.8 |
| South Africa | 30.8 | 37.2 | 41.8 | 40.7 | 35.7 | 3.8 | 1.6 |
| Canada (55th) | 4.2 | 4.1 | 3.2 | 2.4 | 0.9 | −31.9 | 0.04 |
|
Source: Global Trade Tracker, 2021 *CAGR: Compound Annual Growth Rate |
|||||||
Portugal's main global fish and seafood imports in 2020 were dried cod (US$233.9 million), frozen shrimp and prawns (US$179.7 million), frozen cod (US$142.7 million), salted cod (US$134.8 million), and prepared/preserved tunas (US$130.5 million).
| HS code | Description | 2016 | 2017 | 2018 | 2019 | 2020 | CAGR* % 2016-2020 |
|---|---|---|---|---|---|---|---|
| Total | 2,132.8 | 2,407.8 | 2,581.7 | 2,419.7 | 2,171.3 | 0.5 | |
| 030551 | Dried cod | 191.9 | 214.4 | 227.5 | 282.4 | 233.9 | 5.1 |
| 030617 | Frozen shrimps and prawns | 188.5 | 224.5 | 230.8 | 192.3 | 179.7 | −1.2 |
| 030363 | Frozen cod | 150.2 | 185.4 | 211.5 | 195.3 | 142.7 | −1.3 |
| 030562 | Salted cod | 148.8 | 135.0 | 157.5 | 134.6 | 134.8 | −2.4 |
| 160414 | Prepared/preserved tunas, skipjack and atlantic bonito | 90.9 | 116.9 | 120.6 | 111.5 | 130.5 | 9.4 |
| 030743 | Frozen cuttle fish and squid | 0.0 | 154.9 | 167.4 | 150.6 | 114.0 | N/C |
| 030752 | Frozen octopus | 0.0 | 159.0 | 201.8 | 128.1 | 99.0 | N/C |
| 030366 | Frozen hake | 68.3 | 69.5 | 74.8 | 76.0 | 81.3 | 4.4 |
| 030285 | Fresh/chilled sea bream | 67.2 | 80.2 | 82.6 | 74.3 | 76.6 | 3.3 |
| 030214 | Fresh/chilled atlantic salmon and danube salmon | 50.8 | 59.5 | 60.4 | 51.8 | 58.2 | 3.5 |
|
Source: Global Trade Tracker, 2021 *CAGR: Compound Annual Growth Rate N/C: not calculable |
|||||||
Top five global suppliers of fish and seafood to Portugal, by top three products, in US$ million, historical
| HS code | Description | 2016 | 2017 | 2018 | 2019 | 2020 | CAGR* % 2016-2020 |
|---|---|---|---|---|---|---|---|
| Total | 706.1 | 699.5 | 714.5 | 717.6 | 659.9 | −1.7 | |
| 160414 | Prepared/preserved tunas, skipjack and atlantic bonito | 60.7 | 69.1 | 72.5 | 69.5 | 78.6 | 6.7 |
| 030752 | Frozen octopus | 0.0 | 97.0 | 112.3 | 79.4 | 73.0 | N/C |
| 030617 | Frozen shrimps and prawns | 60.5 | 81.2 | 84.2 | 71.8 | 71.9 | 4.4 |
|
Source: Global Trade Tracker, 2021 *CAGR: Compound Annual Growth Rate N/C: not calculable |
|||||||
| HS code | Description | 2016 | 2017 | 2018 | 2019 | 2020 | CAGR* % 2016-2020 |
|---|---|---|---|---|---|---|---|
| Total | 251.8 | 245.3 | 273.8 | 282.4 | 283.2 | 3.0 | |
| 030551 | Dried cod | 120.2 | 121.5 | 125.1 | 183.9 | 177.9 | 10.3 |
| 030562 | Salted cod | 72.9 | 64.8 | 78.0 | 49.1 | 56.1 | −6.4 |
| 030214 | Fresh/chilled atlantic salmon and danube salmon | 25.8 | 25.1 | 23.5 | 19.2 | 25.9 | 0.2 |
|
Source: Global Trade Tracker, 2021 *CAGR: Compound Annual Growth Rate |
|||||||
| HS code | Description | 2016 | 2017 | 2018 | 2019 | 2020 | CAGR* % 2016-2020 |
|---|---|---|---|---|---|---|---|
| Total | 201.9 | 216.7 | 199.3 | 188.0 | 184.6 | −2.2 | |
| 030562 | Salted cod | 49.3 | 37.2 | 40.7 | 45.9 | 53.5 | 2.1 |
| 030551 | Fresh/chilled cod | 0.6 | 1.0 | 9.8 | 26.4 | 36.6 | 176.7 |
| 030363 | Frozen cod | 76.1 | 83.6 | 45.8 | 29.5 | 35.5 | −17.4 |
|
Source: Global Trade Tracker, 2021 *CAGR: Compound Annual Growth Rate |
|||||||
| HS code | Description | 2016 | 2017 | 2018 | 2019 | 2020 | CAGR* % 2016-2020 |
|---|---|---|---|---|---|---|---|
| Total | 82.3 | 110.1 | 112.3 | 104.3 | 80.6 | −0.5 | |
| 030559 | Dried fish, not else specified | 14.1 | 9.7 | 10.4 | 15.9 | 13.0 | −2.2 |
| 030743 | Frozen cuttle fish and squid | 0.0 | 39.2 | 32.3 | 16.7 | 11.1 | N/C |
| 160414 | Prepared/preserved tunas, skipjack and atlantic bonito | 1.1 | 0.3 | 4.5 | 4.9 | 10.3 | 76.7 |
|
Source: Global Trade Tracker, 2021 *CAGR: Compound Annual Growth Rate N/C: not calculable |
|||||||
| HS code | Description | 2016 | 2017 | 2018 | 2019 | 2020 | CAGR* % 2016-2020 |
|---|---|---|---|---|---|---|---|
| Total | 6.7 | 7.3 | 8.6 | 7.5 | 7.1 | 1.6 | |
| 030214 | Fresh/chilled atlantic salmon and danube salmon | 1.7 | 1.9 | 2.1 | 2.3 | 2.5 | 9.9 |
| 030562 | Salted cod | 0.7 | 0.6 | 0.9 | 1.3 | 0.9 | 8.9 |
| 030363 | Frozen cod | 1.0 | 0.9 | 1.4 | 0.9 | 0.7 | −8.8 |
|
Source: Global Trade Tracker, 2021 *CAGR: Compound Annual Growth Rate |
|||||||
Canada's performance
Since 2016, Canada has increased its fish and seafood exports to Spain. Canada was Spain's 36th largest supplier of fish and seafood in 2020. Spain imported US$43.1 million of fish and seafood from Canada in 2020, representing an increase of CAGR at 6.3% from US$33.8 million in 2016. Top fish and seafood imports from Canada were frozen lobsters (US$19.5 million), live/fresh/chilled lobsters (US$16.7 million), and salted cod (US$1.8 million) in 2020.
| HS code | Description | 2016 | 2017 | 2018 | 2019 | 2020 | CAGR* % 2016-2020 |
|---|---|---|---|---|---|---|---|
| Total | 33.8 | 37.3 | 52.6 | 59.7 | 43.1 | 6.3 | |
| 030612 | Frozen lobsters | 20.3 | 17.2 | 19.4 | 19.6 | 19.5 | −1.1 |
| 030632 | Live/fresh/chilled lobsters | 0.0 | 6.6 | 23.8 | 28.8 | 16.7 | N/C |
| 030562 | Salted cod | 1.1 | 3.9 | 4.2 | 3.1 | 1.8 | 14.3 |
|
Source: Global Trade Tracker, 2021 *CAGR: Compound Annual Growth Rate N/C: not calculable |
|||||||
In 2020, Canada was Portugal's 55th largest supplier of fish and seafood. Portugal imported US$0.9 million of fish and seafood from Canada in 2020, down from US$4.2 million in 2016, representing a CAGR of −31.9%. The top fish and seafood imports from Canada in 2020 were frozen flat fish (US$0.4 million), frozen fish (US$0.4 million) and frozen meat of fish of the families bregmacerotidae (US$69,359).
| HS code | Description | 2016 | 2017 | 2018 | 2019 | 2020 | CAGR* % 2016-2020 |
|---|---|---|---|---|---|---|---|
| Total | 4,174,122 | 4,142,261 | 3,240,924 | 2,396,009 | 900,066 | −31.9 | |
| 030339 | Frozen flat fish | 977,626 | 541,112 | 303,212 | 579,660 | 387,338 | −20.7 |
| 030389 | Frozen fish, not else specified | 208,568 | 0 | 159,315 | 227,194 | 384,571 | 16.5 |
| 030495 | Frozen meat of fish of the families bregmacerotidae | 0 | 6,867 | 120,253 | 232,284 | 69,359 | N/C |
|
Source: Global Trade Tracker, 2021 *CAGR: Compound Annual Growth Rate N/C: not calculable |
|||||||
Retail sales
Spain
During the national lockdown, foodservice outlets were limited to takeaway and delivery services, heavily restricting sales and thus leading to a decline in on-trade sales of fish and seafood in 2020. As such, the focus turned to retail sales in 2020, as producers and retailers renegotiated profits and margins as sales were channelled towards retail outlets serving Spanish consumers confined to home seclusion for much of 2020. During 2020, therefore, companies turned their attention to raising their brand awareness in retail as well as concentrating on expanding their offering in supermarkets and hypermarkets for 2020 and the coming years as well (Euromonitor international, 2021).
Spain's retail sales value of total fish and seafood grew from 2016 to 2020 at a CAGR of 0.3% and were valued at US$10.2 billion (1,314.2 thousand tonnes) in 2020. They are expected to increase faster by 3.7% to US$12.1 billion (1,498.5 thousand tonnes) by 2025. Retail sales in 2020 demonstrate that Spanish consumers show a preference for fresh and shelf stable fish and seafood. This preference is expected to continue in the forecast period.
| Category | 2016 | 2020 | CAGR* % 2016-2020 | 2021 | 2025 | CAGR* % 2021-2025 |
|---|---|---|---|---|---|---|
| Total fish and seafood | 10,132.1 | 10,246.2 | 0.3 | 10,450.4 | 12,091.3 | 3.7 |
| Fresh fish and seafood | 7,785.3 | 7,492.3 | −1.0 | 7,565.6 | 8,912.5 | 4.2 |
| Crustaceans | 1,484.4 | 1,446.7 | −0.6 | 1,454.7 | 1,629.4 | 2.9 |
| Fish | 4,609.8 | 4,397.5 | −1.2 | 4,453.8 | 5,331.5 | 4.6 |
| Molluscs and cephalopods | 1,691.1 | 1,648.1 | −0.6 | 1,657.1 | 1,951.6 | 4.2 |
| Processed seafood | 2,346.8 | 2,753.9 | 4.1 | 2,884.8 | 3,178.8 | 2.5 |
| Shelf stable seafood | 1,869.6 | 2,226.0 | 4.5 | 2,339.7 | 2,617.9 | 2.8 |
| Chilled processed seafood | 285.2 | 313.3 | 2.4 | 327.0 | 349.1 | 1.6 |
| Frozen processed seafood | 192.0 | 214.6 | 2.8 | 218.0 | 211.9 | −0.7 |
|
Source: Euromonitor international, 2021 *CAGR: Compound Annual Growth Rate |
||||||
| Category | 2016 | 2020 | CAGR* % 2016-2020 | 2021 | 2025 | CAGR* % 2021-2025 |
|---|---|---|---|---|---|---|
| Total fish and seafood | 1,567.0 | 1,314.2 | −4.3 | 1,375.2 | 1,498.5 | 2.2 |
| Fresh fish and seafood | 1,171.7 | 939.5 | −5.4 | 982.5 | 1,057.9 | 1.9 |
| Crustaceans | 164.8 | 138.8 | −4.2 | 145.5 | 148.4 | 0.5 |
| Fish | 751.4 | 593.3 | −5.7 | 620.6 | 675.9 | 2.2 |
| Molluscs and cephalopods | 255.6 | 207.3 | −5.1 | 216.4 | 233.6 | 1.9 |
| Processed seafood | 395.3 | 374.7 | −1.3 | 392.7 | 440.6 | 2.9 |
| Shelf stable seafood | 318.9 | 311.1 | −0.6 | 326.5 | 369.2 | 3.1 |
| Chilled processed seafood | 28.9 | 25.5 | −3.1 | 26.4 | 28.5 | 1.9 |
| Frozen processed seafood | 47.4 | 38.0 | −5.4 | 39.9 | 42.8 | 1.8 |
|
Source: Euromonitor international, 2021 *CAGR: Compound Annual Growth Rate |
||||||
Portugal
Portugal's retail sales value of total fish and seafood declined from 2016 to 2020at a CAGR of 0.6%. Retail sales were valued at US$2.2 billion (270.9 thousand tonnes) in 2020 and are expected to increase by 3.5% to US$2.6 billion (299.5 thousand tonnes) by 2025.
| Category | 2016 | 2020 | CAGR* % 2016-2020 | 2021 | 2025 | CAGR* % 2021-2025 |
|---|---|---|---|---|---|---|
| Total fish and seafood | 2,252.6 | 2,200.7 | −0.6 | 2,240.9 | 2,575.2 | 3.5 |
| Fresh fish and seafood | 1,955.1 | 1,852.8 | −1.3 | 1,865.9 | 2,142.0 | 3.5 |
| Crustaceans | 366.1 | 339.4 | −1.9 | 340.7 | 371.3 | 2.2 |
| Fish | 1,155.5 | 1,104.6 | −1.1 | 1,114.2 | 1,300.8 | 3.9 |
| Molluscs and cephalopods | 433.5 | 408.7 | −1.5 | 411.0 | 470.0 | 3.4 |
| Processed seafood | 297.5 | 347.9 | 4.0 | 375.0 | 433.2 | 3.7 |
| Shelf stable seafood | 196.0 | 228.1 | 3.9 | 245.0 | 281.5 | 3.5 |
| Chilled processed seafood | 58.4 | 68.4 | 4.0 | 73.7 | 83.9 | 3.3 |
| Frozen processed seafood | 43.1 | 51.4 | 4.5 | 56.4 | 67.7 | 4.7 |
|
Source: Euromonitor international, 2021 *CAGR: Compound Annual Growth Rate |
||||||
| Category | 2016 | 2020 | CAGR* % 2016-2020 | 2021 | 2025 | CAGR* % 2021-2025 |
|---|---|---|---|---|---|---|
| Total fish and seafood | 329.0 | 270.9 | −4.7 | 282.2 | 299.5 | 1.5 |
| Fresh fish and seafood | 290.3 | 233.0 | −5.3 | 242.7 | 254.7 | 1.2 |
| Crustaceans | 40.1 | 32.6 | −5.0 | 34.0 | 33.8 | −0.1 |
| Fish | 185.7 | 149.0 | −5.4 | 155.1 | 164.7 | 1.5 |
| Molluscs and cephalopods | 64.6 | 51.4 | −5.6 | 53.6 | 56.2 | 1.2 |
| Processed seafood | 38.7 | 37.9 | −0.5 | 39.5 | 44.8 | 3.2 |
| Shelf stable seafood | 28.7 | 28.0 | −0.6 | 29.1 | 33.0 | 3.2 |
| Chilled processed seafood | 5.6 | 5.1 | −2.3 | 5.5 | 6.4 | 3.9 |
| Frozen processed seafood | 4.5 | 4.8 | 1.6 | 4.9 | 5.4 | 2.5 |
|
Source: Euromonitor international, 2021 *CAGR: Compound Annual Growth Rate |
||||||
Competitive landscape
Spain
In 2020, the processed fish and seafood retail market in Spain was dominated by private labels and others (73.7%) as opposed to brand labels. Grupo Calvo, Bolton Group, Hijos de Carlos Albo, JEALSA Rianxeira and Frigorificos del Noroeste were the top five brands in 2020. Frigorificos del Noroeste saw the largest growth (9.3%) in retail sales, from US$49.4 million in 2016 to US$70.4 million in 2020.
Following the upheaval of the COVID-19 pandemic, many Spanish companies have developed e-commerce platforms, aiming to sell fish to consumers that would ordinarily have been sold directly to foodservice outlets. More players are expected to follow suit in the forecast period as more companies learn to adapt to the conditions of COVID-19. Companies in fish and seafood are, therefore, expected to become more innovative in terms of their business models and selling methods. (Euromonitor international, 2021)
| Company Name | 2016 | 2017 | 2018 | 2019 | 2020 | CAGR* % 2016-2020 | Market share % 2020 |
|---|---|---|---|---|---|---|---|
| Total | 2,346.8 | 2,414.4 | 2,590.7 | 2,534.5 | 2,753.9 | 4.1 | 100.0 |
| Private Label | 1,095.3 | 1,091.6 | 1,126.1 | 1,058.7 | 1,150.9 | 1.2 | 41.8 |
| Others | 658.9 | 699.5 | 791.4 | 815.8 | 879.2 | 7.5 | 31.9 |
| Grupo Calvo SA | 188.8 | 195.0 | 206.7 | 200.1 | 218.8 | 3.8 | 7.9 |
| Bolton Group, The | 179.5 | 188.2 | 202.5 | 198.8 | 216.6 | 4.8 | 7.9 |
| Hijos de Carlos Albo SA | 116.7 | 121.4 | 130.1 | 127.8 | 139.1 | 4.5 | 5.1 |
| JEALSA Rianxeira SA | 58.2 | 63.1 | 70.5 | 70.6 | 78.9 | 7.9 | 2.9 |
| Frigorificos del Noroeste SA (FRINSA) | 49.4 | 55.6 | 63.4 | 62.7 | 70.4 | 9.3 | 2.6 |
|
Source: Euromonitor international, 2021 *CAGR: Compound Annual Growth Rate |
|||||||
Portugal
In Portugal, the sector is also dominated by private labels and others (65.0% share in 2020). The number one player is Cofaco - Comercial e Fabril de Conservas. which accounted for 14.0% of the market in 2020.
COVID-19 pandemic has caused economic uncertainty and closure of the food service. In this context, Portuguese consumers are expected to increase their demand for more affordable seafood specie and frozen and processed fish. These consumer trends are likely to continue even after the pandemic (USDA, 2021)
| Company Name | 2016 | 2017 | 2018 | 2019 | 2020 | CAGR* % 2016-2020 | Market share % 2020 |
|---|---|---|---|---|---|---|---|
| Total | 297.5 | 311.5 | 334.9 | 326.6 | 347.9 | 4.0 | 100.0 |
| Private Label | 122.2 | 123.9 | 129.8 | 124.8 | 132.7 | 2.1 | 38.1 |
| Others | 75.0 | 81.7 | 89.5 | 87.8 | 93.6 | 5.7 | 26.9 |
| Cofaco - Comercial e Fabril de Conservas SA | 39.0 | 41.5 | 45.7 | 45.6 | 48.8 | 5.8 | 14.0 |
| Ramirez & Co Filhos SA | 24.0 | 25.4 | 28.0 | 27.4 | 29.3 | 5.1 | 8.4 |
| Coresa Conserveiros Reunidos SA | 13.3 | 14.1 | 15.2 | 14.7 | 15.6 | 4.1 | 4.5 |
| Vensy España SA | 12.8 | 13.1 | 14.0 | 13.6 | 14.3 | 2.8 | 4.1 |
| Fábricas Vasco da Gama - Indústria Transformadora | 11.2 | 11.8 | 12.7 | 12.7 | 13.6 | 5.0 | 3.9 |
|
Source: Euromonitor international, 2021 *CAGR: Compound Annual Growth Rate |
|||||||
Foodservice
Spain
The sales value of fish and seafood in Spain's foodservice industry experienced a 2.3% CAGR from US$2.2 billion in 2016 to US$2.4 billion in 2019. Before the COVID-19 pandemic, growth in sales value is forecast to increase, albeit at a lower rate of 1.6%, with sales expected to reach US$2.6 billion by 2023.
Demand for fish and seafood in Spain saw a sharp decline in 2020 as foodservice outlets around the country were closed during the national lockdown.
Restaurants are Spain's largest subsector with a sales value of fish and seafood of US$1.4 billion in 2019, up from US$1.3 billion in 2016, a CAGR of 2.3%. The restaurant subsector will continue to increase by 1.5% in the forecast period, with the sales value expected to reach US$1.5 billion by 2023. Accommodation channels were Spain's second-largest subsector, with a sales value of US$421.2 million in 2019, followed by pubs, clubs and bars (US$249.4 million), leisure channels (US$130.4 million) and retail outlets (US$107.6 million). All subsectors saw measurable growth in the 2016-2019 period and are expected to maintain these growth levels, at slightly lower rates, in the forecast period.
| Subsector | 2016 | 2019 | CAGR* % 2016-2019 | 2020 | 2023 | CAGR* % 2020-2023 |
|---|---|---|---|---|---|---|
| Total fish and seafood | 2,238.8 | 2,395.9 | 2.3 | 2,434.7 | 2,589.7 | 1.6 |
| Restaurant | 1,270.1 | 1,358.4 | 2.3 | 1,379.5 | 1,465.2 | 1.5 |
| Accommodation | 393.9 | 421.2 | 2.3 | 428.2 | 455.1 | 1.5 |
| Pub, club and bar | 233.0 | 249.4 | 2.3 | 253.9 | 271.4 | 1.7 |
| Leisure | 121.4 | 130.4 | 2.4 | 132.8 | 141.9 | 1.7 |
| Retail | 98.9 | 106.0 | 2.3 | 107.6 | 114.4 | 1.5 |
| Workplace | 74.9 | 80.7 | 2.5 | 82.2 | 88.1 | 1.7 |
| Travel | 45.1 | 48.3 | 2.3 | 49.0 | 52.1 | 1.5 |
| Mobile operator | 1.5 | 1.6 | 0.6 | 1.6 | 1.6 | 0.9 |
|
Source: Global Data, Foodservice, 2020 *CAGR: Compound Annual Growth Rate |
||||||
Portugal
Sales value of fish and seafood in Portugal's foodservice industry had a 2.0% CAGR from US$697.5 million in 2016 to US$739.5 million in 2019. Before COVID-19, growth in sales value is forecast to increase, albeit at the lower rate of 1.3%, as sales are expected to attain US$781.0 million by 2023.
Due to sanitary restrictions, fish and seafood sales in food service sectors are estimated to decline by 40% during the spring lockdown in 2020 (USDA, 2021).
The accommodation subsector is Portugal's largest subsector with a sales value of fish and seafood of US$548.6 million in 2019 and a CAGR of 2.0% from a sales value of US$516.3 million in 2016. The accommodation subsector will continue to increase by 1.3% in the forecast period, with the sales value expected to reach US$580.5 billion by 2023. Leisure channels were Portugal's second-largest subsector with a sales value of US$66.2 million in 2019, followed by mobile operators (US$44.1 million), pubs, clubs and bars (US$23.9 million) and restaurants (US$22.4 million). All subsectors reached measurable growth in the 2016 to 2019 period and are expected to maintain these growth levels, at slightly lower rates, in the forecast period.
| Subsector | 2016 | 2019 | CAGR* % 2016-2019 | 2020 | 2023 | CAGR* % 2020-2023 |
|---|---|---|---|---|---|---|
| Total fish and seafood | 697.5 | 739.5 | 2.0 | 751.5 | 781.0 | 1.3 |
| Accommodation | 516.3 | 548.6 | 2.0 | 557.9 | 580.5 | 1.3 |
| Leisure | 62.8 | 66.2 | 1.8 | 67.2 | 69.6 | 1.2 |
| Mobile operators | 41.9 | 44.1 | 1.7 | 44.8 | 46.3 | 1.1 |
| Pubs, clubs and bars | 22.6 | 23.9 | 1.9 | 24.3 | 25.2 | 1.2 |
| Restaurants | 21.2 | 22.4 | 1.8 | 22.8 | 23.6 | 1.2 |
| Retail | 19.6 | 20.6 | 1.6 | 20.9 | 21.6 | 1.1 |
| Travel | 11.3 | 11.9 | 1.6 | 12.0 | 12.4 | 1.1 |
| Workplace | 1.7 | 1.8 | 2.0 | 1.8 | 1.9 | 1.3 |
|
Source: Global Data, Foodservice, 2020 *CAGR: Compound Annual Growth Rate |
||||||
New product launch analysis
Spain
According to Mintel's Global New Products Database (GNPD), there were 1,907 launches of fish and fish products (as an ingredient) in Spain between January 2016 and December 2020. In 2020, the top categories of food products offered were processed fish, meat and egg products, meals and meal centres, and snacks. The top claims (may contain more than one claim per package) were low/no/reduced allergen, gluten-free and microwaveable. The top five brands were Hacendado, Carrefour, Deluxe, Pescanova and Ifa Eliges. The top ingredients identified were fish and fish products, shellfish, tuna, prawn and cod.
| Product attributes | Yearly launch count | ||||
|---|---|---|---|---|---|
| 2016 | 2017 | 2018 | 2019 | 2020 | |
| Yearly product launches | 492 | 398 | 369 | 280 | 368 |
| Top five ingredients | |||||
| Processed fish, meat and egg products | 251 | 212 | 198 | 151 | 236 |
| Meals and meal centers | 107 | 90 | 75 | 47 | 43 |
| Snacks | 40 | 17 | 30 | 19 | 22 |
| Sauces and seasonings | 31 | 20 | 17 | 20 | 20 |
| Savoury spreads | 24 | 16 | 14 | 16 | 13 |
| Top five claims | |||||
| Low/no/reduced allergen | 104 | 93 | 108 | 48 | 71 |
| Gluten free | 100 | 89 | 104 | 47 |
66 |
| Microwaveable | 81 | 67 | 52 | 48 | 52 |
| Ease of use | 69 | 46 | 62 | 41 | 69 |
| Ethical - environmentally friendly package | 31 | 41 | 56 | 65 | 80 |
| Imported status | |||||
| Not imported | 71 | 63 | 61 | 51 | 38 |
| Imported | 51 | 47 | 37 | 37 | 38 |
| Top five brands | |||||
| Hacendado | 13 | 8 | 13 | 37 | 21 |
| Carrefour | 27 | 17 | 11 | 11 | 14 |
| Deluxe | 19 | 20 | 6 | 5 | 7 |
| Pescanova | 6 | 4 | 6 | 4 | 11 |
| Ifa Eliges | 10 | 17 | 1 | 0 | 1 |
| Top five launch types | |||||
| New variety/range extension | 280 | 232 | 170 | 142 | 155 |
| New product | 131 | 69 | 126 | 72 | 108 |
| New packaging | 59 | 65 | 45 | 52 | 76 |
| Relaunch | 18 | 28 | 24 | 14 | 20 |
| New variety/range extension | 280 | 232 | 170 | 142 | 155 |
| Top five flavours (including blend) | |||||
| Unflavoured/plain | 164 | 141 | 142 | 93 | 175 |
| Smoke | 14 | 10 | 8 | 8 | 17 |
| Tuna | 18 | 9 | 13 | 9 | 7 |
| Seafood | 16 | 15 | 9 | 5 | 4 |
| Prawn/shrimp | 12 | 7 | 12 | 2 | 5 |
| Top five ingredients | |||||
| Fish and fish products | 71 | 53 | 73 | 37 | 65 |
| Shellfish | 42 | 42 | 43 | 28 | 55 |
| Tuna | 54 | 39 | 36 | 27 | 29 |
| Prawn | 34 | 61 | 29 | 18 | 22 |
| Cod | 35 | 31 | 28 | 20 | 17 |
| Source: Mintel, 2021 | |||||
Portugal
According to Mintel's GNPD, there were 147 fish and fish products (as an ingredient) launched as food products in Portugal between January 2016 and December 2020. In 2020, the top categories of food products offered were processed fish, meat and egg products, meals and meal centres, and savoury spreads. The top claims (may contain more than one claim per package) were environmentally friendly products and sustainable (habitat/resources) and no additives/preservatives. Top brands were Bom Petisco, A Peixaria de La Piara, and Sal de Plata. The top ingredients identified were tuna, sardine, fish and fish products, shrimp, and mackerel.
| Product attributes | Yearly launch counts | ||||
|---|---|---|---|---|---|
| 2016 | 2017 | 2018 | 2019 | 2020 | |
| Yearly product launches | 26 | 17 | 23 | 33 | 48 |
| Top five categories | |||||
| Processed fish, meat and egg products | 22 | 6 | 16 | 15 | 33 |
| Meals and meal centers | 0 | 4 | 4 | 7 | 5 |
| Savoury spreads | 1 | 4 | 0 | 5 | 6 |
| Sauces and seasonings | 3 | 0 | 0 | 5 | 1 |
| Side dishes | 0 | 1 | 1 | 0 | 2 |
| Top five claims | |||||
| Ethical - animal | 4 | 5 | 5 | 3 | 14 |
| No additives/preservatives | 0 | 1 | 7 | 4 | 7 |
| Free from added/artificial colourings | 0 | 1 | 6 | 4 | 7 |
| Free from added/artificial preservatives | 0 | 1 | 7 | 3 | 7 |
| Ethical - sustainable (habitat/resources) | 1 | 0 | 7 | 7 | 1 |
| Imported status | |||||
| Not imported | 12 | 5 | 6 | 9 | 14 |
| Imported | 3 | 2 | 5 | 6 | 9 |
| Top five brands | |||||
| Continente | 3 | 0 | 1 | 0 | 12 |
| Bom Petisco | 0 | 0 | 0 | 4 | 3 |
| Alva | 0 | 0 | 5 | 0 | 0 |
| Bom Petisco Sabores | 3 | 0 | 0 | 1 | 0 |
| A Peixaria de La Piara | 0 | 0 | 0 | 4 | 0 |
| Top launch types | |||||
| New product | 12 | 14 | 4 | 23 | 19 |
| New variety/range extension | 11 | 2 | 17 | 8 | 20 |
| New packaging | 3 | 0 | 1 | 1 | 7 |
| Relaunch | 0 | 1 | 1 | 1 | 2 |
| Top five flavours (including blend) | |||||
| Unflavoured/plain | 8 | 2 | 15 | 10 | 19 |
| Tomato | 2 | 2 | 1 | 0 | 5 |
| Tuna | 1 | 0 | 2 | 1 | 5 |
| Spice/spicy | 3 | 0 | 1 | 0 | 2 |
| Seafood | 0 | 2 | 0 | 3 | 0 |
| Top five ingredients | |||||
| Tuna | 6 | 7 | 6 | 9 | 21 |
| Sardine | 6 | 0 | 4 | 7 | 8 |
| Shrimp | 1 | 3 | 2 | 3 | 3 |
| Fish and fish products | 0 | 3 | 1 | 5 | 1 |
| Shellfish | 0 | 1 | 1 | 4 | 2 |
| Source: Mintel, 2021 | |||||
Examples of new product launches
Scottish Tradition Smoked Salmon Belly Centre

Source: Mintel, 2021
| Company | La Balinesa |
|---|---|
| Brand | La Balinesa |
| Category | Processed fish, meat and egg products |
| Market | Spain |
| Store name | El Corte Inglés |
| Store type | Department store |
| Date published | August 2021 |
| Launch type | New variety / range extension |
| Price in local currency | €17.85 |
| Price in US dollars | 21.18 |
La Balinesa Centro de Ventresca de Salmón Ahumado Tradición Escocesa (Scottish Tradition Smoked Salmon Belly Centre) is now available in the range. This traditional product is said to be rich in proteins and omega 3, is free from added sugars and retails in a 125-gram recyclable pack featuring a recipe suggestion.
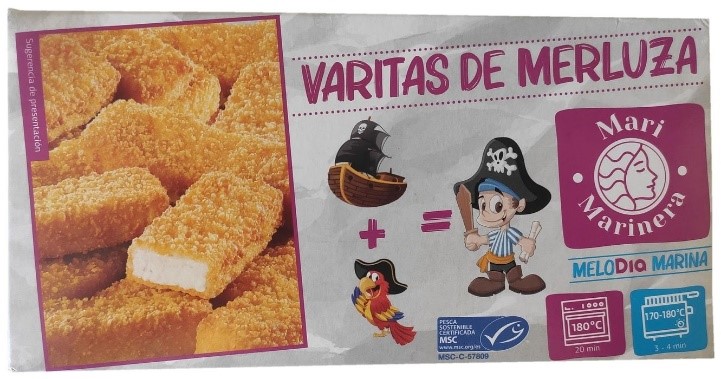
Breaded Hake Fingers
Source: Mintel, 2021
| Company | Dia |
|---|---|
| Brand | Mari Marinera |
| Category | Processed fish, meat and egg products |
| Market | Spain |
| Store name | Dia |
| Store type | Supermarket |
| Date published | August 2021 |
| Launch type | New variety / range extension |
| Price in local currency | €1.39 |
| Price in US dollars | 1.65 |
Mari Marinera Varitas de Merluza (Breaded Hake Fingers) are new to the range. The product is deep frozen and can be fried for three to four minutes or prepared in an oven during 20 minutes. It retails in a 300-gram pack, featuring the MSC (Marine Stewardship Council) - Certified Sustainable Seafood, and cooking instructions.
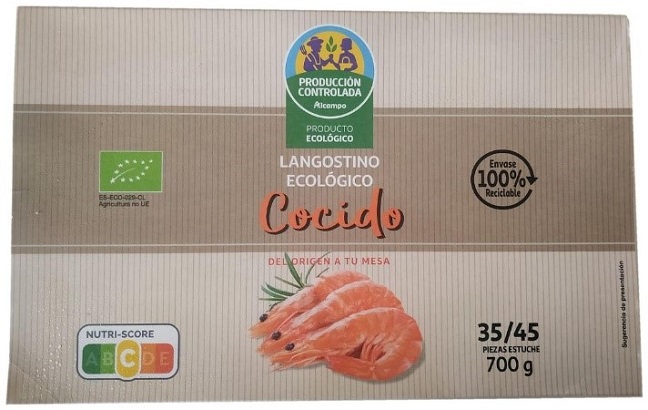
Organic Cooked Prawns
Source: Mintel, 2021
| Company | Alcampo |
|---|---|
| Brand | Alcampo Producción Controlada |
| Category | Processed fish, meat and egg products |
| Market | Spain |
| Store name | Alcampo |
| Store type | Mass merchandise / hypermarket |
| Date published | May 2021 |
| Launch type | New product |
| Price in local currency | €7.99 |
| Price in US dollars | 9.58 |
Alcampo Producción Controlada Langostino Ecológico Cocido (Organic Cooked Prawns) are now available. These organic prawns are characterised by a system of low density production under careful harvesting and handling practices of organic farming and with the maximum respect for the animal's wellbeing. They have been made without the use of artificial pesticides and fertilizers, have been 100% organically fed and responsibly selected. They have been deep-frozen, feature a Nutri-Score of "C" on an A to E scale and retails in a 100% recyclable and FSC certified 700-gram pack containing 35-45 units and featuring the EU Organic logo.
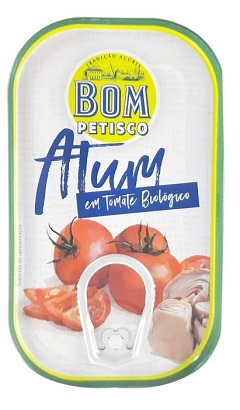
Tuna in Organic Tomato
Source: Mintel, 2021
| Company | Cofaco Açores |
|---|---|
| Brand | Bom Petisco |
| Category | Processed fish, meat and egg products |
| Market | Portugal |
| Store name | Continente |
| Store type | Mass merchandise / hypermarket |
| Date published | October 2020 |
| Launch type | New variety / range extension |
| Price in local currency | €1.99 |
| Price in US dollars | 2.32 |
Bom Petisco Atum em Tomate Biológico (Tuna in Organic Tomato) comprises solid tuna in organic tomato sauce. The product is a source of omega-3 fatty acids and retails in a 120-gram pack featuring the Dolphin Safe logo.
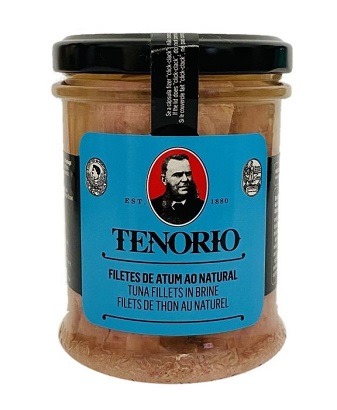
Tuna Fillets in Brine
Source: Mintel, 2021
| Company | Cofaco Açores |
|---|---|
| Brand | Tenorio |
| Category | Processed fish, meat and egg products |
| Market | Portugal |
| Store name | Auchan |
| Store type | Mass merchandise / hypermarket |
| Date published | May 2021 |
| Launch type | New packaging |
| Price in local currency | €3.99 |
| Price in US dollars | 4.85 |
Tenorio Filetes de Atum ao Natural (Tuna Fillets in Brine) have been repackaged with an updated design. The product retails in a 200-gram pack bearing the Dolphin Safe logo.
Frozen Big Prawns
Source: Mintel, 2021
| Company | Modelo Continente Hipermercados (MCH) |
|---|---|
| Brand | Continente |
| Category | Processed fish, meat and egg products |
| Market | Portugal |
| Store name | Continente |
| Store type | Mass merchandise / hypermarket |
| Date published | May 2020 |
| Launch type | New variety / range extension |
| Price in local currency | €5.49 |
| Price in US dollars | 6.05 |
Continente Miolo de Gambão Congelado (Frozen Big Prawns) are now available. The product retails in a 200-gram pack containing 20 to 30 units.
Opportunities for Canada
The Comprehensive Economic and Trade Agreement (CETA)
With CETA, 98% of EU tariff lines are now duty-free for Canadian goods, and an additional 1% will be eliminated over seven years. Tariff elimination provides enhanced export opportunities into the EU market for Canadian producers, processors, and manufacturers, as well as for agricultural and agri-food products, fish and seafood, forestry goods, and the full range of industrial goods.
How does CETA benefit Canadian fish and seafood exporters? (Global Affairs Canada, 2020)
- Under CETA, almost 96% of EU tariff lines for fish and seafood products have become duty-free. 100% of these tariff lines will be duty-free after seven years.
- Before the CETA, EU tariffs for fish and seafood averaged 11% and could be as high as 25%.
For more information, please visit Opportunities and Benefits of CETA for Canada's Fish and Seafood Exporters.
Consult the Canada Tariff Finder to explore tariff information for the CPTPP market, and other countries with which Canada has a free trade agreement.
Conclusion
Spain and Portugal are among the largest consumers of fish and seafood in the world, and they import a significant proportion of what they consume. Spanish imports from Canada have increased significantly since 2015 at a CAGR of 22.6%, while Portuguese imports from Canada have decreased since 2015 at a CAGR of −0.9%. There is still room for growth, especially with the elimination of tariffs under the CETA.
For more information
The Canadian Trade Commissioner Service:
International Trade Commissioners can provide Canadian industry with on-the-ground expertise regarding market potential, current conditions and local business contacts, and are an excellent point of contact for export advice.
More agri-food market intelligence:
International agri-food market intelligence
Discover global agriculture and food opportunities, the complete library of Global Analysis reports, market trends and forecasts, and information on Canada's free trade agreements.
Agri-food market intelligence service
Canadian agri-food and seafood businesses can take advantage of a customized service of reports and analysis, and join our email subscription service to have the latest reports delivered directly to their inbox.
More on Canada's agriculture and agri-food sectors:
Canada's agriculture sectors
Information on the agriculture industry by sector. Data on international markets. Initiatives to support awareness of the industry in Canada. How the department engages with the industry.
For additional information on Seafood Expo Global/Seafood Processing Global and Anuga 2021, please contact:
Ben Berry, Deputy Director
Trade Show Strategy and Delivery
Agriculture and agri-food Canada
ben.berry@agr.gc.ca
Resources
- Euromonitor International, 2021
- Euromonitor International, 2021, Fish and Seafood in Spain
- EUMOFA, 2020, The EU fish market – 2020 Edition. The European Market Observatory for fisheries and aquaculture.
- Global Affairs Canada, 2020, Opportunities and Benefits of CETA for Canada's Fish and Seafood Exporters.
- Global Trade Tracker, 2021
- GlobalData, 2020
- Mintel Global New Products Database, 2021
- United States Department of Agriculture, 2021, Portugal: The Portuguese Seafood Sector
Sector Trend Analysis – Fish and seafood trends in Spain and Portugal
Global Analysis Report
Prepared by: Zhiduo Wang, Market Analyst
© Her Majesty the Queen in Right of Canada, represented by the Minister of Agriculture and Agri-Food (2022).
Photo credits
All photographs reproduced in this publication are used by permission of the rights holders.
All images, unless otherwise noted, are copyright Her Majesty the Queen in Right of Canada.
To join our distribution list or to suggest additional report topics or markets, please contact:
Agriculture and Agri-Food Canada, Global Analysis1341 Baseline Rd, Tower 5, 3rd floor
Ottawa ON K1A 0C5
Canada
Email: aafc.mas-sam.aac@agr.gc.ca
The Government of Canada has prepared this report based on primary and secondary sources of information. Although every effort has been made to ensure that the information is accurate, Agriculture and Agri-Food Canada (AAFC) assumes no liability for any actions taken based on the information contained herein.
Reproduction or redistribution of this document, in whole or in part, must include acknowledgement of agriculture and agri-food Canada as the owner of the copyright in the document, through a reference citing AAFC, the title of the document and the year. Where the reproduction or redistribution includes data from this document, it must also include an acknowledgement of the specific data source(s), as noted in this document.
Agriculture and Agri-Food Canada provides this document and other report services to agriculture and food industry clients free of charge.