

Note: This report includes forecasting data that is based on baseline historical data.
Executive summary
In 2021, Sweden was the ninth largest market (3.3% market value share) for fish and seafood in the world with imports valued at US$5.5 billion (845.7 million kilograms). Sweden experienced a Compound Annual Growth Rate (CAGR) of 2.9% as imports increased from US$5.0 billion (733.2 million kilograms) in 2017 (9.4% from US$5.1 billion in 2020).
Sweden's supply network of fish and seafood products is mainly reliant on its European neighbors, with Norway being its most significant trading partner. In 2021, the top three suppliers of fish and seafood to Sweden were Norway, representing a 88.3% market share (US$ 4.9 billion, 748.8 million kilograms), Denmark, representing a 3.7% market share (US$ 206.8 million, 37.3 million kilograms) and Poland, representing a 1.4% market share (US$ 79.0 million and 8.2 million kilograms).
Top imported fish and seafood products to Germany were Atlantic or Danube salmon, fresh or chilled, valued at US$ 3.4 billion, (503.6 million kilograms) in 2021, followed by fresh or chilled fillets of Pacific, Atlantic, and Danube salmon, valued at US$ 460.7 million (47.1 million kilograms), and frozen fillets of Pacific, Atlantic and Danube salmon, valued at US$258.2 million (22.8 million kilograms).
Canada was Sweden's twelfth largest supplier of fish and seafood products, representing a 0.2% market value share, providing US$ 13.4 million and 0.8 million kilograms in 2021. This represented a −4.8% decrease in growth rate for fish and seafood imports from US$ 16.3 million registered in 2017. Top imports from Canada in 2021 include frozen lobsters, whether in shell or not, cooked by steaming or by boiling in water (HS: 030612), valued at US$ 4.4 million (0.2 million kilograms), followed by prepared or preserved shrimps or prawns not in airtight containers (excluding smoked) (HS: 160521), valued at US$ 2.0 million (0.2 million kilograms) and Lobsters, live, fresh or chilled, whether in shell or not (HS: 030632), valued at US$ 1.8 million (0.1 million kilograms).
Retail sales of fish products experienced the greatest historical growth between 2017 to 2021, from US$ 2.1 billion in 2017 to US$ 2.6 billion in 2021 (24.9% increase), represented by a CAGR of 5.7%, and is expected to grow to US$ 3.3 billion (28.0% increase from 2021) by 2026, with an expected CAGR of 5.2% from 2022 to 2026.
Trade overview
In 2021, Sweden was the ninth largest market (3.3% market value share) for fish and seafood in the world with imports valued at US$5.5 billion (845.7 million kilograms). Sweden experienced a CAGR of 2.9% as imports increased from US$5.0 billion (733.2 million kilograms) in 2017 (9.4% from US$5.1 billion in 2020).
Canada was the fourteenth largest market in fish and seafood, accounting for 2.2% of the total world market share (representing US$3.7 billion and 582.0 million kilograms) in 2021.
| Country | 2017 | 2018 | 2019 | 2020 | 2021 | CAGR* % 2017-2021 | Market share 2021% |
|---|---|---|---|---|---|---|---|
| World total | 146,837.2 | 158,786.3 | 158,853.2 | 148,684.7 | 167,646.9 | 3.4 | 100.0 |
| United States | 22,967.0 | 23,988.6 | 23,519.6 | 22,976.8 | 30,176.4 | 7.1 | 18.0 |
| China | 11,110.5 | 14,745.2 | 18,413.6 | 15,267.6 | 17,760.3 | 12.4 | 10.6 |
| Japan | 15,437.9 | 15,779.8 | 15,564.6 | 13,569.6 | 14,324.7 | −1.9 | 8.5 |
| Spain | 8,093.7 | 8,679.8 | 8,151.8 | 7,357.2 | 8,895.6 | 2.4 | 5.3 |
| France | 6,905.8 | 7,155.0 | 6,811.3 | 6,491.8 | 7,872.9 | 3.3 | 4.7 |
| Italy | 6,621.6 | 7,113.8 | 6,731.0 | 6,151.6 | 7,541.9 | 3.3 | 4.5 |
| South Korea | 5,210.7 | 6,060.3 | 5,717.6 | 5,537.8 | 6,039.6 | 3.8 | 3.6 |
| Germany | 5,905.6 | 6,172.2 | 5,984.1 | 6,078.4 | 5,919.7 | 0.1 | 3.5 |
| Sweden (9) | 4,952.3 | 5,630.1 | 5,269.9 | 5,071.8 | 5,546.7 | 2.9 | 3.3 |
| Netherlands | 4,309.1 | 4,540.5 | 4,521.2 | 4,610.6 | 4,954.2 | 3.6 | 3.0 |
| Canada (14) | 3,019.4 | 3,085.1 | 3,256.5 | 2,979.9 | 3,698.2 | 5.2 | 2.2 |
|
Source: Global Trade Tracker, 2022 *CAGR: Compound Annual Growth Rate |
|||||||
| Country | 2017 | 2018 | 2019 | 2020 | 2021 | CAGR* % 2017-2021 | Market share 2021% |
|---|---|---|---|---|---|---|---|
| World total | 37,116.4 | 308,850.2 | 39,093.7 | 37,908.8 | 37,503.4 | 0.3 | 100.0 |
| China | 4,889.7 | 5,214.9 | 6,256.8 | 5,667.2 | 5,744.6 | 4.1 | 15.3 |
| United States | 2,820.2 | 2,901.3 | 2,825.7 | 2,907.4 | 3,267.5 | 3.7 | 8.7 |
| Japan | 2,476.6 | 2,380.7 | 2,464.4 | 2,251.3 | 2,199.6 | −2.9 | 5.9 |
| Thailand | 1,902.2 | 2,126.5 | 2,047.6 | 2,149.3 | 2,102.5 | 2.5 | 5.6 |
| Spain | 1,775.7 | 1,768.4 | 1,820.8 | 1,713.7 | 1,815.1 | 0.6 | 4.8 |
| Korea | 1,481.4 | 1,558.4 | 1,531.4 | 1,536.6 | 1,652.7 | 2.8 | 4.4 |
| France | 1,200.2 | 1,212.9 | 1,227.7 | 1,222.6 | 1,347.2 | 2.9 | 3.6 |
| Denmark | 1,251.0 | 1,293.5 | 1,245.6 | 1,183.7 | 1,244.7 | −0.1 | 3.3 |
| Italy | 1,103.8 | 1,133.7 | 1,145.0 | 1,046.8 | 1,152.0 | 1.1 | 3.1 |
| Germany | 1,185.8 | 1,203.8 | 1,172.9 | 1,216.1 | 1,127.1 | −1.3 | 3.0 |
| Sweden (12) | 733.2 | 815.9 | 818.5 | 860.7 | 845.7 | 3.6 | 2.3 |
| Canada (18) | 536.4 | 523.0 | 544.3 | 520.4 | 582.0 | 2.1 | 1.6 |
|
Source: Global Trade Tracker, 2022 *CAGR: Compound Annual Growth Rate |
|||||||
Sweden's supply network of fish and seafood products is mainly reliant on its European neighbors, with Norway being its most significant trading partner. In 2021, the top three suppliers of fish and seafood to Sweden were Norway, representing a 88.3% market share (US$4.9 billion, 748.8 million kilograms), Denmark, representing a 3.7% market share (US$206.8 million, 37.3 million kilograms) and Poland, representing a 1.4% market share (US$79.0 million and 8.2 million kilograms). Canada was Sweden's twelfth largest supplier of fish and seafood products, representing a 0.2% market value share, providing US$13.4 million and 0.8 million kilograms in 2021.
| Country | 2017 | 2018 | 2019 | 2020 | 2021 | CAGR* % 2017-2021 | Market share 2021% |
|---|---|---|---|---|---|---|---|
| World total | 4,952.3 | 5,630.1 | 5,269.9 | 5,071.8 | 5,546.7 | 2.9 | 100.0 |
| Norway | 4,273.2 | 4,879.3 | 4,598.7 | 4,443.6 | 4,899.9 | 3.5 | 88.3 |
| Denmark | 236.8 | 267.4 | 231.1 | 193.9 | 206.8 | −3.3 | 3.7 |
| Poland | 36.7 | 75.5 | 60.4 | 67.8 | 79.0 | 21.2 | 1.4 |
| Netherlands | 46.5 | 49.0 | 46.9 | 41.4 | 43.1 | −1.9 | 0.8 |
| Germany | 48.7 | 40.8 | 40.3 | 43.8 | 37.7 | −6.2 | 0.7 |
| China | 64.4 | 58.9 | 51.0 | 41.5 | 33.7 | −14.9 | 0.6 |
| Albania | 17.4 | 20.1 | 22.6 | 19.4 | 27.7 | 12.3 | 0.5 |
| Bulgaria | 25.0 | 25.6 | 24.5 | 25.4 | 25.6 | 0.6 | 0.5 |
| Vietnam | 15.4 | 17.3 | 14.2 | 14.6 | 16.9 | 2.3 | 0.3 |
| Iceland | 11.6 | 12.0 | 15.3 | 13.4 | 16.8 | 9.8 | 0.3 |
| Canada (12) | 16.3 | 13.0 | 11.2 | 12.7 | 13.4 | −4.8 | 0.2 |
|
Source: Global Trade Tracker, 2022 *CAGR: Compound Annual Growth Rate |
|||||||
| Country | 2017 | 2018 | 2019 | 2020 | 2021 | CAGR* % 2017-2021 | Market share 2021% |
|---|---|---|---|---|---|---|---|
| World | 733.2 | 815.9 | 818.5 | 860.7 | 845.7 | 3.6 | 100.0 |
| Norway | 616.3 | 693.1 | 706.5 | 758.0 | 748.8 | 5.0 | 88.6 |
| Denmark | 40.6 | 47.8 | 42.6 | 39.0 | 37.3 | −2.1 | 4.4 |
| Poland | 7.5 | 8.7 | 8.1 | 8.0 | 8.2 | 2.4 | 1.0 |
| China | 11.8 | 11.2 | 10.0 | 8.1 | 6.5 | −13.8 | 0.8 |
| Netherlands | 7.1 | 7.2 | 7.7 | 7.2 | 6.2 | −3.4 | 0.7 |
| Germany | 7.3 | 6.7 | 6.6 | 6.8 | 6.1 | −4.5 | 0.7 |
| Iceland | 1.8 | 2.3 | 2.2 | 2.6 | 2.7 | 11.4 | 0.3 |
| United Kingdom | 2.2 | 1.8 | 1.9 | 2.2 | 2.3 | 1.1 | 0.3 |
| Spain | 2.4 | 2.5 | 1.9 | 2.4 | 2.2 | −1.7 | 0.3 |
| Albania | 1.3 | 2.2 | 2.5 | 1.6 | 2.1 | 12.6 | 0.3 |
| Canada (21) | 1.2 | 0.9 | 0.7 | 0.9 | 0.8 | −10.0 | 0.1 |
|
Source: Global Trade Tracker, 2022 *CAGR: Compound Annual Growth Rate |
|||||||
Top imported fish and seafood products to Germany were Atlantic or Danube salmon, fresh or chilled, valued at US$3.4 billion, (503.6 million kilograms) in 2021, followed by fresh or chilled fillets of Pacific, Atlantic, and Danube salmon, valued at US$460.7 million (47.1 million kilograms), and frozen fillets of Pacific, Atlantic and Danube salmon, valued at US$258.2 million (22.8 million kilograms).
| HS Code | Description | 2017 | 2018 | 2019 | 2020 | 2021 | CAGR* % 2017-2021 |
|---|---|---|---|---|---|---|---|
| Fish and Seafood Total | 4,952.3 | 5,630.1 | 5,269.9 | 5,071.8 | 5,608.9 | 3.2 | |
| 030214 | Atlantic or Danube salmon, fresh or chilled | 3,011.5 | 3,571.2 | 3,292.4 | 3,076.1 | 3,407.6 | 3.1 |
| 030441 | Fresh or chilled fillets of Pacific, Atlantic, and Danube salmon | 313.0 | 336.7 | 336.3 | 336.6 | 460.7 | 10.1 |
| 030481 | Frozen fillets of Pacific, Atlantic and Danube salmon | 248.4 | 220.6 | 214.5 | 245.2 | 258.2 | 1.0 |
| 030551 | Dried cod, (excluding fillets and offal) | 160.4 | 168.2 | 177.9 | 173.1 | 182.7 | 3.3 |
| 160521 | Prepared or preserved shrimps or prawns not in airtight containers (excluding smoked) | 85.2 | 98.0 | 103.3 | 92.9 | 116.0 | 8.0 |
| 030251 | Fresh or chilled cod | 109.4 | 117.3 | 85.6 | 78.2 | 100.9 | −2.0 |
| 030562 | Salted cod (excluding fillets and offal) | 103.4 | 109.3 | 84.9 | 89.1 | 71.1 | −8.9 |
| 030471 | Frozen cod fillets | 72.9 | 78.8 | 92.9 | 78.6 | 70.4 | −0.9 |
| 160529 | Prepared or preserved shrimps or prawns in airtight containers (excluding smoked) | 71.5 | 86.7 | 68.4 | 63.3 | 62.3 | −3.4 |
| 030616 | Frozen cold-water shrimps and prawns, whether in shell or not, cooked by steaming or by boiling in water | 67.2 | 65.3 | 59.7 | 43.3 | 58.3 | −3.5 |
|
Source: Global Trade Tracker, 2022 *CAGR: Compound Annual Growth Rate |
|||||||
| HS Code | Description | 2017 | 2018 | 2019 | 2020 | 2021 | CAGR* % 2017-2021 |
|---|---|---|---|---|---|---|---|
| Fish and Seafood Total | 733.2 | 815.9 | 818.5 | 860.7 | 854.9 | 3.9 | |
| 030214 | Atlantic or Danube salmon, fresh or chilled | 409.3 | 479.7 | 484.4 | 509.1 | 503.6 | 5.3 |
| 030441 | Fresh or chilled fillets of Pacific, Atlantic, and Danube salmon | 28.1 | 29.9 | 32.3 | 37.3 | 47.1 | 13.8 |
| 030251 | Fresh or chilled cod | 28.7 | 26.8 | 18.3 | 17.5 | 24.2 | −4.2 |
| 030481 | Frozen fillets of Pacific, Atlantic and Danube salmon | 18.9 | 17.6 | 18.9 | 21.4 | 22.8 | 4.8 |
| 160412 | Prepared or preserved herrings, whole or in pieces | 12.7 | 18.2 | 23.0 | 26.4 | 19.3 | 11.0 |
| 030551 | Dried cod, (excluding fillets and offal) | 18.4 | 17.5 | 17.5 | 17.1 | 18.5 | 0.1 |
| 030499 | frozen fish meat nowhere else specified (excluding fillets) | 5.1 | 6.6 | 10.6 | 9.3 | 11.6 | 22.7 |
| 030486 | Frozen herring fillets | 4.2 | 3.9 | 8.4 | 9.1 | 11.5 | 28.8 |
| 030562 | Salted cod (excluding fillets and offal) | 18.1 | 16.6 | 12.1 | 13.1 | 11.3 | −11.2 |
| 160521 | Prepared or preserved shrimps or prawns not in airtight containers (excluding smoked) | 8.6 | 9.3 | 10.8 | 9.0 | 11.0 | 6.2 |
|
Source: Global Trade Tracker, 2022 *CAGR: Compound Annual Growth Rate |
|||||||
Top five global fish and seafood suppliers by top three products to Sweden, in US$ millions, historical
| HS Code | Description | 2017 | 2018 | 2019 | 2020 | 2021 | CAGR* % 2017-2021 |
|---|---|---|---|---|---|---|---|
| Fish and Seafood Total | 4,273.2 | 4,879.3 | 4,598.7 | 4,443.6 | 4,908.9 | 3.5 | |
| 030214 | Atlantic or Danube salmon, fresh or chilled | 3,008.3 | 3,565.4 | 3,289.9 | 3,074.7 | 3,404.0 | 3.1 |
| 030441 | Fresh or chilled fillets of Pacific, Atlantic, and Danube salmon | 302.4 | 312.3 | 321.9 | 324.3 | 445.0 | 10.1 |
| 030481 | Frozen fillets of Pacific, Atlantic and Danube salmon | 230.2 | 202.9 | 198.0 | 233.8 | 247.3 | 1.8 |
|
Source: Global Trade Tracker, 2022 *CAGR: Compound Annual Growth Rate |
|||||||
| HS Code | Description | 2017 | 2018 | 2019 | 2020 | 2021 | CAGR* % 2017-2021 |
|---|---|---|---|---|---|---|---|
| Fish and Seafood Total | 236.8 | 267.4 | 231.1 | 193.9 | 229.2 | −0.8 | |
| 030616 | Frozen cold-water shrimps and prawns, whether in shell or not, cooked by steaming or by boiling in water | 53.2 | 60.3 | 54.8 | 40.1 | 48.2 | −2.5 |
| 160521 | Prepared or preserved shrimps or prawns not in airtight containers (excluding smoked) | 23.5 | 24.7 | 19.6 | 19.3 | 27.9 | 4.4 |
| 160529 | Prepared or preserved shrimps or prawns in airtight containers (excluding smoked) | 25.5 | 26.9 | 25.7 | 14.4 | 18.4 | −7.9 |
|
Source: Global Trade Tracker, 2022 *CAGR: Compound Annual Growth Rate |
|||||||
| HS Code | Description | 2017 | 2018 | 2019 | 2020 | 2021 | CAGR* % 2017-2021 |
|---|---|---|---|---|---|---|---|
| Fish and Seafood Total | 36.7 | 75.5 | 60.4 | 67.8 | 90.6 | 25.4 | |
| 030541 | Smoked Pacific, Atlantic and Danube salmon, including fillets (excluding offal) | 9.1 | 17.6 | 10.2 | 10.9 | 27.9 | 32.2 |
| 160411 | Prepared or preserved salmon, (excluding minced) | 8.5 | 21.7 | 15.6 | 14.0 | 19.2 | 22.5 |
| 030441 | Fresh or chilled fillets of Pacific, Atlantic, and Danube salmon | 0.7 | 6.3 | 6.4 | 5.1 | 10.8 | 95.9 |
|
Source: Global Trade Tracker, 2022 *CAGR: Compound Annual Growth Rate |
|||||||
| HS Code | Description | 2017 | 2018 | 2019 | 2020 | 2021 | CAGR* % 2017-2021 |
|---|---|---|---|---|---|---|---|
| Fish and Seafood Total | 46.5 | 49.0 | 46.9 | 41.4 | 47.8 | 0.7 | |
| 160419 | Prepared or preserved fish, whole or in pieces | 4.3 | 4.6 | 4.7 | 4.5 | 5.0 | 3.4 |
| 160420 | Prepared or preserved fish (excluding whole or in pieces) | 1.1 | 1.3 | 1.3 | 1.4 | 3.9 | 38.3 |
| 030483 | Frozen fillets of flat fish | 5.7 | 5.5 | 4.1 | 4.1 | 3.2 | −13.7 |
|
Source: Global Trade Tracker, 2022 *CAGR: Compound Annual Growth Rate |
|||||||
| HS Code | Description | 2017 | 2018 | 2019 | 2020 | 2021 | CAGR* % 2017-2021 |
|---|---|---|---|---|---|---|---|
| Fish and Seafood Total | 48.7 | 40.8 | 40.3 | 43.8 | 42.5 | −3.4 | |
| 160419 | Prepared or preserved fish, whole or in pieces | 8.7 | 10.3 | 13.0 | 16.3 | 11.8 | 7.9 |
| 030616 | Frozen cold-water shrimps and prawns, whether in shell or not, cooked by steaming or by boiling in water | 1.2 | 1.3 | 0.8 | 0.1 | 5.4 | 46.1 |
| 160529 | Prepared or preserved shrimps or prawns in airtight containers (excluding smoked) | 0.8 | 1.2 | 1.1 | 1.4 | 3.7 | 45.1 |
|
Source: Global Trade Tracker, 2022 *CAGR: Compound Annual Growth Rate |
|||||||
Canada's performance
Canada was Sweden's twelfth largest supplier of fish and seafood products, representing a 0.2% market value share, providing US$13.4 million and 0.8 million kilograms in 2021. This represented a −4.8% decrease in growth rate for fish and seafood imports from US$16.3 million registered in 2017. Top imports from Canada in 2021 include frozen lobsters, whether in shell or not, cooked by steaming or by boiling in water (HS: 030612), valued at US$4.4 million (0.2 million kilograms), followed by prepared or preserved shrimps or prawns not in airtight containers (excluding smoked) (HS: 160521), valued at US$2.0 million (0.2 million kilograms) and Lobsters, live, fresh or chilled, whether in shell or not (HS: 030632), valued at US$1.8 million (0.1 million kilograms).
| HS Code | Description | 2017 | 2018 | 2019 | 2020 | 2021 | CAGR* % 2017-2021 |
|---|---|---|---|---|---|---|---|
| Fish and Seafood Total | 16.3 | 13.0 | 11.2 | 12.7 | 13.4 | −4.8 | |
| 030612 | Frozen lobsters, whether in shell or not, cooked by steaming or by boiling in water | 3.9 | 2.4 | 2.3 | 3.2 | 4.4 | 3.1 |
| 160521 | Prepared or preserved shrimps or prawns not in airtight containers (excluding smoked) | 6.7 | 2.5 | 2.6 | 2.2 | 2.0 | −25.9 |
| 030632 | Lobsters, whether in shell or not, live, fresh or chilled | 2.3 | 2.1 | 2.1 | 1.0 | 1.8 | −5.9 |
|
Source: Global Trade Tracker, 2022 *CAGR: Compound Annual Growth Rate |
|||||||
| HS Code | Description | 2017 | 2018 | 2019 | 2020 | 2021 | CAGR* % 2017-2021 |
|---|---|---|---|---|---|---|---|
| Fish and Seafood Total | 1.2 | 0.9 | 0.7 | 0.9 | 0.8 | −10.0 | |
| 030612 | Frozen lobsters, whether in shell or not, cooked by steaming or by boiling in water | 0.3 | 0.2 | 0.2 | 0.2 | 0.2 | −3.4 |
| 160521 | Prepared or preserved shrimps or prawns not in airtight containers (excluding smoked) | 0.6 | 0.2 | 0.2 | 0.2 | 0.2 | −20.5 |
| 030520 | Dried, smoked or salted fish livers, roes and milt | 0.0 | 0.0 | 0.1 | 0.1 | 0.1 | 93.2 |
|
Source: Global Trade Tracker, 2022 *CAGR: Compound Annual Growth Rate |
|||||||
Retail sales by category and distribution
Fish and seafood experienced steady increased sales in 2021, following the struggles and impact that the covid-19 pandemic had on the Swedish economy and foodservice sector in 2020. As the pandemic continued throughout 2021, the Swedish government continued to enact restrictions in order to curb the spread, especially in regards to new variants. Throughout the lockdown period where people remained in home seclusion, retail sales for fish and seafood increased with constant 2021 prices growing by 5.7%. This increase can be attributed to several factors. Despite foodservice sales returning to the path of recovery in 2021, covid-19 remains a major threat for consumers, although more people have started to eat outside again. As well, many consumer trends from 2020, including increased home seclusion, with many employees still working from home leading to more homecooked meals that has continued to boost retail sales in supermarkets and e-commerce, with both of these distribution channels recording relatively strong growth in 2021. .
Historic retail sales of fish and seafood in Sweden has increased by 5.7% in CAGR from US$2.3 billion in 2017 to US$2.8 billion in 2021 and is expected to further increase in CAGR by 5.3% attaining US$3.6 billion by 2026. Both crustaceans and molluscs and cephalopods experienced positive growth in the historic period while all categories are expected to obtain positive growth in the forecasted period. Retail sales of fish experienced the greatest historical growth between 2017 to 2021, from US$2.1 billion in 2017 to US$2.6 billion in 2021 (24.9% increase), represented by a CAGR of 5.7%, and is expected to grow to US$3.3 billion (28.0% increase from 2021) by 2026, with an expected CAGR of 5.2% from 2022 to 2026. This was followed closely by retail sales of crustaceans, experiences a positive growth of 5.6% during the historic period from 2017 to 2021 from US$180.3 million to US$224.1 million, and is expected to experienced the greatest growth in the forecasted period from 2022 to 2026 with a CAGR of 6.6% with forecasted sales reaching US$303.9 million by 2026.
Healthy images of fish and seafood allow it to remain popular among consumers, especially in comparison to meat. Although fish consumption has been fluctuating in recent years due to different annual catches, demand is expected to increase slightly in the coming years. Perceived as a healthier alternative to meat, as well as due to the the minimal amounts of fish substitute products has allowed fish and seafood to trend towards greater consumption and retail growth in the future. However, the issues of sustainability and the impacts of commercial fishing is a topic that is often brought to the forefront by the media and viewed critically by Swedish society.Footnote 1
Retail sales of processed seafoods is set to perform better than many meat categories over the forecasted period, from US$588.2 million in 2017 to US$681.1 million in 2021 with a CAGR of 3.7%, and forecasted to grow to US$836.3 million by 2026, with a forecasted CAGR of 4.9% from 2022 to 2026. Chilled processed seafood experiencing the greatest historical growth from US$161.9 million in 2017 to US 207.3 million in 2021, representing a 6.4% CAGR, further being forecasted to grow to US$282.1 million by 2026, with a CAGR of 6.9% from 2022 to 2026.
Chilled processed seafood is expected to outperform shelf stable and frozen processed seafood over the forcecasted period as consumers opt for fresher and perceived healthier or tastier options. Chilled processed seafood is considered healthier and less processed as well as more convenient than the other options. In contrast, shelf stable processed seafood is expected to see further decline, despite being the largest processed seafood category, with recorded retail sales of US$383.3 million in 2021. However, shelf stable seafoods will experienced the slowest growth among processed seafood with a historic CAGR of 2.3% from 2017 to 2021 and a forecasted CAGR of 3.5% from 2022 to 2026, in contrast to chilled and frozen processed seafoods which are forecasted to grow at a respective 6.9% and 5.7% during the same period. Shelf stable processed seafoods have developed an unhealthy reputation and with consumers becoming increasingly health conscious there seems to be a declining opportunity in boosting future growth in this sector.Footnote 2
| Category | 2017 | 2021 | CAGR* % 2017-2021 | 2022 | 2026 | CAGR* % 2022-2026 |
|---|---|---|---|---|---|---|
| Fish and Seafood | 2,258.3 | 2,816.0 | 5.7 | 2,949.0 | 3,619.0 | 5.3 |
| Fish | 2,057.3 | 2,569.5 | 5.7 | 2,690.3 | 3,289.6 | 5.2 |
| Crustaceans | 180.3 | 224.1 | 5.6 | 235.7 | 303.9 | 6.6 |
| Molluscs and Cephalopods | 20.7 | 22.4 | 2.0 | 23.0 | 25.5 | 2.7 |
| Processed Seafood | 588.2 | 681.1 | 3.7 | 691.7 | 836.3 | 4.9 |
| Shelf Stable Seafood | 350.3 | 383.3 | 2.3 | 383.8 | 439.9 | 3.5 |
| Chilled Processed Seafood | 161.9 | 207.3 | 6.4 | 216.1 | 282.1 | 6.9 |
| Frozen Processed Seafood | 76.0 | 90.5 | 4.5 | 91.8 | 114.4 | 5.7 |
|
Source: Euromonitor International, 2022 *CAGR: Compound Annual Growth |
||||||
In 2021, retail sales of processed meat and seafood across various distribution channels in Sweden were valued at US$2.6 billion, representing an increase in growth rate of 4.0% from US$2.2 billion in 2017. Store-based retailing was the primary retail channel valued at US$2.4 billion (CAGR of 2.7% from US$2.2 billion in 2017) through which processed meat and seafood was distributed (92.8% market share) with modern grocery retailers, specifically supermarkets and hypermarkets as the largest channels, with retail sales of US$1.4 billion and US$618.1 million respectively, accumulating a combined market share representation of 79.6% of processed meat and seafood in 2021.
Non-store retailing experienced an increase in growth rate of 37.0%, attaining retail sales of US$184.3 million in 2021 from US$52.4 million in 2017 under its sole category of e-commerce as covid-19 and more at-home living and working influencing its presence as a distribution channel (7.2% market share in 2021).
| Outlet Type | 2017 | 2018 | 2019 | 2020 | 2021 | CAGR* % 2017-2021 |
|---|---|---|---|---|---|---|
| Processed Meat and Seafood (Total) | 2,204.2 | 2,251.1 | 2,319.6 | 2,473.8 | 2,577.6 | 4.0 |
| Store-Based Retailing | 2,151.8 | 2,188.5 | 2,242.7 | 2,325.8 | 2,393.3 | 2.7 |
| Grocery Retailers | 2,145.3 | 2,181.9 | 2,235.8 | 2,318.6 | 2,386.4 | 2.7 |
| Modern Grocery Retailers | 2,103.1 | 2,142.1 | 2,195.3 | 2,278.9 | 2,347.8 | 2.8 |
| Supermarkets | 1,251.9 | 1,275.3 | 1,298.1 | 1,343.3 | 1,434.4 | 3.5 |
| Hypermarkets | 575.9 | 587.6 | 607.3 | 634.3 | 618.1 | 1.8 |
| Convenience Stores | 136.8 | 142.6 | 149.2 | 156.4 | 153.9 | 3.0 |
| Discounters | 120.0 | 121.1 | 125.1 | 130.1 | 126.7 | 1.4 |
| Forecourt Retailers | 18.5 | 15.6 | 15.7 | 14.7 | 14.6 | −5.7 |
| Traditional Grocery Retailers | 42.3 | 39.8 | 40.5 | 39.7 | 38.7 | −2.2 |
| Independent Small Grocers | 25.6 | 24.0 | 24.3 | 23.4 | 22.9 | −2.7 |
| Other Grocery Retailers | 16.6 | 15.8 | 16.2 | 16.3 | 15.7 | −1.4 |
| Mixed Retailers | 6.5 | 6.6 | 6.9 | 7.2 | 6.9 | 1.4 |
| Non-Store Retailing | 52.4 | 62.6 | 76.9 | 148.0 | 184.3 | 37.0 |
| E-Commerce | 52.4 | 62.6 | 76.9 | 148.0 | 184.3 | 37.0 |
|
Source: Euromonitor International, 2022 1: Distribution channels for fish and seafood and processed seafood not available *CAGR: Compound Annual Growth Processed meat and seafood (as defined by Euromonitor International): processed meat, processed seafood and meat substitutes (includes all types of chilled, frozen and shelf stable meat and fish substitutes such as vegetarian sausages, vegetarian burgers, bean burgers, vegetarian fish filets etc. typically made of quorn mycoprotein, tofu, soy or texturized vegetable protein). |
||||||
Competitive landscape
The processed seafood retail market in Sweden was slightly dominated by brand labels (60.3%) in comparison to private labels, which represented 31.4% of the market share in 2021. Orkla Group was the largest processed seafood company with retail sales of US$227.9 million representing a 33.5% market share in 2021. Royal Greenland A/S experienced the largest growth rate of 7.2% as retail sales increased from US$24.3 million in 2017 to US$32.2 million in 2021.
Shelf stable seafood was the largest category (56.3% market share) within processed seafood with retail sales of US$383.3 million in 2021. Orkla Group was the largest shelf stable seafood company, dominating its competition, with retail sales valued at US$227.9 million, representing a 59.4% market share in shelf stable seafood in 2021.
| Category | Company | 2017 | 2018 | 2019 | 2020 | 2021 | CAGR* % 2017-2021 | Market share % 2021 |
|---|---|---|---|---|---|---|---|---|
| Processed Seafood | Orkla Group | 204.1 | 207.0 | 211.1 | 222.8 | 227.9 | 2.8 | 33.5 |
| Nomad Foods Ltd | 32.9 | 32.4 | 32.4 | 33.4 | 34.4 | 1.1 | 5.1 | |
| Royal Greenland A/S | 24.3 | 26.3 | 27.7 | 30.2 | 32.2 | 7.2 | 4.7 | |
| Leröy Seafood Group ASA | 18.0 | 19.1 | 20.1 | 21.8 | 23.3 | 6.7 | 3.4 | |
| David Nordqvist Fiskexport efterträdare AB | 17.3 | 18.0 | 19.0 | 20.9 | 22.4 | 6.7 | 3.3 | |
| Private Label | 175.4 | 182.5 | 189.8 | 204.5 | 214.1 | 5.1 | 31.4 | |
| Others | 52.0 | 51.3 | 53.2 | 55.3 | 56.4 | 2.1 | 8.3 | |
| Total | 588.2 | 597.7 | 616.3 | 656.5 | 681.1 | 3.7 | 100.0 | |
| Shelf Stable Seafood | Orkla Group | 204.1 | 207.0 | 211.1 | 222.8 | 227.9 | 2.8 | 59.4 |
| Fiskexporten Varberg AB | 12.2 | 12.3 | 12.6 | 13.4 | 13.8 | 3.1 | 3.6 | |
| Insula AS | 11.2 | 11.5 | 11.8 | 12.7 | 13.2 | 4.2 | 3.4 | |
| Private Label | 73.5 | 73.2 | 74.3 | 78.3 | 79.8 | 2.1 | 20.8 | |
| Others | 36.8 | 35.4 | 37.0 | 37.2 | 36.8 | 0.0 | 9.6 | |
| Total | 350.3 | 350.7 | 358.0 | 376.1 | 383.3 | 2.3 | 100.0 | |
| Chilled Processed Seafood | Royal Greenland A/S | 20.1 | 21.7 | 22.8 | 24.8 | 26.4 | 7.1 | 12.8 |
| Leröy Seafood Group ASA | 18.0 | 19.1 | 20.1 | 21.8 | 23.3 | 6.7 | 11.2 | |
| David Nordqvist Fiskexport efterträdare AB | 17.3 | 18.0 | 19.0 | 20.9 | 22.4 | 6.7 | 10.8 | |
| Private Label | 73.0 | 78.6 | 82.4 | 89.9 | 96.0 | 7.1 | 46.3 | |
| Others | 12.1 | 12.8 | 13.3 | 14.9 | 16.6 | 8.4 | 8.0 | |
| Total | 161.9 | 168.7 | 176.9 | 193.4 | 207.3 | 6.4 | 100.0 | |
| Frozen Processed Seafood | Nomad Foods Ltd | 32.9 | 32.4 | 32.4 | 33.4 | 34.4 | 1.1 | 38.1 |
| Royal Greenland A/S | 4.2 | 4.6 | 5.0 | 5.4 | 5.7 | 8.0 | 6.3 | |
| Ecab Djupfryst AB | 3.5 | 3.8 | 4.0 | 4.4 | 4.6 | 7.0 | 5.1 | |
| Private | 28.9 | 30.7 | 33.1 | 36.3 | 38.3 | 7.3 | 42.3 | |
| Others | 3.1 | 3.0 | 3.0 | 3.2 | 3.0 | −0.9 | 3.3 | |
| Total | 76.0 | 78.3 | 81.4 | 87.0 | 90.5 | 4.5 | 100.0 | |
|
Source: Euromonitor International, 2022 *CAGR: Compound Annual Growth Rate |
||||||||
Brands Abba (Orkla Group) and Kalles Kaviar (Orkla Group) were the two largest brands in processed seafood with a respective 19.4% and 9.9% market share in 2021. The brand Royal Greenland from Royal Greenland A/S experienced the largest growth rate of 3.5% as its market share percentage increased from 4.1% in 2017 to 4.7% in 2021.
| Category | Brand | 2017 | 2018 | 2019 | 2020 | 2021 | CAGR* % 2017-2021 |
|---|---|---|---|---|---|---|---|
| Processed Seafood | Abba (Orkla Group) | 20.2 | 20.1 | 19.9 | 19.7 | 19.4 | −1.0 |
| Kalles Kaviar (Orkla Group) | 10.2 | 10.3 | 10.2 | 10.1 | 9.9 | −0.7 | |
| Findus (Nomad Foods Ltd) | 5.6 | 5.4 | 5.3 | 5.1 | 5.1 | −2.3 | |
| Royal Greenland (Royal Greenland A/S) | 4.1 | 4.4 | 4.5 | 4.6 | 4.7 | 3.5 | |
| Leroy (Leröy Seafood Group ASA) | 3.1 | 3.2 | 3.3 | 3.3 | 3.4 | 2.3 | |
| Private label | 29.8 | 30.5 | 30.8 | 31.2 | 31.4 | 1.3 | |
| Others | 8.8 | 8.6 | 8.6 | 8.4 | 8.3 | −1.5 | |
| Total | 100.0 | 100.0 | 100.0 | 100.0 | 100.0 | ||
| Shelf Stable Seafood | Abba (Orkla Group) | 33.9 | 34.3 | 34.2 | 34.4 | 34.5 | 0.4 |
| Kalles Kaviar (Orkla Group) | 17.2 | 17.5 | 17.5 | 17.6 | 17.6 | 0.6 | |
| Varbergs (Fiskexporten Varberg AB) | 3.5 | 3.5 | 3.5 | 3.6 | 3.6 | 0.7 | |
| Private label | 21.0 | 20.9 | 20.8 | 20.8 | 20.8 | −0.2 | |
| Others | 10.5 | 10.1 | 10.3 | 9.9 | 9.6 | −2.2 | |
| Total | 100.0 | 100.0 | 100.0 | 100.0 | 100.0 | ||
| Chilled Processed Seafood | Royal Greenland (Royal Greenland A/S) | 12.4 | 12.9 | 12.9 | 12.8 | 12.8 | 0.8 |
| Leroy (Leröy Seafood Group ASA) | 11.1 | 11.3 | 11.3 | 11.3 | 11.2 | 0.2 | |
| Falkeskog (David Nordqvist Fiskexport efterträdare AB) | 8.9 | 8.7 | 8.7 | 8.6 | 8.6 | −0.9 | |
| Private label | 45.1 | 46.6 | 46.6 | 46.5 | 46.3 | 0.7 | |
| Others | 7.4 | 7.6 | 7.5 | 7.7 | 8.0 | 2.0 | |
| Total | 100.0 | 100.0 | 100.0 | 100.0 | 100.0 | ||
| Frozen Processed Seafood | Findus (Nomad Foods Ltd) | 43.3 | 41.4 | 39.8 | 38.4 | 38.1 | −3.1 |
| Royal Greenland (Royal Greenland A/S) | 5.5 | 5.9 | 6.1 | 6.3 | 6.3 | 3.5 | |
| Ecab (Ecab Djupfryst AB) | 4.6 | 4.8 | 4.9 | 5.0 | 5.1 | 2.6 | |
| Private label | 38.1 | 39.2 | 40.7 | 41.8 | 42.3 | 2.6 | |
| Others | 4.1 | 3.9 | 3.6 | 3.7 | 3.3 | −5.3 | |
| Total | 100.0 | 100.0 | 100.0 | 100.0 | 100.0 | ||
|
Source: Euromonitor International, 2022 *CAGR: Compound Annual Growth Rate |
|||||||
New product launch analysis
According to Mintel's Global New Products Database (GNPD), there were 438 fish and fish products launched in Sweden between January 2017 and December 2021. Of those fish products released, 216 were processed fish products, 108 were pet products and 51 were released as meal and meal center products.
In terms of new products launches containing fish and fish products as an ingredient, 2017 and 2018 had the highest product launches, 112 and 108 respectively. The top sub-categories of products offered were fish products, wet cat food and prepared meals in the prescribed period of January 2016 to December 2020. Top claims (may contain more than one claim per package) were ethical-environmentally friendly, ethical-sustainable (habitat/resources) packages and pet - adult. Top package types were trays, flexible and flexible stand-up pouch products. These were launched primarily as new variety/range extensions and new products. Top flavours (including blends) identified were unflavoured/plain, smoke and salmon, while top ingredients identified were fish and fish products, Atlantic salmon and salmon.
| Product attributes | Yearly launch counts | Total | ||||
|---|---|---|---|---|---|---|
| 2017 | 2018 | 2019 | 2020 | 2021 | ||
| Yearly product launches | 112 | 108 | 85 | 58 | 75 | 438 |
| Top five sub-categories | ||||||
| Fish Products | 59 | 65 | 37 | 23 | 32 | 216 |
| Cat Food Wet | 7 | 10 | 8 | 4 | 7 | 36 |
| Prepared Meals | 10 | 9 | 6 | 6 | 5 | 36 |
| Cat Snacks and Treats | 6 | 3 | 14 | 6 | 5 | 34 |
| Dog Food Wet | 2 | 0 | 4 | 5 | 4 | 15 |
| Top five claims | ||||||
| Ethical - Environmentally Friendly Product | 35 | 53 | 39 | 16 | 36 | 179 |
| Ethical - Sustainable (Habitat/Resources) | 33 | 47 | 40 | 16 | 39 | 175 |
| Pet - Adult | 17 | 14 | 18 | 12 | 14 | 75 |
| Not Specified | 28 | 22 | 6 | 7 | 11 | 74 |
| Ease of Use | 15 | 16 | 13 | 10 | 14 | 68 |
| Imported status | ||||||
| Imported | 18 | 20 | 23 | 15 | 24 | 100 |
| Not Imported | 19 | 23 | 13 | 3 | 13 | 71 |
| Top packaged types | ||||||
| Tray | 39 | 32 | 26 | 16 | 26 | 139 |
| Flexible | 16 | 12 | 8 | 8 | 11 | 55 |
| Flexible stand-up pouch | 12 | 11 | 10 | 10 | 6 | 49 |
| Skinpack | 11 | 13 | 8 | 5 | 2 | 39 |
| Tub | 9 | 8 | 7 | 6 | 7 | 37 |
| Top launch types | ||||||
| New Variety/Range Extension | 55 | 51 | 33 | 27 | 36 | 202 |
| New Product | 34 | 24 | 26 | 16 | 19 | 119 |
| New Packaging | 16 | 27 | 20 | 14 | 14 | 91 |
| Relaunch | 4 | 6 | 5 | 0 | 5 | 20 |
| New Formulation | 3 | 0 | 1 | 1 | 1 | 6 |
| Top five flavours (including blend) | ||||||
| Unflavoured/Plain | 37 | 41 | 27 | 17 | 16 | 138 |
| Salmon | 6 | 3 | 7 | 5 | 5 | 26 |
| Smoke | 6 | 6 | 6 | 2 | 5 | 25 |
| Dill | 2 | 6 | 2 | 2 | 0 | 12 |
| Chicken | 4 | 2 | 3 | 1 | 1 | 11 |
| Top five fish ingredients | ||||||
| Fish and Fish Products (Food) | 21 | 20 | 27 | 15 | 17 | 100 |
| Atlantic Salmon (Food) | 25 | 15 | 7 | 5 | 12 | 64 |
| Salmon (Food) | 14 | 10 | 11 | 11 | 15 | 61 |
| Pink Shrimp (Food) | 12 | 9 | 4 | 5 | 2 | 32 |
| Shrimp (Food) | 8 | 8 | 3 | 4 | 8 | 31 |
| Source: Mintel, 2022 | ||||||
Examples of new product launches
Lamb & Salmon Bars
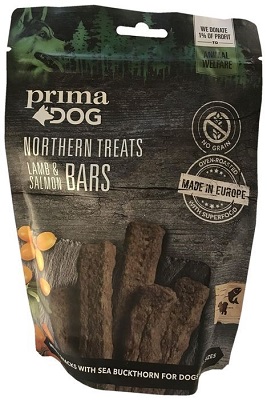
Source: Mintel, 2021
| Company | Prima Pet Premium |
|---|---|
| Brand | PrimaDog Northern Treats |
| Category | Pet Food |
| Sub-category | Dog Snacks and Treats |
| Market | Sweden |
| Store name | Hemköp |
| Store type | Supermarket |
| Date published | December 2021 |
| Launch type | New variety / range extension |
| Price in US dollars | 3.31 |
PrimaDog Northern Treats Lamm och Laxstänger (Lamb & Salmon Bars) are described as meaty snacks with sea buckthorn for dogs of all sizes. Sea buckthorn is said to be good for skin and coat. This oven roasted complementary food for dogs is free from grain, and retails in an 80 gram pack bearing the Facebook logo. The manufacturer claims to donate 1% of profit to animal welfare.
Chicken and Sustainable Tuna Fillets for Adult Cats
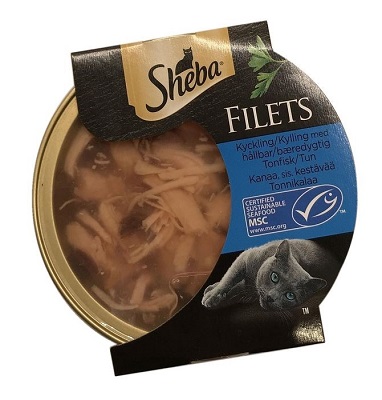
Source: Mintel, 2021
| Company | Mars |
|---|---|
| Brand | Sheba |
| Category | Pet Food |
| Sub-category | Cat Snacks and Treats |
| Market | Sweden |
| Store name | Hemköp |
| Store type | Supermarket |
| Date published | December 2021 |
| Launch type | New variety / range extension |
| Price in US dollars | 1.52 |
Sheba Kompletteringsfoder till Vuxna Katter (Chicken and Sustainable Tuna Fillets for Adult Cats) is now available. The supplementary cat feed retails in a 60 gram pack featuring the MSC logo.
Lemon Pepper Hot Smoked Salmon Fillet
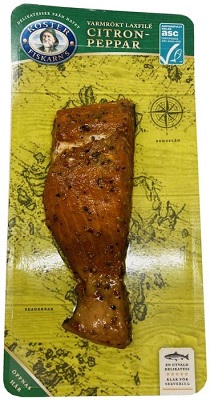
Source: Mintel, 2021
| Company | Kosterfiskarn |
|---|---|
| Brand | Koster Fiskarn's |
| Category | Processed Fish, Meat and Egg Products |
| Sub-category | Fish Products |
| Market | Sweden |
| Store name | ICA Nära |
| Store type | Convenience Store |
| Date published | December 2021 |
| Launch type | New packaging |
| Price in US dollars | 0.66 |
Koster Fiskarn's Varmrökt Laxfilé Citronpeppar (Lemon Pepper Hot-Smoked Salmon Fillet) has been repackaged. The product is ready to serve and retails in a 125 gram pack bearing the ASC Certified logo.
Prawn Crackers
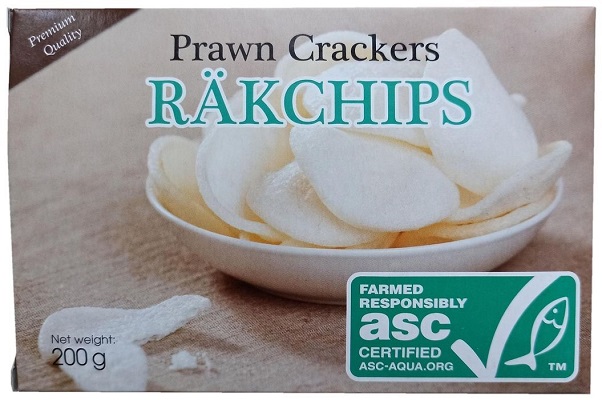
Source: Mintel, 2021
| Company | Madam Hong Import Export |
|---|---|
| Brand | Madam Hong Import Export |
| Category | Snacks |
| Sub-category | Cassava and Other Root-Based Snacks |
| Market | Sweden |
| Store name | Hemköp |
| Store type | Supermarket |
| Date published | December 2021 |
| Launch type | New product |
| Price in US dollars | 2.17 |
Madam Hong Import Export Räkchips (Prawn Crackers) are now available. This premium quality product retails in a 200 gram pack bearing the ASC (Aquaculture Stewardship Council) Responsible Aquaculture Certified logo and preparation instructions.
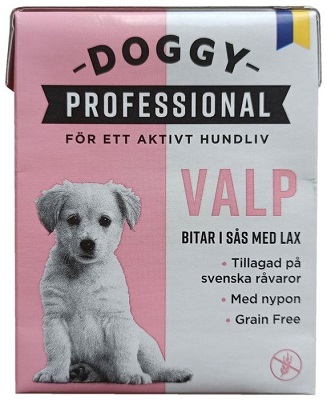
Salmon Pieces in Sauce Puppy Food
Source: Mintel, 2021
| Company | Doggy |
|---|---|
| Brand | Doggy Professional |
| Category | Pet Food |
| Sub-category | Dog Food Wet |
| Market | Sweden |
| Store name | Hemköp |
| Store type | Supermarket |
| Date published | November 2021 |
| Launch type | New variety / range extension |
| Price in US dollars | 2.33 |
Doggy Professional Valp Bitar i Sås med Lax (Salmon Pieces in Sauce Puppy Food) is suitable for an active dog life. An active dog is said to need extra energy, and for this reason, the product contains higher energy levels and nutritional additives. The wet dog food is cooked with Swedish and natural ingredients and is made with rosehip which is rich in antioxidants. The grain free product contains no unnecessary additives or added sugar, and retails in a 370 gram pack bearing the FSC Mix logo, and dosage instructions.
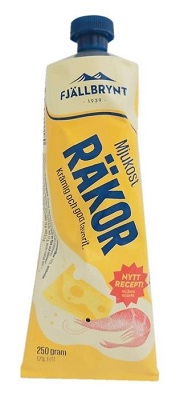
Shrimp Soft Cheese
Source: Mintel, 2021
| Company | Fjällbrynt |
|---|---|
| Brand | Fjällbrynt |
| Category | Dairy |
| Sub-category | Processed Cheese |
| Market | Sweden |
| Store name | Willys |
| Store type | Supermarket |
| Date published | July 2021 |
| Launch type | New formulation |
| Price in US dollars | 3.24 |
Fjällbrynt Mjukost Räkor (Shrimp Soft Cheese) has been reformulated with a new and improved recipe. The Swedish melting cheese product features 17% fat, is said to be creamy and soft, and retails in a 250 gram pack.
Opportunities for Canada
In 2021, Sweden was the ninth largest market (3.3% market value share) for fish and seafood in the world with imports valued at US$5.5 billion (845.7 million kilograms). Sweden experienced a CAGR of 2.9% as imports increased from US$5.0 billion (733.2 million kilograms) in 2017 (9.4% from US$5.1 billion in 2020).
Canada was the fourteenth largest market in fish and seafood, accounting for 2.2% of the total world market share (representing US$3.7 billion and 582.0 million kilograms) in 2021.
Canada was Sweden's twelfth largest supplier of fish and seafood products, representing a 0.2% market value share, providing US$13.4 million and 0.8 million kilograms in 2021. This represented a −4.8% decrease in growth rate for fish and seafood imports from US$16.3 million registered in 2017. Top imports from Canada in 2021 include frozen lobsters, whether in shell or not, cooked by steaming or by boiling in water (HS: 030612), valued at US$4.4 million (0.2 million kilograms), followed by prepared or preserved shrimps or prawns not in airtight containers (excluding smoked) (HS: 160521), valued at US$2.0 million (0.2 million kilograms) and Lobsters, live, fresh or chilled, whether in shell or not (HS: 030632), valued at US$1.8 million (0.1 million kilograms).
About CETA, The Comprehensive Economic and Trade Agreement (CETA)
With CETA, 98% of EU tariff lines are now duty-free for Canadian goods, and an additional 1% will be eliminated over seven years. Tariff elimination provides enhanced export opportunities into the EU market for Canadian producers, processors, and manufacturers, as well as for agricultural and agri-food products, fish and seafood, forestry goods, and the full range of industrial goods.
How does CETA benefit Canadian fish and seafood exporters? (Global Affairs Canada, 2021)
- Under CETA, almost 96% of EU tariff lines for fish and seafood products have become duty-free. 100% of these tariff lines will be duty-free after seven years.
- Before the CETA, EU tariffs for fish and seafood averaged 11% and could be as high as 25%.
For more information, please visitOpportunities and Benefits of CETA for Canada's Fish and Seafood Exporters.
In addition, please consult the Canada Tariff Finder to explore tariff information for the CPTPP market, and other countries with which Canada has a free trade agreement.
For more information
The Canadian Trade Commissioner Service:
International Trade Commissioners can provide Canadian industry with on-the-ground expertise regarding market potential, current conditions and local business contacts, and are an excellent point of contact for export advice.
More agri-food market intelligence:
International agri-food market intelligence
Discover global agriculture and food opportunities, the complete library of Global Analysis reports, market trends and forecasts, and information on Canada's free trade agreements.
Agri-food market intelligence service
Canadian agri-food and seafood businesses can take advantage of a customized service of reports and analysis, and join our email subscription service to have the latest reports delivered directly to their inbox.
More on Canada's agriculture and agri-food sectors:
Canada's agriculture sectors
Information on the agriculture industry by sector. Data on international markets. Initiatives to support awareness of the industry in Canada. How the department engages with the industry.
For additional information on Seafood Expo Global, please contact:
Ben Berry, Deputy Director
Trade Show Strategy and Delivery
Agriculture and agri-food Canada
ben.berry@agr.gc.ca
Resources
- Euromonitor International 2022. Processed meat, seafood, and alternatives to meat in Sweden. Country Report, December 2021
- Global Affairs Canada, Opportunities and Benefits of CETA for Canada's Fish and Seafood Exporters.
- Global Affairs Canada, About CETA
- Global Trade Tracker, 2022
- Mintel 2022. A year of innovation in fish & fish substitutes, 2021. Report, January 2022
- Mintel Global New Products Database, 2022
Sector Trend Analysis – Fish and seafood trends in Sweden
Global Analysis Report
Prepared by: Richard Lin, International Market Research Analyst
© Her Majesty the Queen in Right of Canada, represented by the Minister of Agriculture and Agri-Food (2022).
Photo credits
All photographs reproduced in this publication are used by permission of the rights holders.
All images, unless otherwise noted, are copyright Her Majesty the Queen in Right of Canada.
To join our distribution list or to suggest additional report topics or markets, please contact:
Agriculture and Agri-Food Canada, Global Analysis1341 Baseline Rd, Tower 5, 3rd floor
Ottawa ON K1A 0C5
Canada
Email: aafc.mas-sam.aac@agr.gc.ca
The Government of Canada has prepared this report based on primary and secondary sources of information. Although every effort has been made to ensure that the information is accurate, Agriculture and Agri-Food Canada (AAFC) assumes no liability for any actions taken based on the information contained herein.
Reproduction or redistribution of this document, in whole or in part, must include acknowledgement of agriculture and agri-food Canada as the owner of the copyright in the document, through a reference citing AAFC, the title of the document and the year. Where the reproduction or redistribution includes data from this document, it must also include an acknowledgement of the specific data source(s), as noted in this document.
Agriculture and Agri-Food Canada provides this document and other report services to agriculture and food industry clients free of charge.