

Note: This report includes forecasting data that is based on baseline historical data.
Executive summary
In 2021, Taiwanese imports of fish and seafood totaled US$1.8 billion, or 1.1% of the total market. The Taiwanese seafood market grew at a compound annual growth rate (CAGR) of 4.8% from 2017 to 2021, above the global average. Canada was the fourteenth largest supplier of fish and seafood to Taiwan, with total exports of US$39.0 million, or 2.1% of total Taiwanese supplies of fish and seafood. Top exporters of fish and seafood to Taiwan included China, Japan, and Norway. Top Canadian exports of fish and seafood to Taiwan included salmon, lobster, and halibut.
Fish and seafood are popular in Taiwan, where they are perceived as having health benefits. Taiwanese consumers are becoming more health conscious, and many are willing to pay a premium for foods that will aid in weight loss. Taiwanese consumers also favour convenient foods that take up little storage space. Taiwan has an extremely high concentration of convenience stores, however they played a relatively minor part in sales of fish and seafood. The largest category of retailers in fish and seafood distribution was supermarkets. E-commerce was also an important distribution channel, with US$137.5 million in fish and seafood sales in 2021. Taiwan has one of the highest rates of e-commerce penetration in the world.
Crustaceans were the largest category of fish and seafood in Taiwan in 2021, with total sales of US$747.3 million, while fish sales totaled US$574.8 million, and cephalopods saw sales of US$307.4 million.
Expenditure on fish and seafood and processed seafood are both expected to see strong growth from 2022 to 2026, presenting potential opportunities for Canadian exporters.
Trade overview
In 2021, Taiwan was the world's twentieth largest importer of fish and seafood products, with US$1.8 billion in imports. This represents 1.1% of global fish and seafood imports and saw strong growth from 2017-2021. Taiwanese fish and seafood imports grew at a CAGR of 4.8% from 201-2021, rising from US$1.5 billion. Canada was the fourteenth largest importer of fish and seafood, with US$3.7 billion in imports, representing 2.2% of global fish and seafood imports. In 2021, Taiwan was a net importer of fish and seafood, with US$1.8 billion in imports and US$1.7 billion in exports, with net imports equal to US$119.3 million.
| Country | 2017 | 2018 | 2019 | 2020 | 2021 | CAGR* % 2017-2021 | Market share % 2021 |
|---|---|---|---|---|---|---|---|
| World total | 149,612.1 | 161,620.7 | 161,010.0 | 150,522.8 | 169,293.0 | 3.1 | 100.0 |
| United States | 22,967.0 | 23,988.6 | 23,519.6 | 22,976.8 | 30,176.4 | 7.1 | 17.8 |
| China (People's Republic of) | 11,110.5 | 14,745.2 | 18,413.6 | 15,267.6 | 17,760.3 | 12.4 | 10.5 |
| Japan | 15,437.9 | 15,779.8 | 15,564.6 | 13,577.9 | 14,375.7 | −1.8 | 8.5 |
| Spain | 8,093.7 | 8,679.8 | 8,151.8 | 7,357.2 | 8,895.6 | 2.4 | 5.3 |
| France | 6,905.8 | 7,155.0 | 6,811.3 | 6,491.8 | 7,872.9 | 3.3 | 4.7 |
| Italy | 6,691.6 | 7,170.0 | 6,774.8 | 6,170.9 | 7,600.1 | 3.2 | 4.5 |
| Germany | 6,199.4 | 6,463.5 | 6,257.8 | 6,284.9 | 6,263.7 | 0.3 | 3.7 |
| Korea (Rep. of) | 5,210.7 | 6,060.3 | 5,717.6 | 5,537.8 | 6,039.6 | 3.8 | 3.6 |
| Sweden | 4,996.4 | 5,674.5 | 5,301.0 | 5,109.6 | 5,659.0 | 3.2 | 3.3 |
| Netherlands | 4,309.1 | 4,556.5 | 4,523.9 | 4,611.1 | 5,140.4 | 4.5 | 3.0 |
| United Kingdom | 4,362.0 | 4,540.9 | 4,718.9 | 4,450.9 | 4,761.1 | 2.2 | 2.8 |
| Canada (14th) | 3,019.4 | 3,085.1 | 3,256.5 | 2,979.9 | 3,698.2 | 5.2 | 2.2 |
| Taiwan (20th) | 1,522.2 | 1,693.7 | 1,752.5 | 1,809.9 | 1,836.2 | 4.8 | 1.1 |
|
Source: Global Trade Tracker, 2022 *CAGR: Compound Annual Growth Rate |
|||||||
In 2021, Taiwan's three largest suppliers of fish and seafood were China (US$228.2 million, 12.4% market share), Japan (US$207.2 million, 11.3% market share), and Norway (US$203.4 million, 11.1% market share). Japan saw particularly fast growth in its seafood exports to Taiwan from 2017-2021, occurring at a CAGR of 17.7%. Canada was Taiwan's fourteenth largest supplier of fish and seafood, with US$39.0 million of fish and seafood exports to Taiwan, and a 2.1% market share. Taiwanese imports of Canadian fish and seafood grew at a CAGR of 2.1% from 2017-2021, somewhat behind the overall growth rate of Taiwanese fish and seafood imports.
| Country | 2017 | 2018 | 2019 | 2020 | 2021 | CAGR* % 2017-2021 | Market share % 2021 |
|---|---|---|---|---|---|---|---|
| World total | 1,522.2 | 1,693.9 | 1,751.7 | 1,809.7 | 1,836.3 | 4.8 | 100.0 |
| China (People's Republic of) | 254.5 | 261.6 | 252.1 | 250.3 | 228.2 | −2.7 | 12.4 |
| Japan | 108.1 | 122.3 | 139.0 | 162.2 | 207.2 | 17.7 | 11.3 |
| Norway | 132.3 | 124.4 | 139.0 | 141.2 | 203.4 | 11.4 | 11.1 |
| Indonesia | 91.5 | 89.7 | 99.7 | 116.1 | 102.0 | 2.8 | 5.6 |
| Viet-Nam | 87.2 | 95.5 | 109.1 | 108.1 | 99.0 | 3.2 | 5.4 |
| Thailand | 84.9 | 94.6 | 82.0 | 86.7 | 97.7 | 3.6 | 5.3 |
| Chile | 74.1 | 98.0 | 83.5 | 112.4 | 86.8 | 4.0 | 4.7 |
| Honduras | 43.2 | 50.6 | 74.9 | 98.0 | 71.8 | 13.5 | 3.9 |
| Peru | 55.1 | 63.2 | 69.3 | 48.2 | 69.9 | 6.1 | 3.8 |
| Nicaragua | 57.2 | 69.2 | 63.8 | 82.0 | 61.9 | 2.0 | 3.4 |
| Canada (14th) | 35.0 | 51.2 | 36.5 | 34.3 | 39.0 | 2.7 | 2.1 |
|
Source: Global Trade Tracker, 2022 *CAGR: Compound Annual Growth Rate |
|||||||
The largest category of Taiwanese fish and seafood imports in 2021 was frozen shrimp and prawns (HS:030617), which saw US$287.5 million in imports (15.7% share), and grew at a CAGR of 5.5% from 2017-2021. This was followed by waste or animal fodder from fish or aquatic invertebrates (HS:230120), with US$193.7 million, (10.5% market share, CAGR of 1.4%). Fresh or chilled atlantic and danube salmon saw imports had US$174.7 million in imports in 2021 (9.5% market share, CAGR of 7.8%). Frozen scallops, the fifth largest category in 2021, was notable for having grown at a CAGR of 29.5% from 2017-2021.
| HS Code | Description | 2017 | 2018 | 2019 | 2020 | 2021 | *CAGR % 2017-2021 |
|---|---|---|---|---|---|---|---|
| Fish and Seafood Total | 1,521.8 | 1,693.3 | 1,752.3 | 1,809.5 | 1,836.1 | 4.8 | |
| 030617 | frozen shrimps and prawns | 232.1 | 257.2 | 283.1 | 327.8 | 287.5 | 5.5 |
| 230120 | flours, meals and pellets of fish or crustaceans, molluscs or other aquatic invertebrates, unfit for human consumption | 183.4 | 206.2 | 175.9 | 181.4 | 193.7 | 1.4 |
| 030214 | fresh or chilled atlantic salmon and danube salmon | 129.6 | 139.0 | 145.5 | 146.8 | 174.7 | 7.8 |
| 030743 | cuttle fish and squid, frozen | 76.4 | 104.7 | 127.4 | 132.9 | 118.7 | 11.7 |
| 030722 | Frozen scallops | 29.9 | 41.5 | 54.6 | 64.2 | 84.0 | 29.5 |
| 030331 | frozen lesser or greenland, atlantic, and pacific halibut | 49.7 | 59.0 | 54.7 | 56.6 | 82.2 | 13.4 |
| 030499 | frozen fish meat, nowhere else specified (excluding fillets) | 54.8 | 70.0 | 68.9 | 70.4 | 81.1 | 10.3 |
| 121221 | seaweeds and other algae, fresh, chilled, frozen or dried, fit for human consumption | 47.5 | 50.2 | 47.0 | 46.4 | 48.2 | 0.4 |
| 160420 | prepared or preserved fish (excluding whole or in pieces) | 20.4 | 26.2 | 30.9 | 31.8 | 39.4 | 17.9 |
| 030354 | frozen mackerel | 20.6 | 18.2 | 21.5 | 23.2 | 34.8 | 14.0 |
|
Source: Global Trade Tracker, 2022 *CAGR: Compound Annual Growth Rate |
|||||||
Top five global fish and seafood suppliers by top three products to Taiwan, in US$ millions, historical
| HS Code | Description | 2017 | 2018 | 2019 | 2020 | 2021 | *CAGR % 2017-2021 |
|---|---|---|---|---|---|---|---|
| Fish and Seafood Total | 254.2 | 261.5 | 252.0 | 250.4 | 228.2 | −2.7 | |
| 030743 | cuttle fish and squid, frozen | 20.9 | 28.5 | 35.0 | 32.2 | 26.8 | 6.4 |
| 121221 | seaweeds and other algae, fresh, chilled, frozen or dried, fit for human consumption | 15.9 | 19.9 | 19.2 | 16.9 | 19.2 | 4.8 |
| 030617 | frozen shrimps and prawns | 17.1 | 20.7 | 18.2 | 18.9 | 18.3 | 1.7 |
|
Source: Global Trade Tracker, 2022 *CAGR: Compound Annual Growth Rate |
|||||||
| HS Code | Description | 2017 | 2018 | 2019 | 2020 | 2021 | *CAGR % 2017-2021 |
|---|---|---|---|---|---|---|---|
| Fish and Seafood Total | 108.1 | 122.3 | 139.0 | 162.2 | 207.2 | 17.7 | |
| 030722 | Frozen scallops | 18.5 | 30.4 | 40.2 | 50.3 | 68.9 | 38.9 |
| 160420 | prepared or preserved fish (excluding whole or in pieces) | 8.9 | 10.3 | 10.7 | 12.5 | 19.8 | 22.1 |
| 230120 | flours, meals and pellets of fish or crustaceans, molluscs or other aquatic invertebrates, unfit for human consumption | 7.7 | 8.1 | 11.2 | 14.2 | 16.9 | 21.7 |
|
Source: Global Trade Tracker, 2022 *CAGR: Compound Annual Growth Rate |
|||||||
| HS Code | Description | 2017 | 2018 | 2019 | 2020 | 2021 | *CAGR % 2017-2021 |
|---|---|---|---|---|---|---|---|
| Fish and Seafood Total | 132.3 | 124.4 | 139.0 | 141.2 | 203.4 | 11.4 | |
| 030214 | fresh or chilled atlantic salmon and danube salmon | 92.6 | 86.7 | 97.7 | 98.0 | 143.4 | 11.6 |
| 030354 | frozen mackerel | 16.2 | 12.0 | 15.0 | 20.9 | 30.2 | 16.9 |
| 030441 | fresh or chilled fillets of pacific, atlantic, or danube salmon | 4.2 | 4.9 | 5.6 | 4.7 | 7.4 | 15.2 |
|
Source: Global Trade Tracker, 2022 *CAGR: Compound Annual Growth Rate |
|||||||
| HS Code | Description | 2017 | 2018 | 2019 | 2020 | 2021 | *CAGR % 2017-2021 |
|---|---|---|---|---|---|---|---|
| Fish and Seafood Total | 91.5 | 89.7 | 99.7 | 116.1 | 102.0 | 2.8 | |
| 030743 | cuttle fish and squid, frozen | 28.3 | 30.7 | 27.7 | 46.5 | 43.3 | 11.2 |
| 030359 | frozen anchovies, indian mackerels seerfishes, jacks, crevalles, silver pomfrets, pacific saury, scads, capelin, kawakawa, bonitos, marlins, sailfishes and spearfish | 4.3 | 7.3 | 8.8 | 6.3 | 7.2 | 13.8 |
| 030617 | frozen shrimps and prawns | 6.4 | 7.7 | 8.0 | 6.5 | 7.1 | 2.6 |
|
Source: Global Trade Tracker, 2022 *CAGR: Compound Annual Growth Rate |
|||||||
| HS Code | Description | 2017 | 2018 | 2019 | 2020 | 2021 | *CAGR % 2017-2021 |
|---|---|---|---|---|---|---|---|
| Fish and Seafood Total | 87.2 | 95.5 | 109.1 | 108.1 | 99.0 | 3.2 | |
| 030617 | frozen shrimps and prawns | 30.3 | 32.4 | 36.5 | 29.7 | 21.0 | −8.8 |
| 030499 | frozen fish meat, nowhere else specified (excluding fillets) | 7.8 | 10.3 | 13.7 | 14.8 | 19.1 | 25.1 |
| 160529 | shrimps and prawns, prepared or preserved, in airtight containers (excluding smoked) | 1.8 | 2.8 | 4.5 | 5.5 | 5.7 | 33.4 |
|
Source: Global Trade Tracker, 2022 *CAGR: Compound Annual Growth Rate |
|||||||
Canada's performance
In 2021, Canada was the fourteenth largest supplier of fish and seafood to Taiwan, with US$39.0 million in exports or a 2.1% market share. Canadian exports of fish and seafood to Taiwan grew at a CAGR of 2.7% from 2017 to 2021. Taiwan was a net importer of fish and seafood from Canada in 2021. In 2021, Taiwan had net imports of US$24.2 million of fish and seafood from Canada.
Top Canadian seafood exports to Taiwan included lobster, halibut, and salmon. Canadian exports of frozen halibut (HS: 030331) accounted for US$7.8 million in exports in 2021 (20.0% share of Canadian seafood exports to Taiwan), salmon (HS: 030214) accounted for US$7.1 million (18.2% share), frozen anchovies etc. (HS: 030359) accounted for US$6.7 million (17.2% share), frozen lobsters (HS:030612) accounted for US$6.4 million (16.4% share), and live lobsters (HS: 030632) accounted for US$6.2 million (15.9% share). The remaining 12.3% of Canadian seafood exports to Taiwan were split between various smaller categories. Canadian exports of anchovies and other small fish was registered rapid growth of a CAGR of 70.1% from 2017-2021, while halibut grew at a CAGR of 17.4%.
In 2021, Canada's US$7.8 million exports of frozen halibut (HS: 030331) to Taiwan gave Canada a 9.5% share and made Canada the third largest supplier, behind Greenland (US$43.5 million, 53.0% share) and Iceland (US$16.9 million 20.6% share). Canada was the fourth largest supplier of fresh or chilled salmon (HS: 030214) (US$ 7.1 million, 4.1% share) after Norway (US$143.4 million, 82.0% market share), the United Kingdom (US$14.9 million, 8.5% share) and Australia (US$8.9 million, 8.5%). Canada was the second largest supplier of frozen anchovies etc. (HS: 030359) (US$6.7 million, 22.5% share) behind Indonesia (US$7.2 million, 24.2% share). Canada was the largest supplier of frozen lobsters (HS: 030612) (US$ 6.4 million 78.0% market share), and Canada's only competitor of note was the United States (US$1.7 million, 20.7% market share). Canada was the second largest supplier of live lobsters (HS: 030612) (US$6.2 million, 49.6% market share) just behind the United States (US$6.3 million, 50.4% market share).
| HS Code | Description | 2017 | 2018 | 2019 | 2020 | 2021 | *CAGR % 2017-2021 |
|---|---|---|---|---|---|---|---|
| Total - fish and seafood imports | 35.0 | 51.2 | 36.5 | 34.3 | 39.0 | 2.7 | |
| 030331 | frozen lesser or greenland, atlantic, and pacific halibut | 4.1 | 8.7 | 4.5 | 5.8 | 7.8 | 17.4 |
| 030214 | fresh or chilled atlantic salmon and danube salmon | 6.5 | 14.2 | 8.0 | 4.8 | 7.1 | 2.2 |
| 030359 | frozen anchovies, indian mackerels seerfishes, jacks, crevalles, silver pomfrets, pacific saury, scads, capelin, kawakawa, bonitos, marlins, sailfishes and spearfish | 0.8 | 6.1 | 2.8 | 3.4 | 6.7 | 70..1 |
| 030612 | frozen lobsters, even smoked, cooked by steaming or by boiling in water | 5.6 | 5.6 | 8.6 | 5.9 | 6.4 | 3.4 |
| 030632 | lobsters, live, fresh or chilled | 10.7 | 10.2 | 7.0 | 8.7 | 6.2 | −12.8 |
|
Source: Global Trade Tracker, 2022 *CAGR: Compound Annual Growth Rate |
|||||||
Retail sales by category and distribution
Total retail sales of fish and seafood in Taiwan were US$1.6 billion in 2021, having grown from US$1.4 billion in 2017. Total retail sales grew at a CAGR of 4.2% from 2017-2021, however the 2021 figure was down from a peak of US$1.9 billion the year prior. The Taiwanese fish and seafood market saw a large year-over year increase during the first year of the pandemic, with total retail sales growing by 22.7% in 2020, before falling by 13.5% in 2021. Taiwanese fish and seafood sales are expected to grow at a CAGR of 5.0% from 2022-2026, surpassing 2020 levels in 2024, and reaching US$2.1 billion in 2026.
Fish and seafood makes up a significant portion of the Taiwanese diet, with the average person consuming 35 kilograms of fish and seafood.Footnote 1
In 2021, average consumer expenditure on fish and seafood was US$4,743.8, 11.4% of total expenditure on food. Seafood in Taiwan is available, affordable, and is perceived as healthy. There is growing concern among Taiwanese consumers, and consumers are often willing to pay a premium for foods that positively affect health or weight loss.Footnote 2 Weight loss is a subject of concern in Taiwan, where surveys have shown the country to have the highest percentage of overweight individuals in Asia.Footnote 3 There is a growing appetite for seafood products perceived as environmentally friendly, traceable, and sustainable. Organic foods are also rising in popularity. Many Taiwanese consumers also favour products that feature convenience and do not require them to cook at home.
| Category | 2017 | 2021 | CAGR* % 2017-2021 | 2022 | 2026 | CAGR* % 2022-2026 |
|---|---|---|---|---|---|---|
| Fish and Seafood | 1,380.2 | 1,629.4 | 4.2 | 1,718.6 | 2,088.0 | 5.0 |
| Crustaceans | 623.1 | 747.3 | 4.6 | 800.0 | 1,028.9 | 6.5 |
| Fish | 490.3 | 574.8 | 4.1 | 598.1 | 686.6 | 3.5 |
| Molluscs and Cephalopods | 266.9 | 307.4 | 3.6 | 320.5 | 372.5 | 3.8 |
| Processed Seafood | 135.6 | 170.1 | 5.8 | 166.0 | 214.4 | 6.6 |
| Shelf Stable Seafood | 53.6 | 62.4 | 3.9 | 61.8 | 87.8 | 9.2 |
| Chilled Processed Seafood | 69.3 | 87.8 | 6.1 | 85.0 | 100.6 | 4.3 |
| Frozen Processed Seafood | 12.8 | 19.9 | 11.7 | 19.2 | 26.0 | 7.9 |
|
Source: Euromonitor International, 2022 *CAGR: Compound Annual Growth |
||||||
In 2021, total retail sales of processed meat and seafood in Taiwan were US$668.1 million, having grown at a CAGR of 5.2% from 2017-2021. Of these sales US$170.1 million, or 25.5%, were processed seafood, having grown at a CAGR of 5.8%. Supermarkets were the leading distribution channel for processed meat and seafood, with US$282.0 million in sales, or 42.2% of the total market, and had the second fastest growth of any channel. The second largest distribution channel was e-commerce, which saw US$137.5 million in sales in 2021, and enjoyed a 20.6% market share. E-commerce was the category which enjoyed the fastest growth, having grown at a CAGR of 12.5% from 2017-2021, and was the only channel to have a faster growth rate than total processed fish and seafood sales. The e-commerce market in Taiwan is well developed, and Taiwan and has one of the highest e-commerce penetration rates in the region.Footnote 2
Mixed retailers saw US$126.1 million in sales in 2021, making up 18.9% of the market. Hypermarkets accounted for US$62.3 million in sales, or 9.3% of the market however also saw the slowest growth, having grown at a CAGR of 1.7% over the historic period. Independent small grocers saw US$24.8 million in sales (3.7% share) while convenience stores saw US$19.3 million in sales (2.9% share). Convenience stores are popular in Taiwan, and the country has one of the greatest concentrations of these outlets per resident of any country. A typical Taiwanese consumer lives within a block of a convenience store. Space is at a premium in the country, and many consumers prefer to shop repeatedly in the same week rather than devoting space in their homes to store food. Convenience stores in Taiwan offer fresh food as well as packaged in addition to other services including arranging for an overnight delivery and even the payment of college tuition.Footnote 2
| Outlet Type | 2017 | 2018 | 2019 | 2020 | 2021 | CAGR* % 2017-2021 |
|---|---|---|---|---|---|---|
| Store-Based Retailing | 460.4 | 472.0 | 492.4 | 513.0 | 530.5 | 3.6 |
| Grocery Retailers | 350.1 | 360.3 | 374.9 | 389.6 | 404.5 | 3.7 |
| Modern Grocery Retailers | 313.0 | 322.4 | 335.6 | 349.5 | 363.7 | 3.8 |
| Convenience Stores | 17.5 | 18.3 | 20.5 | 21.7 | 19.3 | 2.5 |
| Hypermarkets | 58.2 | 60.0 | 60.5 | 61.8 | 62.3 | 1.7 |
| Supermarkets | 237.3 | 244.1 | 254.7 | 266.0 | 282.0 | 4.4 |
| Traditional Grocery Retailers | 37.1 | 37.8 | 39.2 | 40.1 | 40.8 | 2.4 |
| Food/drink/tobacco specialists | ||||||
| Independent Small Grocers | 23.3 | 23.4 | 24.2 | 24.5 | 24.8 | 1.6 |
| Other Grocery Retailers | 13.8 | 14.5 | 15.0 | 15.7 | 16.0 | 3.8 |
| Mixed Retailers | 110.3 | 111.7 | 117.6 | 123.4 | 126.1 | 3.4 |
| Non-Store Retailing (E-commerce) | 85.7 | 87.9 | 94.0 | 113.1 | 137.5 | 12.5 |
| Processed Meat and Seafood (Total) | 546.1 | 559.9 | 586.4 | 626.1 | 668.1 | 5.2 |
|
Source: Euromonitor International, 2022 1: Distribution channels for fish and seafood and processed seafood not available *CAGR: Compound Annual Growth Processed meat and seafood (as defined by Euromonitor International): processed meat, processed seafood and meat substitutes (includes all types of chilled, frozen and shelf stable meat and fish substitutes such as vegetarian sausages, vegetarian burgers, bean burgers, vegetarian fish filets etc. typically made of quorn mycoprotein, tofu, soy or texturized vegetable protein). |
||||||
Competitive landscape
In 2021, brand labels dominated the Taiwanese processed seafood market, enjoying an 88.1% market share, while private labels accounted for 11.9%. For both chilled and frozen processed seafood, private labels accounted for between 17-18% of the market, however private labels accounted for just 1.8% of the shelf stable seafood market. Jaan Sheng Foods Co Ltd was the largest player in the market, accounting for 17.0% of the processed seafood market, and 33.0% of the chilled processed seafood market. Tong Yeng Industrial Co Ltd was next, with 12.1% of the processed seafood market and 32.9% of the shelf stable seafood market. Bright Food (Group) Co Ltd was the largest player in the frozen processed seafood industry, with US$6.5 million in sales, 32.7% of the market and 3.8% of the market for all processed seafood in Taiwan.
Chilled processed seafood was the largest category of processed seafood, with US$87.8 million in sales, or 51.6% of the processed seafood market. Shelf stable seafood had US$62.4 million in sales (36.7% share) while frozen processed seafood accounted for the remaining US$19.9 million (11.7%). Frozen processed seafood was the category which saw the fastest growth, having grown by a CAGR of 11.7% from 2017-2019.
| Category | Company | 2017 | 2018 | 2019 | 2020 | 2021 | CAGR* % 2017-2021 | Market share % 2021 |
|---|---|---|---|---|---|---|---|---|
| Processed Seafood | Jaan Sheng Foods Co Ltd | 30.8 | 32.4 | 33.9 | 34.8 | 29.0 | −1.5 | 17.0 |
| Tong Yeng Industrial Co Ltd | 18.3 | 18.7 | 19.5 | 20.0 | 20.5 | 2.9 | 12.1 | |
| Kikkoman Corp | 16.6 | 17.5 | 18.3 | 18.8 | 15.7 | −1.4 | 9.2 | |
| Huobao Foods Co Ltd | 9.3 | 9.5 | 9.9 | 10.1 | 10.4 | 2.8 | 6.1 | |
| Nice Group | 8.5 | 8.7 | 9.0 | 9.3 | 9.5 | 2.8 | 5.6 | |
| Private Label | 20.2 | 21.0 | 21.3 | 21.0 | 20.2 | 0.0 | 11.9 | |
| Others | 31.9 | 33.3 | 36.6 | 43.7 | 64.8 | 19.4 | 38.1 | |
| Total | 135.6 | 141.1 | 148.5 | 157.7 | 170.1 | 5.8 | 100.0 | |
| Shelf Stable Seafood | Tong Yeng Industrial Co Ltd | 18.3 | 18.7 | 19.5 | 20.0 | 20.5 | 2.9 | 32.9 |
| Huobao Foods Co Ltd | 9.3 | 9.5 | 9.9 | 10.1 | 10.4 | 2.8 | 16.7 | |
| Nice Group | 8.5 | 8.7 | 9.0 | 9.3 | 9.5 | 2.8 | 15.2 | |
| Private Label | 1.0 | 1.1 | 1.1 | 1.1 | 1.1 | 2.4 | 1.8 | |
| Others | 16.5 | 16.6 | 17.2 | 18.7 | 20.9 | 6.1 | 33.5 | |
| Total | 53.6 | 54.6 | 56.7 | 59.2 | 62.4 | 3.9 | 100.0 | |
| Chilled Processed Seafood | Jaan Sheng Foods Co Ltd | 30.8 | 32.4 | 33.9 | 34.8 | 29.0 | −1.5 | 33.0 |
| Kikkoman Corp | 16.6 | 17.5 | 18.3 | 18.8 | 15.7 | −1.4 | 17.9 | |
| Private Label | 16.5 | 17.1 | 17.0 | 16.6 | 15.7 | −1.2 | 17.9 | |
| Others | 5.3 | 5.5 | 7.0 | 11.0 | 27.4 | 50.8 | 31.2 | |
| Total | 69.3 | 72.4 | 76.2 | 81.1 | 87.8 | 6.1 | 100.0 | |
| Frozen Processed Seafood | Bright Food (Group) Co Ltd | 4.4 | 5.2 | 5.9 | 6.1 | 6.5 | 10.2 | 32.7 |
| Laurel Enterprises Corp | 1.1 | 1.1 | 1.0 | 1.2 | 1.3 | 4.3 | 6.5 | |
| I-Mei Foods Co Ltd | 0.8 | 0.9 | 1.0 | 1.1 | 1.2 | 10.7 | 6.0 | |
| Private Label | 2.6 | 2.9 | 3.2 | 3.3 | 3.4 | 6.9 | 17.1 | |
| Others | 3.9 | 4.0 | 4.5 | 5.7 | 7.5 | 17.8 | 37.7 | |
| Total | 12.8 | 14.1 | 15.6 | 17.4 | 19.9 | 11.7 | 100.0 | |
|
Source: Euromonitor International, 2022 1: Data for fish and seafood not available *CAGR: Compound Annual Growth Rate |
||||||||
| Category | Brand | 2017 | 2018 | 2019 | 2020 | 2021 | CAGR* % 2017-2021 |
|---|---|---|---|---|---|---|---|
| Processed Seafood | Jaan Sheng (Jaan Sheng Foods Co Ltd) | 22.7 | 22.9 | 22.8 | 22.1 | 17.1 | −6.8 |
| Tong Yeng (Tong Yeng Industrial Co Ltd) | 13.5 | 13.3 | 13.1 | 12.7 | 12.0 | −2.9 | |
| Kibun (Kikkoman Corp) | 12.3 | 12.4 | 12.3 | 11.9 | 9.2 | −7.0 | |
| Red Eagle (Huobao Foods Co Ltd) | 6.9 | 6.8 | 6.7 | 6.4 | 6.1 | −3.0 | |
| AGV (Nice Group) | 6.3 | 6.2 | 6.1 | 5.9 | 5.6 | −2.9 | |
| Private Label | 14.9 | 14.9 | 14.3 | 13.3 | 11.9 | −5.5 | |
| Others | 23.4 | 23.5 | 24.7 | 27.7 | 38.1 | 13.0 | |
| Total | 100.0 | 100.0 | 100.0 | 100.0 | 100.0 | 0.0 | |
| Shelf Stable Seafood | Tong Yeng (Tong Yeng Industrial Co Ltd) | 34.2 | 34.3 | 34.3 | 33.8 | 32.8 | −1.0 |
| Red Eagle (Huobao Foods Co Ltd) | 17.3 | 17.5 | 17.5 | 17.1 | 16.7 | −0.9 | |
| AGV (Nice Group) | 15.8 | 15.9 | 15.9 | 15.6 | 15.3 | −0.8 | |
| Private Label | 1.9 | 2.0 | 1.9 | 1.9 | 1.7 | −2.7 | |
| Others | 30.8 | 30.3 | 30.4 | 31.6 | 33.5 | 2.1 | |
| Total | 100.0 | 100.0 | 100.0 | 100.0 | 100.0 | 0.0 | |
| Chilled Processed Seafood | Jaan Sheng (Jaan Sheng Foods Co Ltd) | 44.5 | 44.7 | 44.5 | 42.9 | 33.1 | −7.1 |
| Kibun (Kikkoman Corp) | 24.0 | 24.1 | 24.0 | 23.1 | 17.8 | −7.2 | |
| Private Label | 23.9 | 23.6 | 22.4 | 20.4 | 17.8 | −7.1 | |
| Others | 7.6 | 7.6 | 9.1 | 13.6 | 31.3 | 42.5 | |
| Total | 100.0 | 100.0 | 100.0 | 100.0 | 100.0 | 0.0 | |
| Frozen Processed Seafood | Trident (Bright Food (Group) Co Ltd) | 34.2 | 37.3 | 37.6 | 35.4 | 32.4 | −1.3 |
| Laurel (Laurel Enterprises Corp) | 8.5 | 7.6 | 6.6 | 6.7 | 6.6 | −6.1 | |
| I-Mei (I-Mei Foods Co Ltd) | 6.3 | 6.3 | 6.2 | 6.3 | 6.2 | −0.4 | |
| Private Label | 20.2 | 20.4 | 20.3 | 19.0 | 17.3 | −3.8 | |
| Others | 30.8 | 28.4 | 29.3 | 32.6 | 37.5 | 5.0 | |
| Total | 100.0 | 100.0 | 100.0 | 100.0 | 100.0 | 0.0 | |
|
Source: Euromonitor International, 2022 1: Data for fish and seafood not available *CAGR: Compound Annual Growth Rate |
|||||||
New product launch analysis
According to Mintel's Global New Products Database (GNPD), there were 1,535 total fish and fish products as an ingredient launched in Taiwan from 2017-2021. Of those products, 1,335 were food products (87.0% of all products launched), 194 were pet products (12.6%), and 6 were beverage products (0.4%). Of these launches, 700 were new products (45.6%), 554 were new variety/range extension (36.1%), and 214 were new packaging (13.9%). Taiwanese consumers tend to favour smaller packaging, due to limited storage space.Footnote 2 Taiwanese consumers often prefer to shop regularly rather than stock up on food. Flexible was the most popular packaging type, with 655 product launches (42.7%), 169 were trays (11.0%), and 141 were flexible stand-up pouches (9.2%).
Top sub-categories from 2017-2021 included fish products with 295 products (19.2%), prepared meals with 172 products (11.2%), and instant noodles with 133 products (8.7%). Top claims included no additives or preservatives with 325 products (21.2%), and free from added/artificial preservatives with 278 products (18.1%). Microwavable products saw 225 product launches (14.7%), with many Taiwanese consumers preferring ready-to-eat foods that do not require making a homecooked meal. 316 products were imported (20.6%) while 292 were listed as not imported (19.0%). Top flavours included unflavoured/plain with 231 products (15.0%) followed by prawn/shrimp with 54 (3.5%) and fish with 41 (2.7%). Popular ingredients included shrimp with 345 products (22.5%), fish and fish products with 221 products (14.4%) and tuna products (8.5%).
| Product attributes | Yearly launch counts | Total | ||||
|---|---|---|---|---|---|---|
| 2017 | 2018 | 2019 | 2020 | 2021 | ||
| Yearly product launches | 264 | 340 | 321 | 294 | 316 | 1,535 |
| Top five sub-categories | ||||||
| Fish Products | 40 | 63 | 49 | 65 | 78 | 295 |
| Prepared Meals | 14 | 34 | 52 | 39 | 33 | 172 |
| Instant Noodles | 18 | 39 | 27 | 28 | 21 | 133 |
| Hors d'oeuvres/Canapes | 18 | 13 | 10 | 20 | 15 | 76 |
| Cat Food Wet | 12 | 20 | 11 | 10 | 21 | 74 |
| Top five claims | ||||||
| No Additives/Preservatives | 73 | 70 | 72 | 56 | 54 | 325 |
| Free from Added/Artificial Preservatives | 65 | 62 | 63 | 43 | 45 | 278 |
| Microwaveable | 20 | 58 | 52 | 54 | 41 | 225 |
| Ease of Use | 37 | 35 | 27 | 26 | 20 | 145 |
| Halal | 25 | 33 | 36 | 17 | 14 | 125 |
| Imported status | ||||||
| Imported | 44 | 69 | 84 | 57 | 62 | 316 |
| Not imported | 55 | 61 | 46 | 65 | 65 | 292 |
| Top packaged types | ||||||
| Flexible | 121 | 155 | 129 | 121 | 129 | 655 |
| Tray | 15 | 29 | 39 | 45 | 41 | 169 |
| Flexible stand-up pouch | 16 | 39 | 38 | 23 | 25 | 141 |
| Can | 27 | 30 | 19 | 18 | 30 | 124 |
| Flexible sachet | 23 | 26 | 28 | 15 | 16 | 108 |
| Top launch types | ||||||
| New Product | 124 | 161 | 145 | 136 | 134 | 700 |
| New Variety/Range Extension | 93 | 134 | 113 | 107 | 107 | 554 |
| New Packaging | 27 | 31 | 56 | 39 | 61 | 214 |
| Relaunch | 19 | 13 | 3 | 8 | 8 | 51 |
| New Formulation | 1 | 1 | 4 | 4 | 6 | 16 |
| Top five flavours (including blend) | ||||||
| Unflavoured/Plain | 28 | 52 | 37 | 49 | 65 | 231 |
| Prawn/Shrimp | 13 | 13 | 10 | 10 | 8 | 54 |
| Fish | 10 | 10 | 4 | 6 | 11 | 41 |
| Seafood | 13 | 10 | 5 | 8 | 3 | 39 |
| Tuna | 8 | 5 | 11 | 8 | 6 | 38 |
| Top five ingredients | ||||||
| Shrimp (Food) | 73 | 80 | 61 | 70 | 61 | 345 |
| Fish and Fish Products (Food) | 54 | 49 | 37 | 46 | 35 | 221 |
| Tuna (Food) | 22 | 33 | 26 | 22 | 27 | 130 |
| Bonito Extract (Food) | 15 | 16 | 20 | 24 | 26 | 101 |
| Bonito Powder (Food) | 22 | 15 | 21 | 30 | 25 | 113 |
| Source: Mintel, 2022 | ||||||
Examples of new product launches
Salt & Pepper Calamari
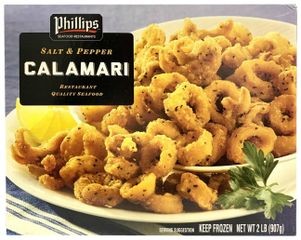
Source: Mintel, 2022
| Company | Philips Foods |
|---|---|
| Brand | Philips |
| Category | Processed fish, meat and egg |
| Sub-Category | Fish products |
| Market | Taiwan |
| Store name | Costco |
| Store type | Club Store |
| Date published | December 2021 |
| Launch type | New product |
| Price in US dollars | 19.83 |
Phillips Salt & Pepper Calamari is described as premium restaurant quality seafood. The product retails in a 907 gram recyclable pack featuring Facebook logo, recipe suggestions and cooking directions.
Frozen Cod Fillet
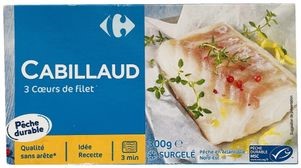
Source: Mintel, 2022
| Company | Carrefour |
|---|---|
| Brand | Carrefour |
| Category | Processed fish, meat and egg |
| Sub-Category | Fish products |
| Market | Taiwan |
| Store name | Carrefour |
| Store type | Supermarket |
| Date published | December 2021 |
| Launch type | New variety / range extension |
| Price in US dollars | 12.96 |
Carrefour Frozen Cod Fillet is now available. The microwaveable product retails in a 300 gram pack containing three units and bearing a QR code, the MSC (Marine Stewardship Council) - Certified Sustainable Seafood logo and cooking instructions.
Kanazawa Pink Shrimp Potato Chips

Source: Mintel, 2022
| Company | Koikeya |
|---|---|
| Brand | Koikeya |
| Category | Snacks |
| Sub-Category | Potato chips |
| Market | Taiwan |
| Store name | Poya Living Mart |
| Store type | Supermarket |
| Date published | December 2021 |
| Launch type | New packaging |
| Price in US dollars | 2.85 |
Koikeya Japan Pride Potato Kanazawa Pink Shrimp Potato Chips have been repackaged with a new design created by a Kanazawa College of Art students, and is available in two different designs. The potato snack contains domestically grown, GMO-free potatoes and is seasoned with pink shrimp and salt said to deliver the most delectable flavour. The product is claimed to be of premium quality, and retails in a 56 gram pack that is partly printed with biomass ink. According to the manufacturer, part of the proceeds will go to the City of Kanazawa and Kanazawa College of Art.
Stewed Beef Noodles in Clear Broth

Source: Mintel, 2022
| Company | Mala International Foods |
|---|---|
| Brand | Mala Hot Pot |
| Category | Meals and meal centres |
| Sub-Category | Instant noodles |
| Market | Taiwan |
| Store name | Carrefour |
| Store type | Supermarket |
| Date published | December 2021 |
| Launch type | New product |
| Price in US dollars | 4.66 |
Mala Hot Pot Stewed Beef Noodles in Clear Broth are now available. The ISO 22000 and HACCP certified product retails in a 540g pack including 80 gram of noodles and featuring preparation instructions.
Double Cheese Pizza Flavoured Fish Snack
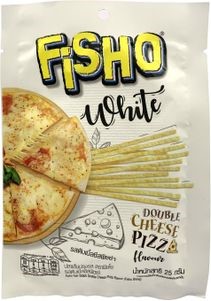
Source: Mintel, 2022
| Company | Thai Union Frozen |
|---|---|
| Brand | Fisho White |
| Category | Snacks |
| Sub-Category | Meat snacks |
| Market | Taiwan |
| Store name | 7-Eleven |
| Store type | Convenience store |
| Date published | April 2022 |
| Launch type | New product |
| Price in US dollars | 1.73 |
Fisho White Double Cheese Pizza Flavoured Fish Snack is now available. The halal certified product retails in a 25 gram pack bearing the Facebook logo.
Conclusion
In 2021, Taiwan was a net importer of fish and seafood, and the twentieth largest market in the world for imported fish and seafood. The market for fish and seafood is expected to see strong growth over the coming years. Canada is a key supplier of numerous goods. Canada was the third largest supplier of frozen halibut, and fourth largest supplier of fresh and chilled salmon, and was a major supplier of lobster.
Products that are perceived as healthier and more sustainably sourced have strong potential to succeed in the Taiwanese market. Taiwanese consumers value convenience and ease of storage. Canada's market share is relatively small, however there exists potential for Canadian exporters to find success in this market, by engaging with local stakeholders.
For more information
The Canadian Trade Commissioner Service:
International Trade Commissioners can provide Canadian industry with on-the-ground expertise regarding market potential, current conditions and local business contacts, and are an excellent point of contact for export advice.
More agri-food market intelligence:
International agri-food market intelligence
Discover global agriculture and food opportunities, the complete library of Global Analysis reports, market trends and forecasts, and information on Canada's free trade agreements.
Agri-food market intelligence service
Canadian agri-food and seafood businesses can take advantage of a customized service of reports and analysis, and join our email subscription service to have the latest reports delivered directly to their inbox.
More on Canada's agriculture and agri-food sectors:
Canada's agriculture sectors
Information on the agriculture industry by sector. Data on international markets. Initiatives to support awareness of the industry in Canada. How the department engages with the industry.
For additional information on Seafood Expo Global, please contact:
Ben Berry, Deputy Director
Trade Show Strategy and Delivery
Agriculture and agri-food Canada
ben.berry@agr.gc.ca
Resources
- British Columbia Ministry of Agriculture. Market Guide for B.C. Agrifood and Seafood Exporters
- Euromonitor International, 2022
- Global Trade Tracker, 2022
- Mintel Global New Products Database, 2022
- Taiwan News. Taiwan remains most overweight Asian country despite increase in exercise, June 2019.
- United States Department of Agriculture. Taiwan - Seafood Market Presents Niche and High Value Opportunities, March 2021.
Sector Trend Analysis – Fish and seafood trends in Taiwan
Global Analysis Report
Prepared by: Brendan Dwyer, Student
© Her Majesty the Queen in Right of Canada, represented by the Minister of Agriculture and Agri-Food (2022).
Photo credits
All photographs reproduced in this publication are used by permission of the rights holders.
All images, unless otherwise noted, are copyright Her Majesty the Queen in Right of Canada.
To join our distribution list or to suggest additional report topics or markets, please contact:
Agriculture and Agri-Food Canada, Global Analysis1341 Baseline Rd, Tower 5, 3rd floor
Ottawa ON K1A 0C5
Canada
Email: aafc.mas-sam.aac@agr.gc.ca
The Government of Canada has prepared this report based on primary and secondary sources of information. Although every effort has been made to ensure that the information is accurate, Agriculture and Agri-Food Canada (AAFC) assumes no liability for any actions taken based on the information contained herein.
Reproduction or redistribution of this document, in whole or in part, must include acknowledgement of agriculture and agri-food Canada as the owner of the copyright in the document, through a reference citing AAFC, the title of the document and the year. Where the reproduction or redistribution includes data from this document, it must also include an acknowledgement of the specific data source(s), as noted in this document.
Agriculture and Agri-Food Canada provides this document and other report services to agriculture and food industry clients free of charge.