

Note: This report includes forecasting data that is based on baseline historical data.
Executive summary
The United Arab Emirates (UAE) is a federation comprising of seven emirates, Abu Dhabi, Dubai, Sharjah, Ajman, Umm Al-Quwain, Fujairah and Ras Al Khaimah, located in the Arabian Peninsula. The country had a population of 9.9 million and almost 90% of the Emirati population consist of immigrants. Dubai and Abu Dhabi are known international trading hubs and global cities.
The UAE is the second-largest economy of the Gulf Council Cooperation (GCC) after Saudi Arabia. In 2020, the country had a gross domestic product (GDP) of US$358.8 billion. The economy of the UAE is heavily dependent on oil exports, which account for 30% of its economy. It is worth noting that the economy was dependent of fishing before oil was discovered in the country. In 2019, the value added of agriculture, forestry, and fishing represented less than 1% of the UAE's GDP according to the World Bank.
The UAE is a net importer of fish and seafood and the country imports up to 90% of its food consumption. In 2020, the UAE's imports of fish and seafood from the world were valued at US$637.0 million while exports were valued at US$331.6 million. From 2016 to 2020 imports declined by a compound annual growth rate of −0.4%. The top suppliers in 2020 were India with a 27.7% market share, Thailand (9.8%) and Viet-Nam (7.8%). Canada ranked 32nd among UAE supplying countries with US$1.9 million, representing a market share of 0.3%.
Top commodities were frozen shrimps and prawns, prepared/preserved tunas, skipjack and atlantic bonito, fresh/chilled atlantic salmon and danube salmon, fresh/chilled atlantic salmon and danube salmon and frozen fish, not else specified (n.e.s.).
Market trends
Emiratis are the biggest consumers of fish and fish products among the Gulf Council Cooperation (GCC) countries. A growing population, with diverse background, high income and an increasing appetite for fish is driving the demand for fish and seafood products as well as local production. This has led to investments in the UAE's fishing industry and its aquaculture production. Rapid urbanization, rising disposable income and protein-preferring youth coupled with tourist visits are forecast to support the growing consumption of fish and seafood. Although the pandemic contributed to reducing arrival of international tourists, authorities hope that the Expo Dubai 2020 will help ease the adverse impact the pandemic had on the tourism industry. Expo Dubai 2020 is expected to attract more than 25 million visits and generate $33 billion in economic activity (United States Department of Agriculture (USDA), 2021). The UAE consumes more than 220,000 tonnes of fish per year and it has a seafood consumption per capita of 28.6 kg/year, which is higher than the global average (Food and Agriculture Organization of the United Nations (FAO), 2021).
Almost 90% of the Emirati population consist of immigrants and fish and seafood products are integral part of traditional meals in the countries of origin of these migrants. Moreover, a study show that online searches for seafood products soared in recent years, placing seafood among the fastest growing protein being searched in the GCC countries. Between 2015 and 2018, online searches for seafood increased by 170% in the UAE. Fish and seafood products are viewed as healthy and people are reducing their consumption of meat. The UAE is by the way one of the top destinations for premium seafood and demand for lobsters, scallops, and other high-quality fish is on the rise.
From 2016 to 2020, per capita consumer expenditure on fish and seafood increased by 2.7%, a slightly higher growth over consumer expenditure on meat. Per capita consumer expenditure on meat remains dominant. In 2020, consumer expenditure on meat was valued at US$459.8, against US$180.0. From 2021 to 2025 per capita consumer expenditure on fish and seafood is forecast to grow by 3.1% and reach US$201.9.
| Category | 2016 | 2020 | CAGR* % 2016-2020 | 2021 | 2025 | CAGR* % 2021-2025 |
|---|---|---|---|---|---|---|
| Meat | 415.2 | 459.8 | 2.6 | 457.0 | 512.5 | 2.9 |
| Fish and seafood | 161.9 | 180.0 | 2.7 | 179.0 | 201.9 | 3.1 |
|
Source: Euromonitor International, 2021 *CAGR: Compound Annual Growth Rate |
||||||
Trade overview
The UAE is a net importer of agri-food and seafood products. The country imports 75% of its annual fish consumption while aquaculture provides 2% of total fish consumption (FAO, 2021). The country also imports 90% of its food consumption and is an important market for re-export for other GCC countries. In 2020, the UAE's imports of fish and seafood from the world were valued at US$637.0 million while its exports were valued at US$331.6 million. From 2016 to 2020, imports of fish and seafood declined by a CAGR of 0.4%. India was the main supplier of fish and seafood to the UAE, holding a market share of 27.7% and with imports valued at US$176.2 million. India is followed by Thailand (US$62.3 million) and Viet-Nam (US$49.8 million) with respective market shares of 9.8% and 7.8%. Among the top 10 suppliers, imports from Ecuador (CAGR of 147.7%), Greece (CAGR of 83.9%) and Spain noticeably grew during the 2016-2020 period.
In 2020, frozen shrimps and prawns were the leading seafood and fish product imported in the UAE, with imports valued at US$192.6 million, followed by prepared/preserved tunas, skipjack and atlantic bonito (US$63.4 million) and fresh/chilled atlantic salmon and danube salmon (US$44.3 million). Among the top 10 fish and seafood products imported by the UAE, prepared/preserved shrimps and prawns recorded the largest growth from 2016 to 2020, with a CAGR of 101.6%, followed by frozen fish, n.e.s. (5.3%), whereas live/fresh/chilled shrimps and prawns grew by 186.8% from 2017 to 2020.
To reduce its dependency on fish imports and ensure food security, the UAE government is focusing on increasing production in the aquaculture sector and foster a climate that supports local production. For example, it has established the Sheikh Khalifa Marine Research Center whose hatchery has the capacity to produce nearly 30 million fish fingerlings per year in two stages (Ministry of Climate Change and Environment, 2021). In 2018, the UAE launched its National Food Security Strategy and fish was identified as one of the strategic food items. For this, the government plan to invest in research and development to increase the efficiency of local food production to meet the need of a growing population. There are about a dozen of aquaculture farms registered with the Ministry that produced 3,223 tons of fish in 2019, representing one percent of domestic consumption (Ministry of Climate Change and Environment, 2020). The government is also encouraging local and foreign investments in aquaculture projects by creating incentives for the sector, which include among others, the relaxing of institutional and investment constraints and mapping out suitable sites for development (FAO).
| Country | 2016 | 2017 | 2018 | 2019 | 2020 | CAGR* % 2016-2020 | Market share % 2020 |
|---|---|---|---|---|---|---|---|
| World | 647.3 | 698.4 | 715.3 | 669.8 | 637.0 | −0.4 | 100.0 |
| India | 162.7 | 186.4 | 191.1 | 195.5 | 176.2 | 2.0 | 27.7 |
| Thailand | 63.2 | 85.5 | 70.3 | 69.3 | 62.3 | −0.4 | 9.8 |
| Viet-Nam | 50.5 | 45.1 | 72.8 | 57.2 | 49.8 | −0.4 | 7.8 |
| Norway | 49.5 | 52.8 | 54.5 | 56.0 | 45.3 | −2.2 | 7.1 |
| China | 33.7 | 43.6 | 50.3 | 44.0 | 42.6 | 6.0 | 6.7 |
| Pakistan | 42.5 | 34.2 | 28.2 | 33.0 | 40.3 | −1.3 | 6.3 |
| Greece | 2.0 | 2.6 | 2.2 | 1.5 | 22.9 | 83.9 | 3.6 |
| Turkey | 15.1 | 12.3 | 15.5 | 17.7 | 20.3 | 7.6 | 3.2 |
| Ecuador | 0.5 | 1.2 | 0.5 | 1.1 | 18.0 | 147.7 | 2.8 |
| Spain | 3.0 | 2.6 | 3.3 | 4.2 | 14.8 | 48.6 | 2.3 |
|
Source: Global Trade Tracker, 2021 *CAGR - Compound Annual Growth Rate |
|||||||
| HS Code | Description | 2016 | 2017 | 2018 | 2019 | 2020 | CAGR* % 2016-2020 |
|---|---|---|---|---|---|---|---|
| Total - Fish and Seafood | 647.3 | 698.4 | 715.3 | 669.8 | 637.0 | −0.4 | |
| 030617 | Frozen shrimps and prawns | 199.5 | 223.2 | 238.8 | 216.0 | 192.6 | −0.9 |
| 160414 | Prepared or preserved tunas, skipjack and atlantic bonito (excluding minced) | 68.3 | 92.9 | 74.7 | 75.3 | 63.4 | −1.9 |
| 030214 | Fresh or chilled atlantic salmon and danube salmon | 49.5 | 50.7 | 52.0 | 53.2 | 44.3 | −2.7 |
| 160529 | Shrimps and prawns, prepared or preserved, in airtight containers (excluding smoked) | 1.9 | 2.7 | 22.0 | 16.3 | 31.9 | 101.6 |
| 030389 | Frozen fish, n.e.s.[1] | 23.5 | 28.6 | 17.6 | 17.5 | 28.9 | 5.3 |
| 030462 | Frozen fillets of catfish | 25.4 | 22.4 | 47.2 | 34.5 | 24.4 | −1.0 |
| 030743 | Cuttle fish and squid, frozen | 14.6 | 19.4 | 18.1 | 15.3 | 1.5 (2017-2020) | |
| 030636 | Shrimps and prawns, live, fresh or chilled (excluding cold-water shrimps and prawns) | 0.6 | 3.3 | 10.7 | 15.2 | 186.8 (2017-2020) | |
| 030285 | Fresh or chilled sea bream | 11.4 | 10.0 | 15.6 | 13.2 | 11.4 | 0.1 |
| 030499 | Frozen fish meat n.e.s.[1] (excluding fillets) | 10.1 | 10.9 | 1.6 | 0.7 | 10.2 | 0.2 |
|
Source: Global Trade Tracker, 2021 *CAGR: Compound Annual Growth Rate 1.: Not else specified |
|||||||
Top five global suppliers of fish and seafood to the United Arab Emirates, by top three products, in US$ million, historical
| HS Code | Description | 2016 | 2017 | 2018 | 2019 | 2020 | CAGR* % 2016-2020 |
|---|---|---|---|---|---|---|---|
| Total - Fish and seafood | 162.7 | 186.4 | 191.1 | 195.5 | 176.2 | 2.0 | |
| 030617 | Frozen shrimps and prawns | 129.6 | 152.8 | 168.6 | 160.6 | 137.7 | 1.5 |
| 030636 | Shrimps and prawns, live, fresh or chilled (excluding cold-water shrimps and prawns) | 0.6 | 0.8 | 10.6 | 13.5 | 185.2 (2017-2020) | |
| 030743 | Cuttle fish and squid, frozen | 2.1 | 6.4 | 5.3 | 5.2 | 35.2 (2017-2020) | |
|
Source: Global Trade Tracker, 2021 *CAGR - Compound Annual Growth Rate |
|||||||
| HS Code | Description | 2016 | 2017 | 2018 | 2019 | 2020 | CAGR* % 2016-2020 |
|---|---|---|---|---|---|---|---|
| Total - Fish and seafood | 63.2 | 85.5 | 70.3 | 69.3 | 62.3 | −0.4 | |
| 160414 | Prepared or preserved tunas, skipjack and atlantic bonito (excluding minced) | 57.5 | 76.0 | 60.7 | 61.5 | 49.0 | −3.9 |
| 030325 | Frozen carp | 0.4 | 3.0 | 2.4 | 2.6 | 5.1 | 88.7 |
| 030493 | Frozen meat of tilapia (excluding fillets) | 0.0 | 0.0 | 0.0 | 1.6 | 276.0 | |
|
Source: Global Trade Tracker, 2021 *CAGR - Compound Annual Growth Rate |
|||||||
| HS Code | Description | 2016 | 2017 | 2018 | 2019 | 2020 | CAGR* % 2016-2020 |
|---|---|---|---|---|---|---|---|
| Total - Fish and seafood | 50.5 | 45.1 | 72.8 | 57.2 | 49.8 | −0.4 | |
| 030462 | Frozen fillets of catfish | 25.4 | 22.3 | 46.3 | 33.9 | 23.9 | −1.5 |
| 160529 | Shrimps and prawns, prepared or preserved, in airtight containers (excluding smoked) | 1.0 | 1.2 | 2.2 | 1.3 | 9.8 | 76.9 |
| 030617 | frozen shrimps and prawns (excluding cold-water shrimps and prawns) | 18.7 | 16.2 | 19.0 | 16.8 | 9.3 | −16.0 |
|
Source: Global Trade Tracker, 2021 *CAGR - Compound Annual Growth Rate |
|||||||
| HS Code | Description | 2016 | 2017 | 2018 | 2019 | 2020 | CAGR* % 2016-2020 |
|---|---|---|---|---|---|---|---|
| Total - Fish and seafood | 49.5 | 52.8 | 54.5 | 56.0 | 45.3 | −2.2 | |
| 030214 | Fresh or chilled atlantic salmon and danube salmon | 43.0 | 45.6 | 47.3 | 45.8 | 39.0 | −2.4 |
| 030441 | Fresh or chilled fillets of pacific salmon, atlantic salmon and danube salmon | 0.3 | 0.0 | 0.1 | 0.4 | 1.4 | 47.6 |
| 030313 | Frozen, atlantic salmon and danube salmon | 0.9 | 1.8 | 1.5 | 4.0 | 1.3 | 9.2 |
|
Source: Global Trade Tracker, 2021 *CAGR - Compound Annual Growth Rate |
|||||||
| HS Code | Description | 2016 | 2017 | 2018 | 2019 | 2020 | CAGR* % 2016-2020 |
|---|---|---|---|---|---|---|---|
| Total - Fish and seafood | 33.7 | 43.6 | 50.3 | 44.0 | 42.6 | 6.0 | |
| 160529 | Shrimps and prawns, prepared or preserved, in airtight containers (excluding smoked) | 18.8 | 14.0 | 19.2 | 1.0 (2018-2020) | ||
| 030743 | Cuttle fish and squid, frozen | 11.5 | 11.5 | 11.2 | 6.9 | −15.8 (2017-2020) | |
| 160521 | Shrimps and prawns, prepared or preserved, not in airtight containers (excluding smoked) | 1.7 | 0.8 | 5.8 | 82.8 (2017-2020) | ||
|
Source: Global Trade Tracker, 2021 *CAGR - Compound Annual Growth Rate |
|||||||
Canada's performance
In 2020, Canada ranked 32nd among the UAE's supplier of fish and seafood, with imports valued at US$1.9 million or market share of 0.3%. Frozen lobsters were the leading fish and seafood products that the UAE imported from Canada with US$0.7 million, followed by live/fresh/chilled lobsters (US$0.4 million) and ambergris (US$0.2 million). From 2016 to 2020, UAE's imports of Canadian fish and seafood decreased by a CAGR of −7.0%. Conversely, exports increased by 12.9% in terms of quantity over this period, from 136 MT in 2016 to 221 MT in 2020. Additionally, the unit value of Canadian fish and seafood exports decreased by CAGR of −17.5% from 2016 to 2020.
| HS Code | Description | 2016 | 2017 | 2018 | 2019 | 2020 | CAGR* % 2016-2020 |
|---|---|---|---|---|---|---|---|
| Total - Fish and seafood | 2.6 | 3.1 | 2.8 | 2.5 | 1.9 | −7.0 | |
| 030612 | Frozen lobsters | 1.2 | 0.9 | 0.5 | 0.4 | 0.7 | −12.2 |
| 030632 | Lobsters, live, fresh or chilled | 1.9 | 1.1 | 0.9 | 0.4 | −38.3 (2017-2020) | |
| 051000 | Ambergris, castoreum, civet and musk; cantharides; bile; glands and other animal products used in the preparation of pharmaceutical products, fresh, chilled, frozen or otherwise provisionally preserved | 0.0 | 0.0 | 0.1 | 0.1 | 0.2 | 96.1 |
| 030359 | Frozen anchovies, indian mackerels, seerfishes, jacks, crevalles, silver pomfrets, pacific saury, scads, capelin, kawakawa, bonitos, marlins, sailfishes and spearfish | 0.1 | 0.0 | 0.1 | 0.2 | 41.6 (2017-2020) | |
| 030213 | Fresh or chilled pacific salmon | 0.0 | 0.1 | 186.5 (2019-2020) | |||
|
Source: Global Trade Tracker, 2021 *CAGR: Compound Annual Growth Rate |
|||||||
| Year | Value US$ in million | Volume metric tonnes | Unit value US$/mt |
|---|---|---|---|
| 2016 | 2.6 | 136 | 18,731 |
| 2017 | 3.1 | 208 | 14,921 |
| 2018 | 2.8 | 326 | 8,687 |
| 2019 | 2.5 | 279 | 9,054 |
| 2020 | 1.9 | 221 | 8,684 |
| CAGR* % 2016-2020 | −7.0 | 12.9 | −17.5 |
|
Source: Global Trade Tracker, 2021 *CAGR: Compound Annual Growth Rate |
|||
Retail sales
In 2020, retail sales of fish and seafood in the UAE were valued at US$638.7 million (201.6 thousand tonnes), up from US$512.1 (199.8 thousand tonnes) in 2016, representing an increase of 5.7% of this period. Fish was the leading subcategory in terms of sales in 2020 with US$526.4 million (183.1 thousand tonnes), followed by crustaceans (US$94.5 million/14.8 thousand tonnes) and molluscs and cephalopods (US$17.8 million/3.7 thousand tonnes). Within the fish and seafood category, molluscs and cephalopods is the subcategory that grew the most from 2016 to 2020 with a CAGR of 7.5%. However, crustaceans are forecast to lead the way during the 2021-2025 period with a CAGR of 30% during this period. Sales of fish and seafood are forecast to register a CAGR of 26.3% from 2021 to 2025 and reach US$840.5 million (245.4 thousand tonnes) in sales in 2025. Retail sales of processed seafood were valued at US$104.4 million (8.4 thousand tonnes) in 2020. Shelf stable seafood led the way in terms of sales with US$71.4 million(6.6 thousand tonnes), followed by chilled processed seafood (US$20.8 million/0.6 thousand tonnes) and frozen processed seafood (US$12.2 million/1.2 thousand tonnes). From 2016 to 2020, retail sales of processed seafood increased by a CAGR of 7.3%. Shelf stable seafood was the leading subcategory during this period with a CAGR of 7.6%. Retail sales of processed seafood are forecast to increase by a CAGR of 28.5% from 2021 to 2025 while chilled processed seafood are forecast to lead the way in terms of growth during this period with a CAGR of 32.2%.
Covid-19 lockdowns pushed consumers to have increased interest in frozen fish and seafood as these products can be stored at home for a long period to reduce frequency of visits to retail outlets. The convenience of frozen fish and seafood will encourage consumers to increasingly prefer this segment over non-frozen options even after the pandemic. Sales of fish and seafood suffered from the closing of foodservice outlets as sales in hotels and restaurants make up a large share of sales in the UAE. Interestingly, demand for organic fish and seafood is on the rise supported by immigrants with high income and the increased awareness of consumers to buy from sustainable fisheries (Euromonitor International, 2021).
| Category | 2016 | 2020 | CAGR* % 2016-2020 | 2021 | 2025 | CAGR* % 2021-2025 |
|---|---|---|---|---|---|---|
| Fish and seafood | 512.1 | 638.7 | 5.7 | 665.6 | 840.5 | 26.3 |
| Fish | 426.7 | 526.4 | 5.4 | 549.4 | 689.6 | 25.5 |
| Crustaceans | 72.1 | 94.5 | 7.0 | 97.3 | 126.5 | 30.0 |
| Molluscs and cephalopods | 13.3 | 17.8 | 7.5 | 18.9 | 24.4 | 29.2 |
| Processed seafood | 78.7 | 104.4 | 7.3 | 100.7 | 129.5 | 28.5 |
| Shelf stable seafood | 53.3 | 71.4 | 7.6 | 66.1 | 85.0 | 28.6 |
| Chilled processed seafood | 16.0 | 20.8 | 6.8 | 22.4 | 29.6 | 32.2 |
| Frozen processed seafood | 9.3 | 12.2 | 6.8 | 12.2 | 14.9 | 21.6 |
|
Source: Euromonitor International, 2021 *CAGR: Compound Annual Growth Rate |
||||||
| Category | 2016 | 2020 | CAGR* % 2016-2020 | 2021 | 2025 | CAGR* % 2021-2025 |
|---|---|---|---|---|---|---|
| Fish and Seafood | 199.8 | 201.6 | 0.2 | 210.7 | 245.4 | 3.9 |
| Fish | 182.7 | 183.1 | 0.0 | 191.8 | 222.6 | 3.8 |
| Crustaceans | 13.5 | 14.8 | 2.2 | 15.0 | 18.0 | 4.6 |
| Molluscs and cephalopods | 3.5 | 3.7 | 1.7 | 3.9 | 4.8 | 5.5 |
| Processed seafood | 7.3 | 8.4 | 3.4 | 8.3 | 9.7 | 4.0 |
| Shelf stable seafood | 5.8 | 6.6 | 3.2 | 6.4 | 7.5 | 4.1 |
| Frozen processed seafood | 1.0 | 1.2 | 4.0 | 1.2 | 1.4 | 2.6 |
| Chilled processed seafood | 0.5 | 0.6 | 4.4 | 0.6 | 0.8 | 5.6 |
|
Source: Euromonitor International, 2021 *CAGR: Compound Annual Growth Rate |
||||||
Competitive landscape
In 2020, the top 10 processed fish and seafood companies in the UAE accounted for 65.6% of the market. Basamh Marketing Co, Americana Group and Century Pacific Food Inc were the top three companies in 2020. Global Food Industries UAE saw the largest growth in terms of sales with 17.4%, from US$1.2 million in 2016 to US$2.4 million in 2020.
| Company Name | 2016 | 2017 | 2018 | 2019 | 2020 | CAGR* % 2016-2020 | Market share % 2020 |
|---|---|---|---|---|---|---|---|
| Basamh Marketing Co | 14.5 | 15.3 | 16.7 | 17.6 | 19.2 | 7.3 | 18.4 |
| Americana Group | 10.1 | 10.6 | 11.6 | 12.2 | 13.4 | 7.2 | 12.8 |
| Century Pacific Food Inc | 7.6 | 8.0 | 8.8 | 9.2 | 10.1 | 7.4 | 9.7 |
| Bolton Group, The | 4.9 | 6.6 | 7.3 | 7.7 | 8.4 | 14.2 | 8.1 |
| Thai Union Frozen Products PCL | 6.2 | 6.6 | 7.2 | 7.6 | 8.3 | 7.7 | 7.9 |
| Global Food Industries UAE | 1.2 | 1.6 | 1.8 | 2.1 | 2.4 | 17.4 | 2.3 |
| C-Food International Sal | 1.4 | 1.5 | 1.6 | 1.7 | 1.9 | 8.1 | 1.9 |
| Uhrenholt A/S | 1.2 | 1.4 | 1.6 | 1.6 | 1.8 | 10.1 | 1.7 |
| Freshly Frozen Foods LLC | 1.0 | 1.1 | 1.4 | 1.5 | 1.7 | 15.6 | 1.6 |
| Nomad Foods Ltd | 1.0 | 1.0 | 1.0 | 1.1 | 1.2 | 4.5 | 1.2 |
| Others | 29.5 | 31.7 | 32.3 | 32.9 | 35.9 | 5.0 | 34.4 |
| Total | 78.7 | 85.3 | 91.0 | 95.1 | 104.4 | 7.3 | 100.0 |
|
Source: Euromonitor International, 2021 *CAGR: Compound Annual Growth Rate |
|||||||
New product launch analysis
According to Mintel's Global New Products Database (GNPD), there were 83 launches of processed fish products in the UAE between 2016 and 2020. In 2020, the top claims (may contain more than one claim per package) were ethical-animal, premium, ethical - environmentally friendly product and social media. New variety/range extension was the leading launch type, followed by new product, new packaging and new formulation. The top five brands were California Garden, Siblou, Al Alali, Freshly Foods and LuLu. The top flavours were unflavoured/plain, smoke, florentine, tomato and paprika/sweet paprika.
| Product attributes | Yearly launch count | ||||
|---|---|---|---|---|---|
| 2016 | 2017 | 2018 | 2019 | 2020 | |
| Yearly product launches | 9 | 14 | 18 | 18 | 24 |
| Top five price groups in US$ | |||||
| US$0.68 - 4.67 | 5 | 10 | 7 | 9 | 11 |
| US$4.68 - 8.67 | 3 | 2 | 6 | 5 | 6 |
| US$12.68 - 16.67 | 0 | 0 | 1 | 2 | 3 |
| US$16.68 - 24.00 | 0 | 1 | 1 | 0 | 3 |
| US$8.68 - 12.67 | 1 | 0 | 1 | 1 | 1 |
| Top five claim | |||||
| Not specified | 3 | 8 | 10 | 3 | 6 |
| Ethical - animal | 1 | 2 | 3 | 5 | 3 |
| Premium | 1 | 1 | 2 | 3 | 6 |
| Ethical - environmentally friendly product | 2 | 0 | 0 | 5 | 6 |
| Social media | 1 | 2 | 4 | 3 | 3 |
| Import status | |||||
| Imported | 5 | 8 | 8 | 7 | 7 |
| Not imported | 0 | 2 | 4 | 3 | 4 |
| Top five brands | |||||
| California Garden | 1 | 5 | 1 | 2 | 1 |
| Siblou | 2 | 0 | 2 | 2 | 1 |
| Al Alali | 1 | 1 | 1 | 3 | 0 |
| Freshly Foods | 0 | 1 | 3 | 0 | 2 |
| LuLu | 0 | 1 | 2 | 1 | 2 |
| Top launch types | |||||
| New variety/range extension | 3 | 7 | 9 | 9 | 8 |
| New product | 4 | 7 | 5 | 4 | 12 |
| New packaging | 2 | 0 | 4 | 4 | 4 |
| New formulation | 0 | 0 | 0 | 1 | 0 |
| Top five flavours | |||||
| Unflavoured/Plain | 8 | 14 | 17 | 16 | 21 |
| Smoke | 0 | 0 | 0 | 0 | 2 |
| Florentine | 0 | 0 | 0 | 1 | 0 |
| Tomato | 1 | 0 | 0 | 0 | 0 |
| Paprika/sweet paprika | 0 | 0 | 0 | 1 | 0 |
| Top store type | |||||
| Mass merchandise/hypermarket | 1 | 7 | 12 | 7 | 15 |
| Supermarket | 8 | 7 | 6 | 8 | 8 |
| Department store | 0 | 0 | 0 | 3 | 1 |
| Source: Mintel, 2021 | |||||
Examples of new product launches
Large Raw Canadian Scallops

Source: Mintel, 2021
| Company | Sainsbury's |
|---|---|
| Brand | Sainsbury's Taste the Difference |
| Category | Processed fish, meat and egg products |
| Sub-category | Fish products |
| Store name | Kibson |
| Store type | Supermarket |
| Date published | November 2020 |
| Launch type | New product |
| Price in US dollars | 18.31 |
Sainsbury's Taste the Difference Large Raw Canadian Scallops comprise individually quick frozen sea caught scallops that are responsibly sourced in the North West Atlantic. They are described as plump and sweet with a meltingly tender texture. The premium product can be cooked in five to six minutes, and retails in a 200 gram pack bearing the MSC logo and a QR code.
Ingredients (on pack): scallop (placopecten magellanicus) (contains mollusc)
Salmon Burger

Source: Mintel, 2021
| Company | Culimer |
|---|---|
| Brand | Culimer |
| Category | Processed fish, meat and egg products |
| Sub-category | Fish products |
| Store name | Kibson |
| Store type | Supermarket |
| Date published | December 2020 |
| Product source | Shopper |
| Launch type | New product |
| Price in US dollars | 7.08 |
Culimer Salmon Burger comprises frozen natural salmon burger and cheese. The fully-cook product is said to be 100% natural, safe, and sustainable. It is free from gluten, and retails in a 200 gram pack, bearing ASC (Aquaculture Stewardship Council) Responsible Aquaculture Certified logo.
Ingredients (on pack): Norwegian farmed salmon, milk, cheese (pasteurised milk, acid cultures, salt, microbial rennet), potato starch, cream powder, salt
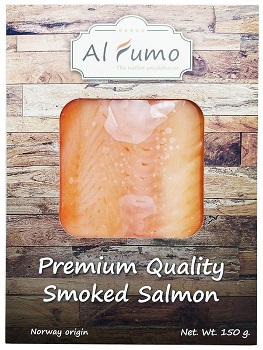
Premium Quality Smoked Salmon
Source: Mintel, 2021
| Company | Al Fumo Foods |
|---|---|
| Brand | Al Fumo |
| Category | Processed fish, meat and egg products |
| Sub-category | Fish products |
| Store name | Carrefour |
| Store type | Supermarket |
| Date published | December 2020 |
| Launch type | New product |
| Price in US dollars | 7.34 |
According to the manufacturer, the 100% natural product is cured and smoked without chemical additives or colorants. It retails in a 150 gram pack, bearing Facebook and Instagram logos.
Ingredients (on pack): smoked salmon, salt (3%), natural selected herbs, maple syrup, condiments
Cod Fillets

Source: Mintel, 2021
| Company | Waitrose |
|---|---|
| Brand | Waitrose Frozen |
| Category | Processed fish, meat and egg products |
| Sub-category | Fish products |
| Store name | Spinneys |
| Store type | Supermarket |
| Date published | September 2020 |
| Launch type | New product |
| Price in US dollars | 19.26 |
Waitrose Frozen Cod Fillets comprises boneless, frozen, skin-on cod fillets, said to be low in fat and salt while being high in protein. The product retails in a 280 gram recyclable pack containing two units and bearing the MSC logo.
Ingredients (on pack): cod (Gadus morhua) (fish)
Albacore Tuna Solid Pack in Water

Source: Mintel, 2021
| Company | Majid Al Futtaim Hypermarkets |
|---|---|
| Manufacture | Thai Union Manufacturing |
| Brand | Carrefour Selection |
| Category | Processed fish, meat and egg products |
| Sub-category | Fish products |
| Import status | Imported product (from Thailand) |
| Store name | Carrefour |
| Store type | Supermarket |
| Date published | September 2020 |
| Launch type | New variety / range extension |
| Price in US dollars | 2.36 |
Carrefour Selection Albacore Tuna Solid Pack in Water is now available. This product retails in a 185 gram pack with a 140 gram drained weight.
Ingredients (on pack): albacore tuna, water, salt, sequestering agent (E450(i))
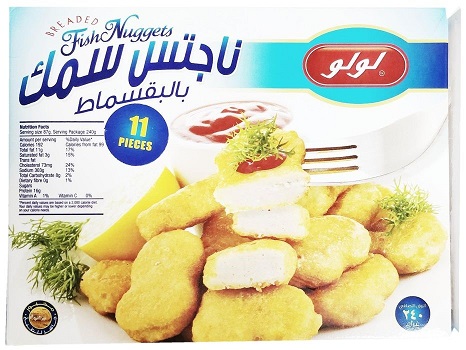
Breaded Fish Nuggets
Source: Mintel, 2021
| Company | LuLu |
|---|---|
| Manufacture | Alliance Foods Company |
| Brand | LuLu |
| Category | Processed fish, meat and egg products |
| Sub-category | Fish products |
| Store name | Lulu Hypermarket |
| Store type | Mass merchandise / hypermarket |
| Date published | June 2020 |
| Launch type | New variety / range extension |
| Price in US dollars | 3.73 |
LuLu Breaded Fish Nuggets are now available. The ready to cook product retails in a 240 gram pack, comprising 11 pieces, and bearing cooking instruction.
Ingredients (on pack): fish meat, wheat flour, bread crumbs, spice blend, salt, water, emulsifier (E451), flavour enhancer (E621)
Squid Rings

Source: Mintel, 2021
| Company | Al Islami Food |
|---|---|
| Manufacture | Alliance Foods Company |
| Brand | Al Islami Delicious |
| Category | Processed fish, meat and egg products |
| Sub-category | Fish products |
| Store name | Carrefour |
| Store type | Supermarket |
| Date published | March 2020 |
| Launch type | New variety / range extension |
| Price in US dollars | 5.83 |
Al Islami Delicious Squid Rings are now available. The product retails in a 500 gram pack, bearing Facebook and Twitter logos, a recipe recommendation and a QR code.
Ingredients (on pack): squid rings, water, salt
Crispy Breaded Shrimps

Source: Mintel, 2021
| Company | Siblou |
|---|---|
| Brand | Siblou |
| Category | Processed fish, meat and egg products |
| Sub-category | Fish products |
| Store name | Lulu Hypermarket |
| Store type | Mass merchandise / hypermarket |
| Date published | January 2020 |
| Launch type | New packaging |
| Price in US dollars | 4.43 |
Siblou Crispy Breaded Shrimps have been repackaged. This deep-frozen, deveined and tail-off product retails in a newly designed 250 gram pack bearing preparation instructions.
Ingredients (on pack): shrimps (penaeus vannamei farmed in vietnam) (55%), wheat flour, modified starch (E1420), starch, palm oil, salt, thickening agent (guar gum E412), lutein (E161b), yeast, sugar, perilla oil, emulsifier (E471)
Wild Pacific Pink Salmon

Source: Mintel, 2021
| Company | John West Foods |
|---|---|
| Brand | John West |
| Category | Processed fish, meat and egg products |
| Sub-category | Fish products |
| Store name | Lulu Hypermarket |
| Store type | Mass merchandise / hypermarket |
| Date published | January 2020 |
| Launch type | New variety / range extension |
| Price in US dollars | 3.74 |
John West Wild Pacific Pink Salmon is described as a pure, wild and fresh salmon caught in the coastal waters of Alaska and Canada. It is rich in omega 3, and retails in a 105 gram pack featuring MSC (Marine Stewardship Council) - Certified Sustainable Seafood and Heart UK Approved logos.
Ingredients (on pack): pink salmon (99%), salt
For more information
The Canadian Trade Commissioner Service:
International Trade Commissioners can provide Canadian industry with on-the-ground expertise regarding market potential, current conditions and local business contacts, and are an excellent point of contact for export advice.
More agri-food market intelligence:
International agri-food market intelligence
Discover global agriculture and food opportunities, the complete library of Global Analysis reports, market trends and forecasts, and information on Canada's free trade agreements.
Agri-food market intelligence service
Canadian agri-food and seafood businesses can take advantage of a customized service of reports and analysis, and join our email subscription service to have the latest reports delivered directly to their inbox.
More on Canada's agriculture and agri-food sectors:
Canada's agriculture sectors
Information on the agriculture industry by sector. Data on international markets. Initiatives to support awareness of the industry in Canada. How the department engages with the industry.
For additional information on Gulfood, please contact:
Ben Berry, Deputy Director
Trade Show Strategy and Delivery
Agriculture and agri-food Canada
ben.berry@agr.gc.ca
Resources
- BBC. (August 31, 2020). United Arab Emirates country profile
- BNN Bloomberg. (October 19, 2021). Dubai’s Tourism Sector Won’t Rebound Until Late 2022, S&P Says
- CGTN. (October 10, 2018). Appetite for seafood grows in Gulf Arab region
- Embassy of the United Arab Emirates. About the UAE - UAE Economy
- Euromonitor International. 2021
- Euromonitor Internation. (January 2021). Fish and Seafood in the United Arab Emirates
- FishingUAE. (August 2, 2020). Fishing in the UAE – General information
- Food and Agriculture Organization of the United Nations. (February 3, 2021). Fishing for change in the Emirati desert
- Food and Agriculture Organization of the United Nations. (no date). The new investment wave into aquaculture in Middle East countries: Opportunities and challenges
- Food Navigator-Asia. (July 2020). Reducing reliance on imports: UAE turns to aquaculture to boost food security
- Global Trade Tracker, 2021
- Ministry of Climate Change and Environment. (November 21, 2021). Sheikh Khalifa Marine Research Centre Delivers 600,000 Fish Fingerlings to Aquaculture Companies in the UAE
- Ministry of Climate Change and Environment. (August 27, 2020). Minister of Climate Change and Environment Discusses Fisheries Sector Challenges, Aquaculture Development
- Ministry of Climate Change and Environment. (2016). Aquaculture Guide: United Arab Emirates
- Ministry of Agriculture, Nature and Food Quality. (August 4, 2019). Aquaculture in UAE: Opportunities for Dutch Sustainable Technologies & Challenges
- Mintel, 2021
- Salaam Gateway. (July 13, 2020). Salmon farming, and aquaculture, in the UAE is about to get a lot bigger
- Storymaps. (June 23, 2020). Fisheries in the UAE and in the Gulf Region
- The National. (February 21, 2021). Inside Dubai's massive seafood factory set to boost food security in the UAE
- United States Department of Agriculture. (October 2021). Food and Agricultural Import Regulations and Standards Country Report
- World Bank. (2019). Agriculture, forestry, and fishing, value added (% of GDP) - United Arab Emirates
Sector Trend Analysis – Fish and seafood trends in the United Arab Emirates
Global Analysis Report
Prepared by: Saidouba Camara, Market Analyst
© Her Majesty the Queen in Right of Canada, represented by the Minister of Agriculture and Agri-Food (2022).
Photo credits
All photographs reproduced in this publication are used by permission of the rights holders.
All images, unless otherwise noted, are copyright Her Majesty the Queen in Right of Canada.
To join our distribution list or to suggest additional report topics or markets, please contact:
Agriculture and Agri-Food Canada, Global Analysis1341 Baseline Rd, Tower 5, 3rd floor
Ottawa ON K1A 0C5
Canada
Email: aafc.mas-sam.aac@agr.gc.ca
The Government of Canada has prepared this report based on primary and secondary sources of information. Although every effort has been made to ensure that the information is accurate, Agriculture and Agri-Food Canada (AAFC) assumes no liability for any actions taken based on the information contained herein.
Reproduction or redistribution of this document, in whole or in part, must include acknowledgement of agriculture and agri-food Canada as the owner of the copyright in the document, through a reference citing AAFC, the title of the document and the year. Where the reproduction or redistribution includes data from this document, it must also include an acknowledgement of the specific data source(s), as noted in this document.
Agriculture and Agri-Food Canada provides this document and other report services to agriculture and food industry clients free of charge.