

Note: This report includes forecasting data that is based on baseline historical data.
Executive summary
Vietnam ranked as the seventeenth largest market for fish and seafood in the world in 2022, with a market value share of 1.6% and imports valued at US$2,950.7 million (991.7 kilotonnes).
Canada was the thirteenth largest market for fish and seafood in 2022, accounting for 2.1% of the total world market share. Canada's imports were valued at US$3,976.1 million and 597.3 kilotonnes, representing an increase compared to 2018, with a compound annual growth rate (CAGR) of 6.2% from 2018 to 2022.
The top three suppliers of fish and seafood to Vietnam in 2022 were India, with a market value share of 15.6% (equivalent to US$461.5 million and 128.8 kilotonnes), followed by Indonesia with a 9.7% market value share (US$287.3 million and 58.4 kilotonnes), and Norway with a 9.6% market value share (US$282.7 million and 71.3 kilotonnes).
Canada was the 14th largest supplier of fish and seafood products to Vietnam, with a 2.1% market value share. Canada provided US$61.9 million and 4.2 kilotoones of fish and seafood to Vietnam in 2022.
Vietnam's total fish and seafood global imports declined by a CAGR of −9.8%. Top imported fish and seafood products to Vietnam were frozen shrimps and prawns, even smoked, valued at US$479.7 million, (69.7 kilotonnes), followed by frozen yellowfin tunas, valued at US$356.6 million (106.9 kilotonnes), and cuttle fish and squid, frozen, with or without shell valued at US$336.3 million (80.0 kilotonnes) in 2022.
The top three fish and seafood imports from Canada were frozen crabs, even smoked (HS: 030614), which amounted to US$43.2 million and 2,428.1 tonnes; live, fresh or chilled lobsters (HS: 030632), which amounted to US$9.1 million and 330.3 tonnes; and frozen, even in shell, clams, cockles and ark shells (HS: 030772), which amounted to US$2.9 million and 219.7 tonnes in 2022.
Trade overview
Vietnam ranked as the seventeenth largest market for fish and seafood in the world in 2022, with a market value share of 1.6% and imports valued at US$2,950.7 million (991.7 kilotonnes). Over the period of 2018 to 2022, Vietnam experienced a decrease in imports from US$4,456.1 million in 2018 (1,899.7 kilotonnes), resulting in a CAGR of −23.7%.
Canada was the thirteenth largest market for fish and seafood in 2022, accounting for 2.1% of the total world market share. Canada's imports were valued at US$3,976.1 million and 597.3 kilotonnes, representing an increase compared to 2018, with a CAGR of 6.2% from 2018 to 2022.
| Country | 2018 | 2019 | 2020 | 2021 | 2022 | CAGR* % 2018-2022 | Market share % 2022 |
|---|---|---|---|---|---|---|---|
| World total | 163,688.0 | 161,654.8 | 149,681.2 | 173,220.8 | 187,459.4 | 1.9 | 100.0 |
| United States | 23,988.6 | 23,520.8 | 22,976.5 | 30,179.3 | 32,392.9 | 8.0 | 17.3 |
| China | 14,745.2 | 18,413.6 | 15,267.6 | 17,760.3 | 23,347.1 | 6.4 | 12.5 |
| Japan | 15,782.5 | 15,564.6 | 13,577.9 | 14,386.4 | 15,419.2 | −3.0 | 8.2 |
| Spain | 8,679.8 | 8,151.8 | 7,357.2 | 8,895.6 | 9,630.3 | 0.8 | 5.1 |
| France | 7,154.9 | 6,817.1 | 6,503.2 | 7,899.1 | 8,253.4 | 3.4 | 4.4 |
| Italy | 7,113.8 | 6,731.0 | 6,151.6 | 7,541.9 | 7,800.5 | 2.0 | 4.2 |
| South Korea | 6,060.3 | 5,717.6 | 5,537.8 | 6,039.6 | 6,809.3 | −0.1 | 3.6 |
| Germany | 6,172.2 | 5,984.1 | 6,078.4 | 6,088.5 | 6,534.0 | −0.5 | 3.5 |
| Sweden | 5,629.1 | 5,270.6 | 5,072.4 | 5,609.8 | 6,144.0 | −0.1 | 3.3 |
| Netherlands | 4,540.5 | 4,521.2 | 4,610.6 | 5,155.7 | 5,573.9 | 4.3 | 3.0 |
| Canada (13) | 3,085.1 | 3,256.5 | 2,978.9 | 3,698.2 | 3,976.1 | 6.2 | 2.1 |
| Viet-Nam (17) | 4,456.1 | 2,439.6 | 2,035.6 | 1,977.1 | 2,950.7 | −23.7 | 1.6 |
|
Source: Global Trade Tracker, 2023 *CAGR: Compound Annual Growth Rate |
|||||||
World's global fish and seafood in volume to Vietnam declined at a CAGR of −40.5% from 2018 to 2022.
| Country | 2018 | 2019 | 2020 | 2021 | 2022 | CAGR* % 2018-2022 | Market share % 2022 |
|---|---|---|---|---|---|---|---|
| World Total | 310,224.3 | 39,693.6 | 38,061.6 | 39,037.0 | 38,830.6 | −40.5 | 100 |
| China | 5,214.9 | 6,256.8 | 5,667.2 | 5,744.6 | 6,469.9 | 5.5 | 16.7 |
| United States | 2,901.3 | 2,825.9 | 2,907.4 | 3,267.9 | 3,331.1 | 3.5 | 8.6 |
| Japan | 2,380.8 | 2,464.4 | 2,251.3 | 2,199.6 | 2,219.7 | −1.7 | 5.7 |
| Thailand | 2,126.5 | 2,047.6 | 2,149.3 | 2,114.7 | 2,157.3 | 0.4 | 5.6 |
| Spain | 1,768.4 | 1,820.8 | 1,713.7 | 1,815.1 | 1,846.5 | 1.1 | 4.8 |
| South Korea | 1,558.4 | 1,531.4 | 1,536.6 | 1,652.7 | 1,713.7 | 2.4 | 4.4 |
| France | 1,212.9 | 1,228.1 | 1,224.0 | 1,350.1 | 1,348.9 | 2.7 | 3.5 |
| Netherlands | 1,097.6 | 1,066.9 | 1,104.7 | 1,175.4 | 1,174.3 | 1.7 | 3.0 |
| Germany | 1,203.8 | 1,172.9 | 1,216.1 | 1,153.7 | 1,151.2 | −1.1 | 3.0 |
| Italy | 1,133.7 | 1,145.0 | 1,046.8 | 1,152.0 | 1,140.4 | 0.1 | 2.9 |
| Vietnam (12) | 1,899.7 | 1,080.5 | 864.2 | 763.8 | 991.7 | −15.0 | 2.6 |
| Canada (19) | 523.0 | 544.3 | 520.3 | 582.0 | 597.3 | 3.4 | 1.5 |
|
Source: Global Trade Tracker, 2023 *CAGR: Compound Annual Growth Rate |
|||||||
The top three suppliers of fish and seafood to Vietnam in 2022 were India, with a market value share of 15.6% (equivalent to US$461.5 million and 128.8 kilotonnes), followed by Indonesia with a 9.7% market value share (US$287.3 million and 58.4 kilotonnes), and Norway with a 9.6% market value share (US$282.7 million and 71.3 kilotonnes). World's global fish and seafood in value to Vietnam declined at a CAGR of −23.7% from 2018 to 2022.
Canada was the 14th largest supplier of fish and seafood products to Vietnam, with a 2.1% market value share. Canada provided US$61.9 million and 4.2 kilotonnes of fish and seafood to Vietnam in 2022. But the CAGR growth declined at −29.6% from 2018 to 2022.
| Country | 2018 | 2019 | 2020 | 2021 | 2022 | CAGR* % 2018-2022 | Market share % 2022 |
|---|---|---|---|---|---|---|---|
| World | 4,456.1 | 2,439.8 | 2,035.5 | 1,977.0 | 2,950.7 | −23.7 | 100.0 |
| India | 875.9 | 302.4 | 248.8 | 307.1 | 461.5 | −29.5 | 15.6 |
| Indonesia | 125.8 | 137.3 | 117.7 | 139.5 | 287.3 | 3.5 | 9.7 |
| Norway | 194.8 | 236.0 | 198.7 | 203.0 | 282.7 | 1.4 | 9.6 |
| China | 254.9 | 159.1 | 158.6 | 164.5 | 228.4 | −13.6 | 7.7 |
| Taiwan | 166.6 | 124.1 | 112.4 | 129.4 | 178.6 | −8.1 | 6.1 |
| Japan | 369.4 | 152.6 | 206.6 | 159.5 | 170.6 | −24.4 | 5.8 |
| Russia | 91.0 | 106.9 | 99.6 | 77.8 | 153.9 | −5.1 | 5.2 |
| South Korea | 112.1 | 96.5 | 86.4 | 106.1 | 136.5 | −1.8 | 4.6 |
| Ecuador | 547.3 | 183.7 | 24.0 | 28.0 | 133.2 | −62.9 | 4.5 |
| Chile | 108.7 | 86.6 | 106.4 | 92.8 | 110.9 | −5.1 | 3.8 |
| Canada 14 | 101.5 | 52.1 | 37.9 | 35.4 | 61.9 | −29.6 | 2.1 |
|
Source: Global Trade Tracker, 2023 *CAGR: Compound Annual Growth Rate |
|||||||
World's global fish and seafood in volume to Vietnam declined at a CAGR of −15.0% from 2018 to 2022.
Canada ranked 31 largest supplier in volume to Vietnam, but the CAGR growth significantly dropped at −48.6% from 2018 to 2022, and the market share is 0.4%.
| Country | 2018 | 2019 | 2020 | 2021 | 2022 | CAGR* % 2018-2022 | Market share % 2022 |
|---|---|---|---|---|---|---|---|
| World | 1,899.4 | 1,080.5 | 863.8 | 763.1 | 991.7 | −15.0 | 100 |
| India | 357.1 | 115.5 | 65.0 | 78.3 | 128.8 | −22.5 | 13.0 |
| Japan | 140.9 | 91.4 | 118.0 | 96.8 | 96.6 | −9.0 | 9.7 |
| China | 72.7 | 96.2 | 87.3 | 84.8 | 90.8 | 5.7 | 9.2 |
| Portugal | 1.2 | 0.9 | 1.1 | 0.9 | 82.0 | 187.5 | 8.3 |
| South Korea | 85.9 | 62.9 | 59.0 | 65.8 | 73.3 | −3.9 | 7.4 |
| Norway | 56.6 | 61.3 | 51.4 | 59.4 | 71.3 | 5.9 | 7.2 |
| Indonesia | 50.2 | 43.3 | 39.2 | 39.6 | 58.4 | 3.9 | 5.9 |
| Taiwan | 90.9 | 65.6 | 45.7 | 49.2 | 49.5 | −14.1 | 5.0 |
| Oman | 44.4 | 42.4 | 26.6 | 21.6 | 33.6 | −6.7 | 3.4 |
| Russian | 23.3 | 2435 | 26.3 | 23.0 | 33.2 | 9.3 | 3.3 |
| Canada 31 | 60.2 | 6.4 | 5.6 | 3.5 | 4.2 | −48.6 | 0.4 |
|
Source: Global Trade Tracker, 2023 *CAGR: Compound Annual Growth Rate |
|||||||
Vietnam's total fish and seafood global imports declined by a CAGR of −9.8%. Top imported fish and seafood products to Vietnam were frozen shrimps and prawns, even smoked, valued at US$479.7 million, (69.7 kilotonnes), followed by frozen yellowfin tunas, valued at US$356.6 million (106.9 kilotonnes), and cuttle fish and squid, frozen, with or without shell valued at US$336.3 million (80.0 kilotonnes) in 2022.
| HS Code | Description | 2018 | 2019 | 2020 | 2021 | 2022 | CAGR* % 2018-2022 |
|---|---|---|---|---|---|---|---|
| Fish and Seafood Total | 4,455.7 | 2,439.5 | 2,035.7 | 1,976.6 | 2,950.6 | −9.8 | |
| 030617 | frozen shrimps and prawns, even smoked, whether in shell or not, including shrimps and prawns in shell, cooked by steaming or by boiling in water (excluding cold-water shrimps and prawns) | 1,318.6 | 465.6 | 278.3 | 310.8 | 479.7 | −22.3 |
| 030342 | frozen yellowfin tunas | 152.4 | 218.6 | 165.6 | 200.0 | 356.6 | 23.7 |
| 030743 | cuttle fish and squid, frozen, with or without shell | 235.4 | 191.5 | 135.5 | 162.3 | 336.3 | 9.3 |
| 230120 | flours, meals and pellets of fish or crustaceans, molluscs or other aquatic invertebrates, unfit for human consumption | 293.1 | 251.7 | 286.2 | 169.4 | 275.0 | −1.6 |
| 030354 | frozen mackerel | 210.1 | 132.1 | 123.8 | 143.0 | 151.2 | −7.9 |
| 030389 | frozen fish, nowhere else specified | 405.4 | 116.8 | 89.0 | 81.0 | 108.5 | −28.1 |
| 030214 | fresh or chilled atlantic salmon "salmo salar" and danube salmon "hucho hucho" | 61.7 | 68.3 | 65.7 | 58.1 | 101.3 | 13.2 |
| 030312 | frozen pacific salmon (excluding sockeye salmon "red salmon") | 34.3 | 42.5 | 50.7 | 61.3 | 88.7 | 26.8 |
| 030614 | frozen crabs, even smoked, whether in shell or not, including crabs in shell, cooked by steaming or by boiling in water | 75.1 | 71.7 | 50.7 | 51.1 | 87.1 | 3.8 |
| 030481 | frozen fillets of pacific salmon, atlantic salmon and danube salmon | 31.0 | 56.7 | 59.5 | 60.1 | 70.8 | 22.9 |
|
Source: Global Trade Tracker, 2023 *CAGR: Compound Annual Growth Rate |
|||||||
| HS Code | Description | 2018 | 2019 | 2020 | 2021 | 2022 | CAGR* % 2018-2022 |
|---|---|---|---|---|---|---|---|
| Fish and Seafood Total | 1,899.2 | 1,079.7 | 863.8 | 763.2 | 991.3 | −15.0 | |
| 230120 | flours, meals and pellets of fish or crustaceans, molluscs or other aquatic invertebrates, unfit for human consumption | 244.5 | 218.0 | 249.5 | 142.8 | 199.5 | −5.0 |
| 030342 | frozen yellowfin tunas | 55.5 | 79.0 | 66.7 | 73.4 | 106.9 | 17.8 |
| 030354 | frozen mackerel | 72.5 | 95.9 | 85.8 | 96.9 | 93.9 | 6.7 |
| 030399 | frozen fish fins, heads, tails, maws and other edible fish offal (excluding livers, roes, milt and shark fins) | 15.9 | 17.2 | 18.1 | 7.8 | 93.6 | 55.8 |
| 030743 | cuttle fish and squid, frozen, with or without shell | 133.8 | 86.3 | 49.9 | 51.9 | 80.0 | −12.1 |
| 030617 | frozen shrimps and prawns, even smoked, whether in shell or not, including shrimps and prawns in shell, cooked by steaming or by boiling in water (excluding cold-water shrimps and prawns) | 483.2 | 156.9 | 48.6 | 49.7 | 69.7 | −38.4 |
| 030389 | frozen fish, nowhere else specified | 280.3 | 78.1 | 51.5 | 48.2 | 54.6 | −33.6 |
| 030343 | frozen skipjack or stripe-bellied bonito | 65.0 | 61.9 | 32.7 | 31.9 | 34.1 | −14.9 |
| 030312 | frozen pacific salmon (excluding sockeye salmon "red salmon") | 7.2 | 10.4 | 13.8 | 14.5 | 20.2 | 29.4 |
| 150420 | fats and oils of fish and their fractions, whether or not refined (excluding liver oils and chemically modified) | 17.1 | 18.5 | 18.7 | 55.5 | 16.9 | −0.3 |
|
Source: Global Trade Tracker, 2023 *CAGR: Compound Annual Growth Rate |
|||||||
Top five global fish and seafood suppliers by top five products to Vietnam, in US$ millions
India
Vietnam's fish and seafood importing from India decreased at a CAGR of −14.8% from 2018 to 2022. Top three products are frozen shrimps and prawns valued at US$295.3 million, flours, meals and pellets of fish or crustaceans, molluscs or other aquatic invertebrates valued at US$89.1 million and frozen cuttle fish and squid valued at US$33.5 million in 2022.
| HS Code | Description | 2018 | 2019 | 2020 | 2021 | 2022 | CAGR* % 2018-2022 |
|---|---|---|---|---|---|---|---|
| Fish and Seafood Total | 875.8 | 302.1 | 248.7 | 307.0 | 461.3 | −14.8 | |
| 030617 | frozen shrimps and prawns, even smoked, whether in shell or not, including shrimps and prawns in shell, cooked by steaming or by boiling in water (excluding cold-water shrimps and prawns) | 563.5 | 178.0 | 188.3 | 233.0 | 295.3 | −14.9 |
| 230120 | flours, meals and pellets of fish or crustaceans, molluscs or other aquatic invertebrates, unfit for human consumption | 34.3 | 38.3 | 17.2 | 29.4 | 89.1 | 27.0 |
| 030743 | cuttle fish and squid, frozen, with or without shell | 67.4 | 32.4 | 19.6 | 20.8 | 33.5 | −16.0 |
| 030752 | octopus, frozen | 28.7 | 17.7 | 14.1 | 13.6 | 21.1 | −7.4 |
| 030342 | frozen yellowfin tunas | 7.1 | 11.8 | 2.2 | 4.8 | 10.7 | 10.8 |
|
Source: Global Trade Tracker, 2023 *CAGR: Compound Annual Growth Rate |
|||||||
Indonesia
Vietnam's fish and seafood importing from Indonesia increased at a CAGR of 23.0% from 2018 to 2022. Top three products are cuttle fish and squid valued at US$190.1 million, frozen yellowfin tunas valued at US$45.2 million and frozen fillets of tuna valued at US$21.2 million in 2022.
| HS Code | Description | 2018 | 2019 | 2020 | 2021 | 2022 | CAGR* % 2018-2022 |
|---|---|---|---|---|---|---|---|
| Fish and Seafood Total | 125.4 | 137.0 | 117.8 | 139.6 | 287.1 | 23.0 | |
| 030743 | cuttle fish and squid, frozen, with or without shell | 62.7 | 91.1 | 80.5 | 92.4 | 190.1 | 32.0 |
| 030342 | frozen yellowfin tunas "thunnus albacares" | 12.4 | 7.4 | 9.8 | 21.7 | 45.2 | 38.2 |
| 030487 | frozen fillets of tuna "of the genus thunnus", skipjack or stripe-bellied bonito "euthynnus [katsuwonus] pelamis" | 2.9 | 10.9 | 6.6 | 8.4 | 21.2 | 64.4 |
| 030389 | frozen fish, nowhere else specified | 9.7 | 4.9 | 1.8 | 1.9 | 5.4 | −13.6 |
| 121221 | seaweeds and other algae, fresh, chilled, frozen or dried, whether or not ground, fit for human consumption | 5.2 | 3.1 | 3.0 | 5.5 | 4.5 | −3.6 |
|
Source: Global Trade Tracker, 2023 *CAGR: Compound Annual Growth Rate |
|||||||
Norway
Vietnam's fish and seafood importing from Norway increased at a CAGR of 9.8% from 2018 to 2022. Top three products are fresh or chilled atlantic salmon and danube salmon valued at US$77.8 million, frozen mackerel valued at US$71.3 million and frozen fillets of pacific salmon, atlantic salmon and danube salmon valued at US$58.2 million in 2022.
| HS Code | Description | 2018 | 2019 | 2020 | 2021 | 2022 | CAGR* % 2018-2022 |
|---|---|---|---|---|---|---|---|
| Fish and Seafood Total | 194.4 | 236.2 | 198.4 | 202.9 | 282.6 | 9.8 | |
| 030214 | fresh or chilled atlantic salmon and danube salmon | 52.4 | 56.6 | 41.1 | 37.6 | 77.8 | 10.4 |
| 030354 | frozen mackerel | 31.2 | 52.7 | 50.2 | 66.8 | 71.3 | 23.0 |
| 030481 | frozen fillets of pacific salmon, atlantic salmon and danube salmon | 23.6 | 41.5 | 42.7 | 51.2 | 58.2 | 25.3 |
| 030399 | frozen fish fins, heads, tails, maws and other edible fish offal (excluding livers, roes, milt and shark fins) | 2.6 | 5.6 | 5.9 | 4.9 | 9.9 | 39.7 |
| 030614 | frozen crabs, even smoked, whether in shell or not, including crabs in shell, cooked by steaming or by boiling in water | 1.1 | 4.3 | 1.8 | 2.0 | 8.2 | 65.2 |
|
Source: Global Trade Tracker, 2023 *CAGR: Compound Annual Growth Rate |
|||||||
China
Vietnam's fish and seafood importing from China decreased at a CAGR of −2.7% from 2018 to 2022. Top three products are live fish valued at US$26.8 million, live eels valued at US$23.6 million and frozen cuttle fish and squid valued at US$22.3 million in 2022.
| HS Code | Description | 2018 | 2019 | 2020 | 2021 | 2022 | CAGR* % 2018-2022 |
|---|---|---|---|---|---|---|---|
| Fish and Seafood Total | 254.5 | 158.8 | 158.3 | 164.5 | 228.2 | −2.7 | |
| 030199 | live fish (excluding ornamental fish, trout, eels, carp, atlantic and pacific bluefin tuna and and southern bluefin tuna) | 12.5 | 21.8 | 23.3 | 17.2 | 26.8 | 21.0 |
| 030192 | live eels | 7.1 | 10.0 | 6.5 | 9.1 | 23.6 | 35.0 |
| 030743 | cuttle fish and squid, frozen, with or without shell | 12.4 | 8.5 | 6.1 | 13.5 | 22.3 | 15.8 |
| 030342 | frozen yellowfin tunas | 8.2 | 8.4 | 12.5 | 22.9 | 21.4 | 27.1 |
| 030354 | frozen mackerel | 135.5 | 21.4 | 9.2 | 17.6 | 14.1 | −43.2 |
|
Source: Global Trade Tracker, 2023 *CAGR: Compound Annual Growth Rate |
|||||||
Taiwan
Vietnam's fish and seafood importing from Taiwan increased at a CAGR of 1.8% from 2018 to 2022. Top three products are frozen yellowfin tunas valued at US$106.7 million, frozen albacore or longfinned tunas valued at US$20.0 million and frozen fish , n.e.s valued at US$17.0 million in 2022.
| HS Code | Description | 2018 | 2019 | 2020 | 2021 | 2022 | CAGR* % 2018-2022 |
|---|---|---|---|---|---|---|---|
| Fish and Seafood Total | 166.5 | 123.8 | 112.5 | 129.2 | 178.8 | 1.8 | |
| 030342 | frozen yellowfin tunas | 37.9 | 51.8 | 47.1 | 60.1 | 106.7 | 29.5 |
| 030341 | frozen albacore or longfinned tunas | 8.5 | 10.3 | 26.0 | 27.1 | 20.0 | 23.9 |
| 030389 | frozen fish, nowhere else specified | 23.7 | 11.0 | 14.9 | 9.0 | 17.0 | −8.0 |
| 030743 | cuttle fish and squid, frozen, with or without shell | 9.4 | 4.4 | 1.2 | 12.7 | 14.8 | 12.0 |
| 030343 | frozen skipjack or stripe-bellied bonito | 13.3 | 12.5 | 12.0 | 10.4 | 7.3 | −13.9 |
|
Source: Global Trade Tracker, 2023 *CAGR: Compound Annual Growth Rate |
|||||||
Canada's performance
In 2022, Canada became Vietnam's 14th largest supplier of fish and seafood. The total value of fish and seafood imports from Canada in 2022 was US$61.8 million, which represents a −11.6% decrease in growth rate from 2018 to 2022 compared to the US$101.3 million registered in 2018.
The top three fish and seafood imports from Canada were frozen crabs, even smoked (HS: 030614), which amounted to US$43.2 million and 2,428.1 tonnes; live, fresh or chilled lobsters (HS: 030632), which amounted to US$9.1 million and 330.3 tonnes; and frozen, even in shell, clams, cockles and ark shells (HS: 030772), which amounted to US$2.9 million and 219.7 tonnes in 2022.
| HS Code | Description | 2018 | 2019 | 2020 | 2021 | 2022 | CAGR* % 2018-2022 |
|---|---|---|---|---|---|---|---|
| Total - fish and seafood imports | 101.3 | 52.2 | 37.7 | 35.2 | 61.8 | −11.6 | |
| 030614 | frozen crabs, even smoked, whether in shell or not, including crabs in shell, cooked by steaming or by boiling in water | 23.8 | 32.7 | 17.8 | 17.9 | 43.2 | 16.1 |
| 030632 | lobsters "homarus spp.", whether in shell or not, live, fresh or chilled | 4.0 | 4.4 | 4.6 | 5.0 | 9.1 | 22.8 |
| 030772 | frozen, even in shell, clams, cockles and ark shells | 1.7 | 3.0 | 2.2 | 3.1 | 2.9 | 14.3 |
| 030616 | frozen cold-water shrimps and prawns even smoked, whether in shell or not, including shrimps and prawns in shell, cooked by steaming or by boiling in water | 1.8 | 1.7 | 2.6 | 1.1 | 1.4 | −6.1 |
| 030331 | frozen lesser or greenland halibut, atlantic halibut and pacific halibut | 3.7 | 0.0 | 0.6 | 0.0 | 1.0 | −27.9 |
|
Source: Global Trade Tracker, 2023 *CAGR: Compound Annual Growth Rate |
|||||||
The volume of fish and seafood imports from Canada also decreased by −48.5% from 2018 to 2022, from 60,186.7 tonnes in 2018 to 4,232.8 tonnes in 2022.
| HS Code | Description | 2018 | 2019 | 2020 | 2021 | 2022 | CAGR* % 2018-2022 |
|---|---|---|---|---|---|---|---|
| Total - fish and seafood imports | 60,186.7 | 6,421.2 | 5,619.8 | 3,539.9 | 4,232.8 | −48.5 | |
| 030614 | frozen crabs, even smoked, whether in shell or not, including crabs in shell, cooked by steaming or by boiling in water | 1,802.6 | 2,241.2 | 1,240.8 | 975.7 | 2,428.1 | 7.7 |
| 030389 | frozen fish, nowhere else specified | 46,237.0 | 219.1 | 380.8 | 431.2 | 362.2 | −70.2 |
| 030632 | lobsters "homarus spp.", whether in shell or not, live, fresh or chilled | 214.0 | 195.1 | 226.8 | 188.8 | 330.3 | 11.5 |
| 030616 | frozen cold-water shrimps and prawns , even smoked, whether in shell or not, including shrimps and prawns in shell, cooked by steaming or by boiling in water | 298.9 | 302.2 | 494.4 | 300.3 | 321.1 | 1.8 |
| 030614 | frozen crabs, even smoked, whether in shell or not, including crabs in shell, cooked by steaming or by boiling in water | 1,802.6 | 2,241.2 | 1,240.8 | 975.7 | 2,428.1 | 7.7 |
| 030772 | frozen, even in shell, clams, cockles and ark shells | 214.1 | 266.9 | 208.0 | 280.7 | 219.7 | 0.6 |
|
Source: Global Trade Tracker, 2023 *CAGR: Compound Annual Growth Rate |
|||||||
Retail sales by category
The strong fluctuations in oil prices in 2022 meant that the cost of fishing increased. For aquaculture, the cost of animal feed also increased, which drove up the prices of fish and seafood. In addition, the prices of food in general have been rising, which has tightened consumers' budgets (Euromonitor 2022).
The retail sales of fish and seafood in Vietnam have seen a steady growth over the past few years. The retail sales of fish and seafood in Vietnam increased from US$6,645.2 million in 2018 to US$10,367.2 million in 2022, with a CAGR of 11.8%. The market is expected to continue its growth, with a forecasted retail sales value of US$11,509.9 million in 2023 and US$18,898.5 million in 2027, with a CAGR of 12.8% from 2023 to 2027.
The retail sales of crustaceans in Vietnam increased from US$1,660.6 million in 2018 to US$2,555.5 million in 2022, reflecting a CAGR of 11.4%. The market is predicted to maintain its upward trajectory, with an estimated CAGR of 16.3% from 2023 to 2027. The retail sales value of crustaceans is projected to be US$2,941.6 million in 2023 and US$5,447.8 million in 2027.
Fish sales in Vietnam grew at a CAGR of 11.6% from 2018 to 2022, with retail sales climbing from US$3,124.7 million in 2018 to US$4,879.3 million in 2022. The fish market is expected to grow at a faster pace, with a projected CAGR of 11.7% from 2023 to 2027. The retail sales value of fish products is anticipated to be US$5,345.1million in 2023 and US$8,476.0 million in 2027.
Molluscs and cephalopods in Vietnam saw retail sales surge from US$1,859.9 million in 2018 to US$2,932.3 million in 2022, reflecting a CAGR of 12.1%. The market is expected to grow from 2023 to 2027, with a projected CAGR of 11.2%. The forecasted retail sales value for molluscs and cephalopods is $3,223.3 million in 2023 and $4,974.8 million in 2027.
Retail sales of processed seafood in Vietnam have seen growth over the past few years, with a CAGR of 10.2% between 2018 and 2022. During this time period, the total retail sales of processed seafood increased from US$172.8 million in 2018 to US$255.1 million in 2022 and the forecast indicate that the market will continue to growth from 2023 to 2027. All the three segments, shelf stable seafood, chilled processed seafood, frozen processed seafood are growing at a CAGR of 12.5%, 7.3% and 7.6% respectively from 2018 to 2022.
| Category | 2018 | 2019 | 2020 | 2021 | 2022 | CAGR* % 2018-2022 |
|---|---|---|---|---|---|---|
| Fish and seafood | 6,645.2 | 7,474.9 | 8,624.3 | 9,099.0 | 10,367.2 | 11.8 |
| Crustaceans | 1,660.6 | 1,876.5 | 2,136.7 | 2,222.2 | 2,555.5 | 11.4 |
| Fish | 3,124.7 | 3,515.3 | 4,039.4 | 4,281.8 | 4,879.3 | 11.8 |
| Molluscs and Cephalopods | 1,859.9 | 2,083.1 | 2,448.1 | 2,595.0 | 2,932.3 | 12.1 |
| Processed Seafood | 172.8 | 190.2 | 210.4 | 227.7 | 255.1 | 10.2 |
| Shelf Stable Seafood | 88.9 | 98.7 | 111.5 | 123.8 | 142.4 | 12.5 |
| Chilled Processed Seafood | 4.3 | 4.7 | 5.1 | 5.3 | 5.7 | 7.3 |
| Frozen Processed Seafood | 79.7 | 86.8 | 93.8 | 98.6 | 107.0 | 7.6 |
|
Source: Euromonitor International, 2023 *CAGR: Compound Annual Growth Rate |
||||||
| Category | 2023 | 2024 | 2025 | 2026 | 2027 | CAGR* % 2022-2027 |
|---|---|---|---|---|---|---|
| Fish and seafood | 11,509.9 | 12,925.3 | 14,615.9 | 16,589.3 | 18,898.5 | 12.8 |
| Crustaceans | 2,941.6 | 3,401.1 | 3,961.6 | 4,635.4 | 5,447.8 | 16.3 |
| Fish | 5,345.1 | 5,964.5 | 6,693.1 | 7,525.0 | 8,476.0 | 11.7 |
| Molluscs and Cephalopods | 3,223.3 | 3,559.7 | 3,961.2 | 4,429.0 | 4,974.8 | 11.2 |
| Processed Seafood | 274.2 | 296.3 | 322.7 | 353.3 | 386.5 | 8.7 |
| Shelf Stable Seafood | 155.0 | 169.6 | 186.9 | 207.1 | 228.3 | 9.9 |
| Chilled Processed Seafood | 6.1 | 6.5 | 7.0 | 7.5 | 8.2 | 7.5 |
| Frozen Processed Seafood | 113.2 | 120.3 | 128.8 | 138.7 | 150.0 | 7.0 |
|
Source: Euromonitor International, 2023 *CAGR: Compound Annual Growth Rate |
||||||
In 2022, the value of retail sales of processed meat and seafood in Vietnam amounted to US$506.7 million, with a growth rate of 8.3% from 2018 to 2022 compared with the value of US$368.7 million in 2018. The primary distribution channel for these products was offline retail, specifically grocery retailers, which had a market value of US$504.8 million in 2022, showing an increase in growth rate of 8.2% from 2018 to 2022 compared with the value of US$368.2 million in 2018. This channel accounted to 99.6% of the market share, with small local grocers as the largest channel, accumulating a market share representation of 74.1% in 2022.
In contrast, E-Commerce represented a smaller share of the market, accounting for only 0.4% in 2022. However, this channel showed a higher growth rate at the CAGR 39.6% compared to offline retail growth rate at the CAGR 8.2%.
| Outlet Type | 2018 | 2019 | 2020 | 2021 | 2022 | Share from total % 2022 | CAGR* % 2018-2022 |
|---|---|---|---|---|---|---|---|
| Retail Channels | 368.7 | 394.1 | 428.5 | 454.9 | 506.7 | 100.00 | 8.3 |
| Retail Offline | 368.2 | 393.4 | 427.2 | 453.3 | 504.8 | 99.6 | 8.2 |
| Grocery Retailers | 368.2 | 393.4 | 427.2 | 453.3 | 504.8 | 99.6 | 8.2 |
| Convenience Retail | 1.3 | 2.4 | 4.3 | 5.7 | 7.5 | 1.5 | 55.0 |
| Supermarkets | 33.9 | 37.7 | 42.5 | 47.1 | 54.7 | 10.8 | 12.7 |
| Hypermarkets | 22.9 | 23.8 | 25.1 | 25.9 | 29.8 | 5.9 | 6.8 |
| Food / drink / tobacco specialists | 31.7 | 32.9 | 34.7 | 35.3 | 37.3 | 7.4 | 4.2 |
| Small Local Grocers | 278.5 | 296.6 | 320.6 | 339.2 | 375.5 | 74.1 | 7.8 |
| Retail E-Commerce | 0.5 | 0.8 | 1.3 | 1.6 | 1.9 | 0.4 | 39.6 |
|
Source: Euromonitor International, 2023 1:Processed meat and seafood (as defined by Euromonitor International) - processed meat, processed seafood and meat substitutes (includes all types of chilled, frozen and shelf stable meat and fish substitutes such as vegetarian sausages, vegetarian burgers, bean burgers, vegetarian fish filets etc. typically made of quorn mycoprotein, tofu, soy or texturized vegetable protein). *CAGR: Compound Annual Growth Rate |
|||||||
Competitive landscape
Royal Food Co Ltd and CJ Corp were the two largest processed seafood companies with retail sales of US$80.2 million and US$16.4 million respectively representing a 37.8% market share in 2022.
Royal Food Co Ltd and Pataya Food Industries Ltd were the two largest Shelf Stable Seafood companies with retail sales valued at US$80.2 million and US$6.8 million with a combined 61.1% market share in 2022.
Halong Canned Food JSC and Cholon Investment & Import-Export Co (CHOLIMEX) are the two largest frozen processed seafood companies with retail sales valued at US$16.4 million and US$5.7 million with a combined 20.6% market share in 2022.
| Category | Company | 2018 | 2019 | 2020 | 2021 | 2022 | CAGR* % 2018-2022 | Market share % 2022 |
|---|---|---|---|---|---|---|---|---|
| Processed Seafood | Royal Food Co Ltd | 62.2 | 65.1 | 67.9 | 71.3 | 80.2 | 6.6 | 31.4 |
| CJ Corp | 9.7 | 11.5 | 13.3 | 14.6 | 16.4 | 14.0 | 6.4 | |
| An Giang Fisheries Import Export Co (Agifish) | 9.1 | 11.1 | 12.5 | 13.7 | 15.4 | 14.1 | 6.0 | |
| Halong Canned Food JSC | 8.2 | 7.8 | 8.6 | 9.4 | 10.6 | 6.6 | 4.2 | |
| Agrex Saigon - Export Foodstuff & Agricultural Products Co | 8.0 | 8.3 | 8.8 | 9.3 | 9.9 | 5.5 | 3.9 | |
| Others | 58.9 | 64.6 | 74.7 | 83.5 | 95.2 | 12.8 | 37.3 | |
| Total | 176.2 | 190.2 | 208.9 | 226.6 | 255.1 | 9.7 | 100.0 | |
| Shelf Stable Seafood | Royal Food Co Ltd | 62.2 | 65.1 | 67.9 | 71.3 | 80.2 | 6.6 | 56.3 |
| Pataya Food Industries Ltd | 3.9 | 4.4 | 5.1 | 5.9 | 6.8 | 14.9 | 4.8 | |
| Halong Canned Food JSC | 2.8 | 3.2 | 3.6 | 4.1 | 4.8 | 14.4 | 3.4 | |
| Special Aquatic Joint-stock Co (SEASPIMEX-VIETNAM) | 3.1 | 3.1 | 3.3 | 3.4 | 3.7 | 4.5 | 2.6 | |
| Denis Frères SA | 0.1 | 0.1 | 0.1 | 0.2 | 0.2 | 18.9 | 0.1 | |
| Others | 18.6 | 22.6 | 30.6 | 38.3 | 46.6 | 25.8 | 32.7 | |
| Total | 90.6 | 98.7 | 110.7 | 123.2 | 142.4 | 12.0 | 100.0 | |
| Chilled Processed Seafood | Trung Son Co Ltd | 1.0 | 1.1 | 1.2 | 1.2 | 1.3 | 6.8 | 22.8 |
| Vinh Hoan Seafood Co Ltd | 1.0 | 1.0 | 1.0 | 1.1 | 1.1 | 2.4 | 19.3 | |
| Others | 2.4 | 2.6 | 2.9 | 3.0 | 3.3 | 8.3 | 57.9 | |
| Total | 4.3 | 4.7 | 5.1 | 5.3 | 5.7 | 7.3 | 100.0 | |
| Frozen Processed Seafood | CJ Corp | 1.0 | 1.1 | 1.2 | 1.2 | 1.3 | 6.8 | 1.2 |
| An Giang Fisheries Import Export Co (Agifish) | 1.0 | 1.0 | 1.0 | 1.1 | 1.1 | 2.4 | 1.0 | |
| Agrex Saigon - Export Foodstuff & Agricultural Products Co | 2.4 | 2.6 | 2.9 | 3.0 | 3.3 | 8.3 | 3.1 | |
| Cholon Investment & Import-Export Co (CHOLIMEX) | 4.3 | 4.7 | 5.1 | 5.3 | 5.7 | 7.3 | 5.3 | |
| Halong Canned Food JSC | 9.7 | 11.5 | 13.3 | 14.6 | 16.4 | 14.0 | 15.3 | |
| Others | 37.8 | 39.2 | 41.1 | 42.0 | 45.1 | 4.5 | 42.1 | |
| Total | 81.2 | 86.8 | 93.1 | 98.1 | 107.0 | 7.1 | 100.0 | |
|
Source: Euromonitor International, 2023 *CAGR: Compound Annual Growth Rate |
||||||||
Three Lady Cooks (Royal Food Co Ltd) and Cau Tre (CJ Corp)were the two largest brands in processed seafood with an 6.6% and 14.6% growth rate respectively from 2018 to 2022.
| Category | Brand | 2018 | 2019 | 2020 | 2021 | 2022 | CAGR* % 2016-2020 |
|---|---|---|---|---|---|---|---|
| Processed Seafood | Three Lady Cooks (Royal Food Co Ltd) | 62.2 | 65.1 | 67.9 | 71.3 | 80.2 | 6.6 |
| Cau Tre (CJ Corp) | 9.0 | 10.8 | 12.5 | 13.7 | 15.5 | 14.6 | |
| Agifish (An Giang Fisheries Import Export Co (Agifish)) | 9.1 | 11.1 | 12.5 | 13.7 | 15.4 | 14.1 | |
| Ha Long (Halong Canned Food JSC) | 8.2 | 7.8 | 8.6 | 9.4 | 10.6 | 6.6 | |
| Agrex SaiGon (Agrex Saigon - Export Foodstuff & Agricultural Products Co) | 8.0 | 8.3 | 8.8 | 9.3 | 9.9 | 5.5 | |
| Others | 58.9 | 64.6 | 74.7 | 83.5 | 95.2 | 12.8 | |
| Total | 176.2 | 190.2 | 208.9 | 226.6 | 255.1 | 9.7 | |
| Shelf Stable Seafood | Three Lady Cooks (Royal Food Co Ltd) | 62.2 | 65.1 | 67.9 | 71.3 | 80.2 | 6.6 |
| Sea Crown (Pataya Food Industries Ltd) | 3.9 | 4.4 | 5.1 | 5.9 | 6.8 | 14.9 | |
| Ha Long (Halong Canned Food JSC) | 2.8 | 3.2 | 3.6 | 4.1 | 4.8 | 14.4 | |
| Seaspimex (Special Aquatic Joint-stock Co (SEASPIMEX-VIETNAM)) | 3.1 | 3.1 | 3.3 | 3.4 | 3.7 | 4.5 | |
| Ayam (Denis Frères SA) | 0.1 | 0.1 | 0.1 | 0.2 | 0.2 | 18.9 | |
| Others | 18.6 | 22.6 | 30.6 | 38.3 | 46.6 | 25.8 | |
| Total | 90.6 | 98.7 | 110.7 | 123.2 | 142.4 | 12.0 | |
| Chilled Processed Seafood | Amigo (Trung Son Co Ltd) | 1.0 | 1.1 | 1.2 | 1.2 | 1.3 | 6.8 |
| Tam Loi (Vinh Hoan Seafood Co Ltd) | 1.0 | 1.0 | 1.0 | 1.1 | 1.1 | 2.4 | |
| Others | 2.4 | 2.6 | 2.9 | 3.0 | 3.3 | 8.3 | |
| Total | 4.3 | 4.7 | 5.1 | 5.3 | 5.7 | 7.3 | |
| Frozen Processed Seafood | Cau Tre (CJ Corp) | 9.0 | 10.8 | 12.5 | 13.7 | 15.5 | 14.6 |
| Agifish (An Giang Fisheries Import Export Co (Agifish)) | 9.1 | 11.1 | 12.5 | 13.7 | 15.4 | 14.1 | |
| Agrex SaiGon (Agrex Saigon - Export Foodstuff & Agricultural Products Co) | 8.0 | 8.3 | 8.8 | 9.3 | 9.9 | 5.5 | |
| Cholimex (Cholon Investment & Import-Export Co (CHOLIMEX)) | 5.3 | 6.2 | 7.1 | 8.0 | 9.0 | 14.2 | |
| Ha Long (Halong Canned Food JSC) | 5.4 | 4.6 | 5.0 | 5.3 | 5.8 | 1.8 | |
| Others | 37.8 | 39.2 | 41.1 | 42.0 | 45.1 | 4.5 | |
| Total | 81.2 | 86.8 | 93.1 | 98.1 | 107.0 | 7.1 | |
|
Source: Euromonitor International, 2023 *CAGR: Compound Annual Growth Rate |
|||||||
New product launch analysis
According to Mintel's Global New Products Database (GNPD), there were 3,781 fish and fish products as an ingredient launched in between January 2018 and December 2022. Of those fish products released, 3,546 were food products, 207 were pet products, 16 were health and hygiene and 12 were drinks.
The top sub-categories of products offered were meat products, fish products, prepared meals and poultry products from January 2018 to December 2022. Top claims (may contain more than one claim per package) were ease of use, no additives/preservatives and free from added/artificial preservatives. Top package types were flexible, skinpack and tray. Top flavours (including blends) identified were unflavoured/plain, smoke and fish sauce/Nuoc Mam, while top ingredients identified were white sugar (Food), salt (food) and fish Monosodium Glutamate (food).
| Product attributes | Yearly launch counts | Total | ||||
|---|---|---|---|---|---|---|
| 2018 | 2019 | 2020 | 2021 | 2022 | ||
| Yearly product launches | 515 | 756 | 857 | 742 | 911 | 3781 |
| Top five sub-categories | ||||||
| Meat Products | 77 | 244 | 329 | 185 | 245 | 1,080 |
| Fish Products | 88 | 142 | 167 | 110 | 109 | 616 |
| Poultry Products | 14 | 31 | 52 | 74 | 49 | 220 |
| Table Sauces | 40 | 32 | 34 | 36 | 59 | 201 |
| Instant Noodles | 33 | 37 | 33 | 33 | 56 | 192 |
| Top five claims | ||||||
| Ease of Use | 179 | 267 | 200 | 235 | 218 | 1,099 |
| No Additives / Preservatives | 115 | 154 | 151 | 175 | 141 | 736 |
| Free from Added / Artificial Preservatives | 93 | 138 | 130 | 152 | 121 | 634 |
| Social Media | 50 | 50 | 69 | 95 | 115 | 379 |
| Premium | 32 | 60 | 58 | 93 | 130 | 373 |
| Imported status | ||||||
| Not imported | 77 | 152 | 111 | 195 | 290 | 825 |
| Imported | 60 | 58 | 33 | 44 | 52 | 247 |
| Top packaged types | ||||||
| Flexible | 148 | 232 | 172 | 208 | 232 | 992 |
| Skinpack | 79 | 154 | 262 | 144 | 172 | 811 |
| Tray | 9 | 86 | 190 | 113 | 145 | 543 |
| Flexible stand-up pouch | 26 | 53 | 50 | 74 | 52 | 255 |
| Bottle | 49 | 40 | 38 | 41 | 73 | 241 |
| Top launch types | ||||||
| New Variety / Range Extension | 158 | 240 | 358 | 228 | 329 | 1,313 |
| New Product | 176 | 232 | 280 | 230 | 182 | 1,100 |
| New Packaging | 153 | 242 | 177 | 221 | 300 | 1,093 |
| Relaunch | 27 | 42 | 41 | 63 | 99 | 272 |
| New Formulation | 1 | 0 | 1 | 0 | 1 | 3 |
| Top five flavours (including blend) | ||||||
| Unflavoured/Plain | 198 | 381 | 497 | 334 | 389 | 1,799 |
| Smoke | 2 | 26 | 16 | 14 | 21 | 79 |
| Fish Sauce / Nuoc Mam | 10 | 9 | 15 | 24 | 20 | 78 |
| Fish | 21 | 7 | 19 | 8 | 6 | 61 |
| Anchovy and Fish Sauce / Nuoc Mam | 4 | 7 | 6 | 8 | 24 | 49 |
| Top five ingredients | ||||||
| White Sugar (Food) | 293 | 356 | 285 | 350 | 471 | 1,755 |
| Salt (Food) | 233 | 349 | 304 | 318 | 405 | 1,609 |
| Monosodium Glutamate (Food) | 233 | 316 | 246 | 293 | 407 | 1,495 |
| Flavour Enhancers | 217 | 275 | 230 | 275 | 420 | 1,417 |
| Fish Sauce and Juice (Food) | 128 | 171 | 187 | 180 | 239 | 905 |
| Source: Mintel, 2023 | ||||||
Examples of new product launches
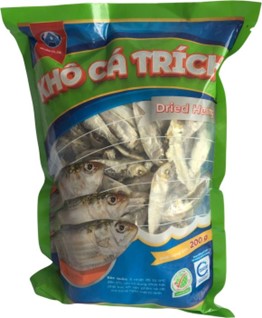
Dried Herring
| Company | An Vinh |
|---|---|
| Manufacturer | An Vinh |
| Brand | An Vinh |
| Category | Processed fish, meat and egg products |
| Sub-category | Fish products |
| Market | Vietnam |
| Store name | Lotte Mart |
| Store type | Supermarket |
| Date published | December 2022 |
| Launch type | New packaging |
| Price in local currency | VND29,500.00 |
| Price in US dollars | 1.25 |
| Price in Euros | 1.18 |
An Vinh Kho Ca Trich (Dried Herring) has been repackaged in a newly designed 200 gram pack. - Microwaveable - Logos and certifications: Quacert, HACCP, Hang Viet Nam Chat Luong Cao (Vietnam High Quality Goods Awards).
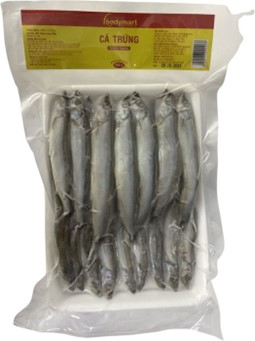
Female Capelin
| Company | Foodymart |
|---|---|
| Manufacturer | Foodymart |
| Brand | Foodymart |
| Category | Processed fish, meat and egg products |
| Sub-category | Fish products |
| Market | Vietnam |
| Store name | Tops Market Vietnam |
| Store type | Mass merchandise / hypermarket |
| Date published | December 2022 |
| Launch type | Relaunch |
| Price in local currency | VND67,500.00 |
| Price in US dollars | 2.77 |
| Price in Euros | 2.63 |
Foodymart Ca Trung (Female Capelin) has been relaunched under a new brand name, previously known as Wow! Gia Hap Dan, and retails in a newly designed 500 gram pack. - Imported from Norway - Pack bears cookin
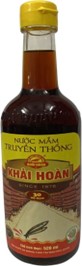
Fish Sauce
| Company | Khai Hoan Trading |
|---|---|
| Manufacturer | Khai Hoan Trading |
| Brand | Khai Hoan |
| Category | Sauces and seasonings |
| Sub-category | Table sauces |
| Market | Vietnam |
| Store name | Aeon Supermarket |
| Store type | Supermarket |
| Date published | December 2022 |
| Launch type | New packaging |
| Price in local currency | VND76,400.00 |
| Price in US dollars | 3.14 |
| Price in Euros | 2.98 |
Khai Hoan Nuoc Mam Truyen Thong (Fish Sauce) has been repackaged in a newly designed 520 millilitre pack. - Provides 30% protein per volume - Made from Phu Quoc black anchovy and Ba Ria Vung Tau sea salt - Naturally fermented in barrels using traditional methods and complying HACCP standards - No preservatives- Logos and certifications: QR code, Hang Viet Nam Chat Luong Cao (Vietnam High Quality Goods Awards)
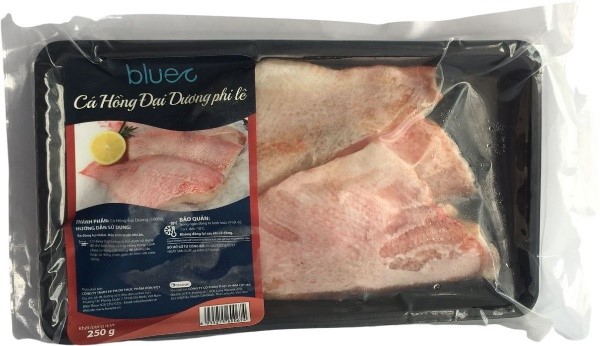
Ocean Snapper Fillets
| Company | Cat Hai |
|---|---|
| Manufacturer | Cat Hai |
| Distributor | Hon Viet |
| Brand | Ocean Gift Blue |
| Category | Processed fish, meat and egg products |
| Sub-category | Fish products |
| Market | Vietnam |
| Store name | Emart |
| Store type | Mass merchandise / hypermarket |
| Date published | December 2022 |
| Launch type | New variety / range extension |
| Price in local currency | VND79,000.00 |
| Price in US dollars | 3.24 |
| Price in Euros | 3.08 |
Ocean Gift Blue Ca Hong Dai Duong Phi Le (Ocean Snapper Fillets) are now available, and retail in a 250 gram pack. - Pack bears cooking instructions
Opportunities for Canada
How the CPTPP helps Canada-Vietnam trade and investment
The agreement is currently in force among 10 countries: Canada, Australia, Chile, Japan, Malaysia, Mexico, New Zealand, Peru, Singapore and Vietnam.
The CPTPP provides a rules-based trading environment and enhanced market access for exporters and investors, and establishes duty-free access for trade in goods between Canada and Vietnam, eliminating tariffs for key Canadian exports, including:
- agricultural goods:
- beef (tariffs of up to 31% on fresh, chilled and frozen beef will be eliminated within two years, and tariffs of up to 34% on all other beef products will be eliminated within seven years)
- pork (tariffs of up to 31% on fresh, chilled, frozen and prepared pork products will be eliminated within nine years)
- canola (tariffs of 5% on canola seed were eliminated upon entry into force, while tariffs of up to 20% on canola oil will be eliminated within seven years) and
- ice wine and whisky (tariffs of up to 56% will be eliminated within 10 years).
- fish and seafood products:
- lobster (tariffs of up to 34% on prepared lobster will be eliminated within three years)
- salmon (tariffs of up to 18% on fresh, chilled and frozen salmon were eliminated upon entry into force) and
- fish fillets (tariffs of up to 18% on frozen fish fillets were eliminated upon entry into force)
- (CPTPP partner: Vietnam)
In addition, please consult the Canada Tariff Finder to explore tariff information for the Vietnam market, and other countries with which Canada has a free trade agreement.
For more information
The Canadian Trade Commissioner Service:
International Trade Commissioners can provide Canadian industry with on-the-ground expertise regarding market potential, current conditions and local business contacts, and are an excellent point of contact for export advice.
More agri-food market intelligence:
International agri-food market intelligence
Discover global agriculture and food opportunities, the complete library of Global Analysis reports, market trends and forecasts, and information on Canada's free trade agreements.
Agri-food market intelligence service
Canadian agri-food and seafood businesses can take advantage of a customized service of reports and analysis, and join our email subscription service to have the latest reports delivered directly to their inbox.
More on Canada's agriculture and agri-food sectors:
Canada's agriculture sectors
Information on the agriculture industry by sector. Data on international markets. Initiatives to support awareness of the industry in Canada. How the department engages with the industry.
For information on the Canadian Delicacies Program, please contact:
The Trade Commissioner Service in Vietnam
agriculture-vietnam@international.gc.ca
Resources
- Euromonitor International, 2023
- Global Trade Tracker, 2023
- Mintel Global New Products Database, 2023
Sector Trend Analysis – Fish and seafood trends in Vietnam
Global Analysis Report
Prepared by: Hongli Wang, Senior Market Analyst
© His Majesty the King in Right of Canada, represented by the Minister of Agriculture and Agri-Food (2023).
Photo credits
All photographs reproduced in this publication are used by permission of the rights holders.
All images, unless otherwise noted, are copyright His Majesty the King in Right of Canada.
To join our distribution list or to suggest additional report topics or markets, please contact:
Agriculture and Agri-Food Canada, Global Analysis1341 Baseline Rd, Tower 5, 3rd floor
Ottawa ON K1A 0C5
Canada
Email: aafc.mas-sam.aac@agr.gc.ca
The Government of Canada has prepared this report based on primary and secondary sources of information. Although every effort has been made to ensure that the information is accurate, Agriculture and Agri-Food Canada (AAFC) assumes no liability for any actions taken based on the information contained herein.
Reproduction or redistribution of this document, in whole or in part, must include acknowledgement of agriculture and agri-food Canada as the owner of the copyright in the document, through a reference citing AAFC, the title of the document and the year. Where the reproduction or redistribution includes data from this document, it must also include an acknowledgement of the specific data source(s), as noted in this document.
Agriculture and Agri-Food Canada provides this document and other report services to agriculture and food industry clients free of charge.