

Note: This report includes forecasting data that is based on baseline historical data.
Executive summary
Over the last five years of available data, the health and wellness (H&W) food and beverage sector has grown faster in India (7.7% CAGR) than in the rest of Asia. Sales of health and wellness food and beverages reached US$10.3 billion in 2021, which made India the 15th largest health and wellness market in the world. Growth is forecasted to accelerate through 2026, with 8.8% forecasted CAGR from 2021-2026.
Health and wellness beverages are gaining market share in India: they represented about a fifth of the total health and wellness food and beverages market in 2016, and a little more than a quarter of the market in 2021. By 2026, they are expected to represent more than a third of the market.
The Fortified/Functional (FF) market category was the largest health and wellness market category for beverages in India in 2021, and the second-largest for packaged food, just behind naturally healthy (NH) food. Naturally healthy packaged food overtook fortified/functional packaged food due to its faster growth over the 2016 to 2021 period. Due to their high forecasted growth, naturally healthy beverages are expected to overtake fortified/functional beverages by the end of 2026. fortified/functional will remain the second-largest market category for both packaged food and beverages.
The fortified/functional packaged food market in India is highly concentrated: the top three companies had a combined market share of 57.2% in 2021. This concentration is even more stark for beverages, where the top company, Unilever, had a 51.9% market share due to its acquisition of the Horlicks meal replacement and Boost energy drink brands. The next two companies (Mondelez and Red Bull) had a combined market share of 18.6%, such that the top three fortified/functional beverage companies had a 70.5% market share.
Companies looking to market products in India should be aware of the market's unique features. A majority of fortified/functional food and beverage products are sold through independent small grocers. India has a mandatory labeling system to distinguish vegetarian from non-vegetarian products. The four new product launches featured in this report all have the vegetarian green dot.
Market overview
Health and wellness (H&W) designates the combination of organic food and beverages, fortified/functional (FF) food and beverages, naturally healthy (NH) food and beverages, better for you (BFY) food and beverages and food intolerance products.
The health and wellness sector has grown steadily in India over the past five years. Growth in India has outpaced growth in the rest of the Asia-Pacific region and world growth. In 2021, India's health and wellness market grew by 5.75% year-over-year, while Asia-Pacific growth was 3.74% year-over-year and world growth was 1% year-over-year. According to Euromonitor, India was the 15th largest health and wellness market in the world by market size in 2021, behind Indonesia and ahead of the Netherlands. Given India's population, it is likely that the market still has significant room to grow.
In 2021, packaged foods represented 73.3% of the total Indian health and wellness market. Naturally healthy and fortified and functional products are the most important packaged food market segments. Organic food is the fastest growing packaged food segment, while naturally healthy foods had the largest total dollar growth among packaged food products.
| Category | 2016 | 2021 | CAGR* % 2016-2021 | 2022 | 2026 | CAGR* % 2021-2026 |
|---|---|---|---|---|---|---|
| Health and wellness | 7,097.3 | 10,274.1 | 7.7 | 11,169.7 | 15,678.6 | 8.8 |
| Naturally Healthy (NH) | 2,840.3 | 4,620.0 | 10.2 | 5,126.4 | 7,909.6 | 11.4 |
| Fortified/Functional (FF) | 3,746.6 | 4,842.6 | 5.3 | 5,105.4 | 6,218.4 | 5.1 |
| Free From | 22.6 | 27.4 | 3.9 | 27.7 | 28.2 | 0.6 |
| Better For You (BFY) | 432.0 | 679.9 | 9.5 | 789.3 | 1,307.6 | 14.0 |
| Organic | 55.8 | 104.3 | 13.3 | 120.9 | 214.9 | 15.6 |
|
Source: Euromonitor International, 2023 *CAGR: compound annual growth rate |
||||||
| Category | 2016 | 2021 | CAGR* % 2016-2021 | 2022 | 2026 | CAGR* % 2021-2026 |
|---|---|---|---|---|---|---|
| HW packaged food | 4,053.3 | 7,528.3 | 13.2 | 8,558.6 | 13,732.5 | 12.8 |
| FF Packaged Food | 1,935.4 | 3,253.8 | 10.9 | 3,606.8 | 5,283.3 | 10.2 |
| Free From Products | 17.6 | 27.4 | 9.3 | 29.1 | 35.4 | 5.3 |
| NH Packaged Food | 1,762.1 | 3,554.8 | 15.1 | 4,077.3 | 6,734.8 | 13.6 |
| BFY Packaged Food | 330.1 | 674.0 | 15.3 | 822.6 | 1,634.1 | 19.4 |
| Organic Packaged Food | 8.1 | 18.4 | 17.9 | 22.8 | 44.9 | 19.5 |
|
Source: Euromonitor International, 2023 *CAGR: compound annual growth rate |
||||||
| Category | 2016 | 2021 | CAGR* % 2016-2021 | 2022 | 2026 | CAGR* % 2021-2026 |
|---|---|---|---|---|---|---|
| HW beverages | 1,464.7 | 2,745.8 | 13.4 | 3,169.6 | 5,947.2 | 16.7 |
| NH Beverages | 446.1 | 1,065.2 | 19.0 | 1,305.4 | 3,193.3 | 24.6 |
| FF Beverages | 977.5 | 1,588.8 | 10.2 | 1,753.9 | 2,521.9 | 9.7 |
| BFY Beverages | 5.8 | 5.9 | 0.5 | 6.1 | 7.2 | 4.0 |
| Organic Beverages | 35.3 | 85.9 | 19.5 | 104.2 | 224.9 | 21.2 |
|
Source: Euromonitor International, 2023 *CAGR: compound annual growth rate |
||||||
Beverages represented 26.7% of the total health and wellness market in 2021. This represents an increase in market share; in 2016, beverages were only 20.6% of the Indian health and wellness market. As with packaged food, naturally healthy and fortified and functional products are the most important beverage market segments. With 19% CAGR from 2016 to 2021, naturally healthybeverages were the second-fastest growing health and wellness market segment, just behind organic beverages, which are still a small part of the market. Additionally, naturally healthy beverages are forecasted to be the fastest-growing market segment through 2026.
Retail sales
Functional / fortified packaged food sales reached US$3.3 billion in 2021, up from US$2.5 billion in 2016. Snack bars were the fastest-growing category, but were also the smallest market.
Among functional / fortified packaged foods, the largest category in India in 2021 was vegetable and seed oil. Growth has been steady, at 4.9% CAGR between 2016 and 2021, and is forecasted to remain steady, at 4.0% CAGR through 2026.
Functional / fortified dairy was the second-largest category among Indian packaged food in 2021 (US$612 million). A majority (77%) was powder milk. Dairy grew by 11.2% CAGR from 2016 to 2021. The fastest-growing market segment for dairy was yogurt, which grew at 18.1% CAGR. Dairy is forecasted to grow at a steady rate through 2026. Most of the growth will be in the milk and yogurt categories; powdered milk is forecasted to grow at 2.2% CAGR. Fortified/functional baby food, which grew at 5.8% CAGR from 2016 to 2021, consists entirely of milk formula.
| Category | 2016 | 2021 | CAGR* % 2016-2021 | 2022 | 2026 | CAGR* % 2021-2026 |
|---|---|---|---|---|---|---|
| Total functional / fortified packaged food | 2,489.4 | 3,253.8 | 5.5 | 3,435.0 | 4,209.2 | 5.3 |
| FF Baby Food | 384.3 | 510.6 | 5.8 | 531.7 | 621.3 | 4.0 |
| FF Breakfast Cereals | 209.8 | 243.8 | 3.0 | 289.2 | 501.1 | 15.5 |
| FF Bread | 177.7 | 255.8 | 7.6 | 272.9 | 329.6 | 5.2 |
| FF Confectionery | 178.7 | 197.7 | 2.0 | 203.0 | 233.6 | 3.4 |
| FF Chocolate Confectionery | 39.1 | 55.4 | 7.2 | 58.6 | 76.1 | 6.6 |
| FF Gum | 34.6 | 35.1 | 0.3 | 35.8 | 38.5 | 1.9 |
| FF Sugar Confectionery | 105.0 | 107.2 | 0.4 | 108.7 | 119.1 | 2.1 |
| FF Dairy | 360.2 | 612.4 | 11.2 | 647.2 | 784.3 | 5.1 |
| FF Milk | 43.8 | 81.8 | 13.3 | 94.4 | 163.0 | 14.8 |
| FF Powder Milk | 291.8 | 474.1 | 10.2 | 488.9 | 528.3 | 2.2 |
| FF Yogurt | 24.6 | 56.5 | 18.1 | 63.8 | 93.0 | 10.5 |
| FF Sweet Biscuits, Snack Bars and Fruit Snacks | 519.5 | 598.2 | 2.9 | 617.3 | 720.7 | 3.8 |
| FF Sweet Biscuits | 515.8 | 588.7 | 2.7 | 606.4 | 700.6 | 3.5 |
| FF Snack Bars | 3.6 | 9.5 | 21.2 | 11.0 | 20.1 | 16.2 |
| FF Vegetable and Seed Oil | 659.1 | 835.3 | 4.9 | 873.8 | 1,018.5 | 4.0 |
|
Source: Euromonitor International, 2023 *CAGR: compound annual growth rate |
||||||
Fortified/functional breakfast cereals had slow growth from 2016 to 2021 but are forecasted to more than double in market size through 2026. This will outpace constant-value growth for breakfast cereals in general, and reflects a general increase in the desire of Indian consumers for healthier and more nutritious options (Euromonitor, January 2023).
| Category | 2016 | 2021 | CAGR* % 2016-2021 | 2022 | 2026 | CAGR* % 2021-2026 |
|---|---|---|---|---|---|---|
| Total functional / fortified beverages | 1,257.3 | 1,588.8 | 4.8 | 1,670.4 | 2,009.2 | 4.8 |
| FF Hot Drinks | 1,001.2 | 1,300.8 | 5.4 | 1,370.0 | 1,646.9 | 4.8 |
| FF Soft Drinks | 256.1 | 288.0 | 2.4 | 300.4 | 362.3 | 4.7 |
| FF Concentrates | 120.9 | 130.8 | 1.6 | 134.8 | 151.5 | 3.0 |
| FF Liquid Concentrates | 55.7 | 51.7 | −1.5 | 51.5 | 50.4 | −0.5 |
| FF Powder Concentrates | 65.2 | 79.0 | 3.9 | 83.3 | 101.1 | 5.1 |
| FF Energy Drinks | 99.9 | 100.2 | 0.1 | 101.8 | 109.0 | 1.7 |
| FF Sports Drinks | 35.2 | 57.0 | 10.1 | 63.8 | 101.8 | 12.3 |
|
Source: Euromonitor International, 2023 *CAGR: compound annual growth rate |
||||||
In India, fortified/functional beverages grew slightly more slowly than functional / fortified packaged food from 2016 to 2021, and this trend is forecasted to continue through 2026.
The entirety of the functional / fortified hot beverage market in India consists of plant-based and malt-based hot drinks. It is the largest market category for functional / fortified beverages (82% in 2021), and has grown in line with the rest of the market. Sports drinks are the fastest-growing functional / fortified category, but they were also the smallest category in 2021. The functional / fortified energy drink market is twice the size of the functional / fortified sports drink market. However, it has not experienced significant growth between 2016 and 2021, and it is not forecasted to grow through 2026. As such, functional / fortified sports drinks are forecasted to only be a slightly smaller market than functional / fortified energy drinks in 2026.
The concentrates subcategory of functional / fortified soft drinks experienced slight growth from 2016 to 2021, and is forecasted to grow at a slightly faster rate through 2026. Growth in powder concentrates was offset by decreased liquid concentrates sales. This shift from liquid to powder concentrates is forecasted to continue through 2026.
Distribution channels
In India, almost all functional / fortified food and beverages were sold through grocery retailers, and these sales occurred primarily though traditional grocery stores. E-commerce grew significantly from 2016 to 2021, but still remains miniscule compared to store-based retailing.
Functional / fortified foods and beverages were distributed mainly through store-based retailing at 88.7% in 2016 but slightly decreased to 88.3% in 2021. Non-store retailing, though represented 11.3% in 2016, but increased to 11.7% in 2021. Especially the E-Commerce recorded the fastest CAGR growth at 3.2% in actual retail value table or 2.9% in per centage table from 2016 to 2021, reaching US$985.6 million in 2021.
| Channel | 2016 | 2017 | 2018 | 2019 | 2020 | 2021 | CAGR* % 2016-2021 |
|---|---|---|---|---|---|---|---|
| Store-Based Retailing | 2,911.5 | 3,279.1 | 3,617.8 | 4,002.4 | 4,383.3 | 4,811.3 | 11.0 |
| Grocery Retailers | 2,911.5 | 3,279.1 | 3,617.8 | 4,002.4 | 4,383.3 | 4,811.3 | 11.0 |
| Modern Grocery Retailers | 472.5 | 542.0 | 611.1 | 685.8 | 790.9 | 884.0 | 13.0 |
| Convenience Stores | 45.5 | 49.0 | 53.0 | 58.3 | 62.1 | 68.4 | 9.0 |
| Forecourt Retailers | 54.3 | 62.6 | 71.7 | 81.2 | 90.5 | 101.8 | 13.0 |
| Hypermarkets | 106.1 | 124.5 | 143.8 | 165.4 | 205.2 | 230.6 | 17.0 |
| Supermarkets | 266.6 | 305.9 | 342.6 | 380.8 | 433.1 | 483.2 | 13.0 |
| Traditional Grocery Retailers | 2,439.0 | 2,737.1 | 3,006.8 | 3,316.6 | 3,592.4 | 3,927.3 | 10.0 |
| Independent Small Grocers | 2,280.6 | 2,559.6 | 2,812.2 | 3,108.0 | 3,374.8 | 3,682.2 | 10.0 |
| Other Grocery Retailers | 158.4 | 177.5 | 194.6 | 208.6 | 217.6 | 245.1 | 9.0 |
| Non-Store Retailing | 1.5 | 4.6 | 27.4 | 10.4 | 24.7 | 31.2 | 85.0 |
| E-Commerce | 1.5 | 4.6 | 27.4 | 10.4 | 24.7 | 31.2 | 85.0 |
| Total | 2,912.9 | 3,283.7 | 3,645.2 | 4,012.8 | 4,407.9 | 4,842.6 | 11.0 |
|
Source: Euromonitor International, 2023 *CAGR: compound annual growth rate |
|||||||
| Channel | 2016 | 2017 | 2018 | 2019 | 2020 | 2021 | CAGR* % 2016-2021 |
|---|---|---|---|---|---|---|---|
| Store-Based Retailing | 100 | 99.9 | 99.2 | 99.7 | 99.4 | 99.4 | 0.0 |
| Grocery Retailers | 100 | 99.9 | 99.2 | 99.7 | 99.4 | 99.4 | 0.0 |
| Modern Grocery Retailers | 16.2 | 16.5 | 16.8 | 17.1 | 17.9 | 18.3 | 2.0 |
| Convenience Stores | 1.6 | 1.5 | 1.5 | 1.5 | 1.4 | 1.4 | −2.0 |
| Forecourt Retailers | 1.9 | 1.9 | 2.0 | 2.0 | 2.1 | 2.1 | 2.0 |
| Hypermarkets | 3.6 | 3.8 | 3.9 | 4.1 | 4.7 | 4.8 | 6.0 |
| Supermarkets | 9.2 | 9.3 | 9.4 | 9.5 | 9.8 | 10.0 | 2.0 |
| Traditional Grocery Retailers | 83.7 | 3.4 | 82.5 | 82.7 | 81.5 | 81.1 | −1.0 |
| Independent Small Grocers | 78.3 | 77.9 | 77.1 | 77.5 | 76.6 | 76.0 | −1.0 |
| Other Grocery Retailers | 5.4 | 5.4 | 5.3 | 5.2 | 4.9 | 5.1 | −1.0 |
| Non-Store Retailing | 0.0 | 0.1 | 0.8 | 0.3 | 0.6 | 0.6 | 67.0 |
| E-Commerce | 0.0 | 0.1 | 0.8 | 0.3 | 0.6 | 0.6 | 67.0 |
| Total | 100 | 100 | 100 | 100 | 100 | 100 | 0.0 |
|
Source: Euromonitor International, 2023 *CAGR: compound annual growth rate |
|||||||
Top company retail shares
In 2021, the leading companies in the functional / fortified packaged food category were Britannia Industries (22.9%), Cargill (19.4%) and the Gujarat co-operative Milk Marketing Federation (which markets its products under the Amul brand name, and has a 14.9% market share). Britannia sells biscuits and baked goods, whereas Cargill's two most important brands are packaged oil products. Other notable international companies in the functional / fortified packaged food category include Nestlé (8.4%) and Kellogg (4.7%).
| Company name | 2016 | 2017 | 2018 | 2019 | 2020 | 2021 | CAGR* % 2016-2021 | Market share (%) in 2021 |
|---|---|---|---|---|---|---|---|---|
| Britannia Industries Ltd | 456.7 | 503.6 | 560.4 | 603.5 | 689.8 | 746.2 | 10.3 | 22.9 |
| Cargill Inc | 351.5 | 414.6 | 476.8 | 515.1 | 568.7 | 631.3 | 12.4 | 19.4 |
| Gujarat Co-operative Milk Marketing Federation Ltd | 225.1 | 278.3 | 321.8 | 368.9 | 441.3 | 483.5 | 16.5 | 14.9 |
| Nestlé SA | 168.0 | 186.0 | 205.8 | 227.5 | 247.7 | 273.6 | 10.2 | 8.4 |
| Kellogg Co | 124.9 | 137.0 | 139.7 | 145.7 | 151.1 | 154.3 | 4.3 | 4.7 |
| ConAgra Brands Inc | 58.0 | 64.6 | 74.3 | 79.5 | 87.3 | 96.6 | 10.7 | 3.0 |
| Groupe Danone | 53.6 | 52.1 | 57.1 | 63.7 | 70.6 | 77.4 | 7.7 | 2.4 |
| Abbott Laboratories Inc | 30.2 | 36.4 | 44.0 | 56.5 | 64.8 | 73.3 | 19.4 | 2.3 |
| Patanjali Ayurved Ltd | 48.4 | 53.3 | 58.9 | 1.8 | ||||
| Procter & Gamble Co | 41.7 | 43.1 | 45.4 | 47.2 | 49.9 | 53.3 | 5.1 | 1.6 |
|
Source: Euromonitor International, 2023 *CAGR: compound annual growth rate |
||||||||
Unilever has been the leading functional / fortified beverages company in India since 2019. In December 2018, Unilever acquired the Horlicks and Boost brands from GlaxoSmithKline (Reuters, 2018). Horlicks accounts for 40% of the Indian functional / fortified beverages market, and Boost is an additional 10%. Prior to these acquisitions, Unilever was a marginal player in the Indian functional / fortified beverages market. Its flagship product was Kissan-brand juice, which held and continues to hold about a 2% market share. The functional / fortified beverage sector in India is highly concentrated: eight companies account for 82% of the Indian market, with no other company having a statistically significant market share. As a result of its acquisitions, Unilever grew 107% CAGR from 2016 to 2021.
| Company name | 2016 | 2017 | 2018 | 2019 | 2020 | 2021 | CAGR* % 2016-2021 | Market share (%) in 2021 |
|---|---|---|---|---|---|---|---|---|
| Unilever Group | 21.7 | 22.0 | 22.6 | 683.9 | 745.7 | 823.8 | 107 | 51.9 |
| Mondelez International Inc | 137.0 | 141.4 | 153.5 | 165.6 | 181.8 | 206.8 | 8.6 | 13.0 |
| Red Bull GmbH | 68.5 | 72.4 | 77.6 | 82.1 | 84.8 | 89.5 | 5.5 | 5.6 |
| Pioma Industries Ltd | 38.0 | 39.2 | 43.9 | 47.8 | 51.5 | 57.2 | 8.5 | 3.6 |
| PepsiCo Inc | 22.6 | 29.0 | 40.7 | 49.4 | 43.8 | 54.6 | 19.3 | 3.4 |
| GlaxoSmithKline Plc | 574.9 | 595.4 | 645.1 | 35.8 | 39.4 | 43.6 | −40.3 | 2.7 |
| Hamdard Wakf Laboratories Ltd | 19.5 | 19.9 | 20.6 | 21.3 | 22.1 | 23.1 | 3.4 | 1.5 |
| Goldwin Healthcare Pvt Ltd | 1.5 | 1.6 | 1.7 | 1.8 | 1.9 | 2.0 | 5.7 | 0.1 |
|
Source: Euromonitor International, 2023 *CAGR: compound annual growth rate |
||||||||
New product launch analysis
According to Mintel's Global New Products Database (GNPD), there were 8,961 launches of functional food and beverage products in India between January 2018 and December 2022. 6,084 of these products were functional food and 2,877 products were functional beverages. The number of new packaged food launches is increasing, while the number of new functional beverage launches is decreasing.

Description of above image
| Date published | Number of food | Number of beverages |
|---|---|---|
| 2018 | 983 | 670 |
| 2019 | 1,111 | 553 |
| 2020 | 1,258 | 551 |
| 2021 | 1,349 | 574 |
| 2022 | 1,383 | 529 |
| Total Sample | 6,084 | 2,877 |
Examples of new product launches
High Bran Biscuits
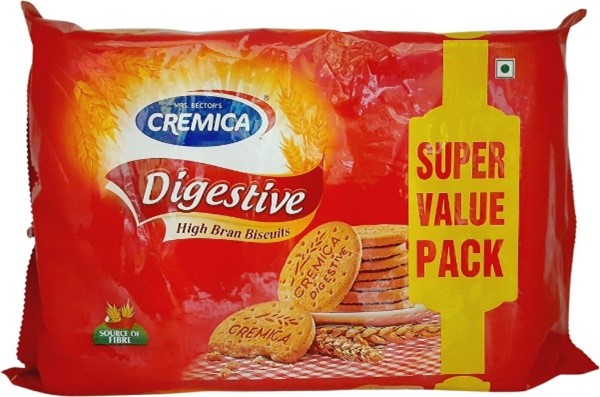
Source: Mintel, 2023
| Company | Mrs. Bectors Food Specialities |
|---|---|
| Brand | Mrs. Bector's Cremica Digestive |
| Category | Bakery |
| Sub-category | Sweet biscuits / cookies |
| Market | India |
| Import status | Not imported |
| Store type | Supermarket |
| Date published | December 2022 |
| Launch type | New packaging |
| Price in local currency | INR120.00 |
| Price in US dollars | 1.45 |
| Price in Euros | 1.37 |
Mrs. Bector's Cremica Digestive High Bran Biscuits have been repacked in an updated (200 gram by 5) 1 kilogram super value pack. - Slightly savoury biscuit with crumbly texture and a simple flavour - Logos and certifications: FSSAI, Facebook, Vegetarian green dot.
Premium Masoor Lentils

Source: Mintel, 2023
| Company | 24Carat Food |
|---|---|
| Brand | Suraj Pulses Premium |
| Category | Fruit and vegetables |
| Sub-category | Vegetables |
| Market | India |
| Import status | Not imported |
| Store name | Amazon.in |
| Date published | November 2020 |
| Launch type | New product |
| Price in local currency | INR195.00 |
| Price in US dollars | 2.61 |
| Price in Euros | 2.21 |
Suraj Pulses Premium Premium Masoor Dal (Premium Masoor Lentils) are now available. The vegetarian product retails in a 500 gram pack.
Pineapple Flavour Isotonic Energy Drink

Source: Mintel, 2023
| Company | Xpresshop Online Store |
|---|---|
| Manufacturer | Rektron Healthcare |
| Brand | HealthXP Premium Series |
| Category | Sports and energy drinks |
| Sub-category | Energy drinks |
| Market | India |
| Date published | December 2022 |
| Launch type | New product |
| Price in local currency | INR379.00 |
| Price in US dollars | 4.65 |
| Price in Euros | 4.51 |
HealthXP Premium Series Pineapple Flavour Isotonic Energy Drink is now available, and retails in a 1 kilogram pack. - Added zero sugar - 29 servings per pack - Logos and certifications: GMP, HACCP, ISO 2001, Vegetarian green dot, FSSAI, Instagram link
Cafe Mocha Flavored Plant Power Premium Plant Protein
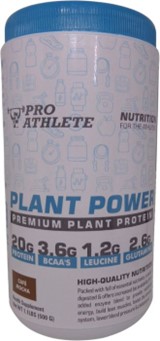
Source: Mintel, 2023
| Company | Proathlete |
|---|---|
| Brand | Pro Athlete |
| Category | Nutritional drinks and other beverages |
| Sub-category | Nutritional and meal replacement drinks |
| Market | India |
| Import status | Not imported |
| Store name | Amazon |
| Date published | September 2022 |
| Launch type | New variety / range extension |
| Price in local currency | INR1049.00 |
| Price in US dollars | 13.17 |
| Price in Euros | 13.04 |
Pro Athlete Cafe Mocha Flavored Plant Power Premium Plant Protein is now available and retails in a 500 gram pack. - Nutrition for athletes- Contains 20 grams protein, 3.6 grams BCAA's, 1.2 grams leucine, 2.6 grams glutamine - Foiled sealed for freshness - Contains no doping ingredients, soy, lactose, gluten, artificial colours, sugar added - Suitable for active men and women- Combining pea protein isolate, brown rice protein provides a complete profile of essential amino acids to support muscle growth and recovery - Vegan- Logos and certifications: Vegetarian green dot, FSSAI Safety Assured Registered, WhatsApp.
For more information
The Canadian Trade Commissioner Service:
International Trade Commissioners can provide Canadian industry with on-the-ground expertise regarding market potential, current conditions and local business contacts, and are an excellent point of contact for export advice.
More agri-food market intelligence:
International agri-food market intelligence
Discover global agriculture and food opportunities, the complete library of Global Analysis reports, market trends and forecasts, and information on Canada's free trade agreements.
Agri-food market intelligence service
Canadian agri-food and seafood businesses can take advantage of a customized service of reports and analysis, and join our email subscription service to have the latest reports delivered directly to their inbox.
More on Canada's agriculture and agri-food sectors:
Canada's agriculture sectors
Information on the agriculture industry by sector. Data on international markets. Initiatives to support awareness of the industry in Canada. How the department engages with the industry.
For additional information on the Food Ingredients & Health Ingredients (FIHI) trade show, which will take place from August 17-19 2023, please contact
Kesha Dhruv
Counsellor (Agriculture and Food) and Trade Commissioner
The Consulate General of Canada, Mumbai
Government of Canada
CanadainIndia.Agri@international.gc.ca
Resources
- Euromonitor International, 2023
- Global Trade Tracker, 2023
- Mintel Global New Products Database, 2023
- Breakfast Cereals in India - Euromonitor International, January 2023
- Unilever swallows GSK's Indian Horlicks business for $3.8 billion – Reuters, December 2018
Health and wellness series – Functional foods and beverages in India
Global Analysis Report
Prepared by: Alexandre Holm Perrault, Market Analyst
© His Majesty the King in Right of Canada, represented by the Minister of Agriculture and Agri-Food (2023).
Photo credits
All photographs reproduced in this publication are used by permission of the rights holders.
All images, unless otherwise noted, are copyright His Majesty the King in Right of Canada.
To join our distribution list or to suggest additional report topics or markets, please contact:
Agriculture and Agri-Food Canada, Global Analysis1341 Baseline Rd, Tower 5, 3rd floor
Ottawa ON K1A 0C5
Canada
Email: aafc.mas-sam.aac@agr.gc.ca
The Government of Canada has prepared this report based on primary and secondary sources of information. Although every effort has been made to ensure that the information is accurate, Agriculture and Agri-Food Canada (AAFC) assumes no liability for any actions taken based on the information contained herein.
Reproduction or redistribution of this document, in whole or in part, must include acknowledgement of agriculture and agri-food Canada as the owner of the copyright in the document, through a reference citing AAFC, the title of the document and the year. Where the reproduction or redistribution includes data from this document, it must also include an acknowledgement of the specific data source(s), as noted in this document.
Agriculture and Agri-Food Canada provides this document and other report services to agriculture and food industry clients free of charge.