

Note: This report includes forecasting data that is based on baseline historical data.
Executive summary
In 2022, Japan imported a total of US$449.2 million of pasta products (including noodles) from the world (7th largest market). Top suppliers to Japan over the year, were Italy at a market share of 21.9%, South Korea (21.7%), and China (15.9%).
Canada was Japan's 23rd largest supplier, accounting for a small import value of US$204.6 thousand and increasing by a compound annual growth rate (CAGR) of 31.8% (2018 to 2022). For Canada to better succeed in the trade of noodles or pasta within foreign countries, they must offer competitive prices that are comparable to Japan's neighbouring and European markets, that is, Italy.
Internationally, Euromonitor reports that retail sales of noodles were the highest within the Asia Pacific (APAC) region - consuming a total global value of US$51.9 billion (market share: 80.8%) in 2022. Japan was the 2nd largest consumer of noodle products in the APAC region after China, growing at a steady rate of sales at US$8.9 billion in 2023. Instant noodle cups in Japan were the highest in demand by 48.0% over the year, followed by instant noodle pouches (16.1%), chilled noodles (16.1%), plain noodles (12.9%), and frozen noodles (6.8%).
In 2023, leading packaged food companies (brands) of noodle/pasta products in Japan included Nissin Foods Holdings Company Ltd. (Nissin, Myojo), Toyo Suisan Kaisha Ltd. (Maruchan), Sanyo Foods Co Ltd. (Sapporo Ichiban), Shimadaya Co Ltd. (Shimadaya), and Ace Cook Co Ltd.(Super Cup). Private label noodle companies accounted for 8.0% of sales. Japanese grocery retailers distributed most of the noodle products by a market share of 80.2% (US$7.2 billion), mainly within supermarkets, convenience stores, and hypermarkets in 2023.
In the APAC region, several product launches in the category are highlighting their presence on social media channels and there is a bigger focus on pasta, rice, and noodles that are high in protein content. Top flavour components found in these noodle products were soy/soya sauce or Shoyu, spice/spicy, Miso, salt/salted, Tonkotsu/ pork bone/pork marrow, chicken, curry, seafood, Tantan/Dandan, and pork.
Trade overview
In 2022, Japan was the 7th largest importer in the world for pasta products (including noodles, spaghetti, macaroni, lasagne, gnocchi, ravioli, cannelloni; couscous) at an import value of US$449.2 million. The top global importers of pasta were the United States at a market share of 13.1%, followed by Germany (8.7%), the United Kingdom (8.1%), France (7.8%), and the Netherlands (5.0%) in 2022. Canada was the 6th largest importer over the year at a global value of US$616.0 million, which has been increasing by a CAGR of 12.8% between 2018 and 2022.
Japan's top suppliers of pasta products were Italy at an import value of US$98.5 million, followed by South Korea (US$97.6 million), China (US$71.6 million), Turkey (US$60.4 million), and the United States (US$35.6 million) in 2022. Japan's largest pasta commodities imported in 2022, were uncooked pasta, not stuffed or otherwise prepared, not containing eggs (HS:190219) at a market share of 67.9%; followed by 17.5% of pasta, cooked or otherwise prepared, excluding stuffed (HS:190230), and 14.3% of pasta, stuffed with meat or other substances, whether or not cooked or otherwise prepared (HS:190220).
| Country | 2018 | 2019 | 2020 | 2021 | 2022 | CAGR* % 2018-2022 |
|---|---|---|---|---|---|---|
| Total - global importers | 9,164.1 | 9,432.7 | 10,766.2 | 11,326.6 | 12,641.6 | 8.4 |
| 1. United States | 985.1 | 1,012.4 | 1,362.8 | 1,252.7 | 1,660.0 | 13.9 |
| 2. Germany | 828.3 | 803.4 | 907.4 | 988.6 | 1,098.4 | 7.3 |
| 3. United Kingdom | 545.9 | 642.4 | 740.3 | 849.9 | 1,023.5 | 17.0 |
| 4. France | 716.8 | 714.8 | 787.9 | 886.2 | 989.5 | 8.4 |
| 5. Netherlands | 356.9 | 366.7 | 381.8 | 478.7 | 627.8 | 15.2 |
| 6. Canada | 380.6 | 427.0 | 507.4 | 499.7 | 616.0 | 12.8 |
| 7. Japan | 322.8 | 333.1 | 411.3 | 400.9 | 449.2 | 8.6 |
| 8. Australia | 251.2 | 264.5 | 327.5 | 305.1 | 387.5 | 11.4 |
| 9. China | 246.8 | 280.6 | 340.1 | 346.2 | 359.2 | 9.8 |
| 10. Belgium | 252.8 | 248.5 | 264.2 | 291.1 | 333.2 | 7.1 |
| Subtotal - top 10 importers | 4,887.2 | 5,093.4 | 6,030.6 | 6,299.0 | 7,544.2 | 11.5 |
|
Source: Global Trade Tracker, 2023 *CAGR: Compound Annual Growth Rate |
||||||
| Country | 2018 | 2019 | 2020 | 2021 | 2022 | CAGR* % 2018-2022 |
|---|---|---|---|---|---|---|
| Total - global suppliers | 322.8 | 333.1 | 411.3 | 400.9 | 449.2 | 8.6 |
| 1. Italy | 82.0 | 85.4 | 106.1 | 95.7 | 98.5 | 4.7 |
| 2. South Korea | 42.4 | 51.3 | 76.9 | 100.3 | 97.6 | 23.2 |
| 3. China | 68.0 | 65.5 | 69.1 | 67.6 | 71.6 | 1.3 |
| 4. Turkey | 40.3 | 40.4 | 51.8 | 39.4 | 60.4 | 10.6 |
| 5. United States | 30.0 | 27.4 | 30.9 | 27.6 | 35.6 | 4.4 |
| 6. Thailand | 25.7 | 28.3 | 28.5 | 29.6 | 34.3 | 7.4 |
| 7. Vietnam | 21.1 | 21.4 | 27.5 | 24.1 | 30.9 | 10.1 |
| 8. Greece | 2.4 | 2.1 | 3.0 | 1.9 | 4.3 | 15.4 |
| 9. Belgium | 2.7 | 2.9 | 4.1 | 2.7 | 3.7 | 7.9 |
| 10. Taiwan | 2.4 | 2.3 | 2.3 | 2.8 | 3.0 | 5.9 |
| Subtotal - top 10 suppliers | 317.1 | 327.0 | 400.2 | 391.7 | 439.9 | 8.5 |
| Canada (23rd) | 0.068 | 0.071 | 0.112 | 0.215 | 0.205 | 31.8 |
|
Source: Global Trade Tracker, 2023 *CAGR: Compound Annual Growth Rate |
||||||
| HS Code | Description | 2018 | 2019 | 2020 | 2021 | 2022 | CAGR* % 2018-2022 |
|---|---|---|---|---|---|---|---|
| 1902 | Total - Pasta, whether or not cooked or stuffed with meat or other substances or otherwise prepared, such as spaghetti, macaroni, noodles, lasagne, gnocchi, ravioli, cannelloni; couscous | 322.8 | 333.1 | 411.3 | 400.9 | 449.2 | 8.6 |
| 190219 | Uncooked pasta, not stuffed or otherwise prepared, not containing eggs | 239.0 | 238.6 | 289.3 | 263.6 | 305.1 | 6.3 |
| 190230 | Pasta, cooked or otherwise prepared (excluding stuffed) | 39.7 | 47.1 | 69.5 | 83.2 | 78.7 | 18.7 |
| 190220 | Pasta, stuffed with meat or other substances, whether or not cooked or otherwise prepared | 42.9 | 46.4 | 51.1 | 52.6 | 64.1 | 10.6 |
| 190211 | Uncooked pasta, not stuffed or otherwise prepared, containing eggs | 1.0 | 0.769 | 1.0 | 1.2 | 1.0 | −1.7 |
| 190240 | Couscous, whether or not prepared | 0.267 | 0.229 | 0.383 | 0.290 | 0.295 | 2.5 |
|
Source: Global Trade Tracker, 2023 *CAGR: Compound Annual Growth Rate |
|||||||
Canada's performance
In 2022, Canada was Japan's 23rd largest supplier for pasta with Japan importing a value of US$204,611. Imports from Japan, however, have been increasing by a CAGR of 31.8% between 2018 and 2022.
The pasta products being imported were pasta, stuffed with meat or other substances, whether or not cooked or otherwise prepared (US$122.8 thousand), uncooked pasta, not stuffed or otherwise prepared, not containing eggs (US$41.7 thousand), and couscous, whether or not prepared (US$40.1 thousand) in 2022. Japan is also, known to import a lot of durum wheat from Canada, to have local manufacturers make it into pasta domestically at a cheaper cost (Trade Commissioner Service, 2023).
| HS Code | Description | 2018 | 2019 | 2020 | 2021 | 2022 | CAGR* % 2018-2022 |
|---|---|---|---|---|---|---|---|
| 1902 | Total - Pasta, whether or not cooked or stuffed with meat or other substances or otherwise prepared, such as spaghetti, macaroni, noodles, lasagne, gnocchi, ravioli, cannelloni; couscous | 67,750 | 70,724 | 111,525 | 214,806 | 204,611 | 31.8 |
| 190220 | Pasta, stuffed with meat or other substances, whether or not cooked or otherwise prepared | 111,981 | 122,791 | 9.7 | |||
| 190219 | Uncooked pasta, not stuffed or otherwise prepared, not containing eggs | 23,048 | 24,179 | 64,970 | 53,444 | 41,677 | 16.0 |
| 190240 | Couscous, whether or not prepared | 44,702 | 46,545 | 46,555 | 49,381 | 40,142 | −2.7 |
|
Source: Global Trade Tracker, 2023 *CAGR: Compound Annual Growth Rate |
|||||||
Retail sales
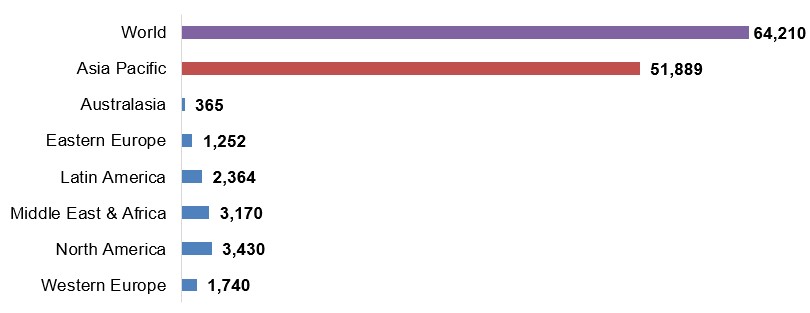
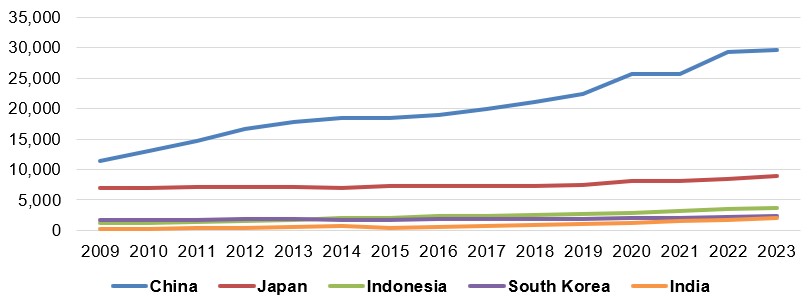
On an International context, Euromonitor reports that retail sales of noodles (totalling US$64.2 billion worldwide), was the highest within the Asia Pacific (APAC) region - consuming a total global value of 80.8% (US$51.9 billion) in 2022. Japan's sales of noodles totalled US$8.9 billion in 2023, growing at a CAGR of 4.0% between 2018 and 2023. Comparatively, sales of noodles in Japan - along with many other markets in the APAC region - remained relatively stable (2009-2023) with Japan starting at sales of US$7.0 billion in 2009. China in comparison increased more significantly over Japan and other top markets in the region, registering noodle sales of US$11.4 billion in 2009 to reach US$29.6 billion in 2023.
Description of above image
- World: 64,210
- Asia Pacific: 51,889
- Australasia: 365
- Eastern Europe: 1,252
- Latin America: 2,364
- Middle East and Africa: 3,170
- North America: 3,430
- Western Europe: 1,740
Source: Euromonitor International, 2023
Description of above image
| Country | 2009 | 2010 | 2011 | 2012 | 2013 | 2014 | 2015 | 2016 | 2017 | 2018 | 2019 | 2020 | 2021 | 2022 | 2023 |
|---|---|---|---|---|---|---|---|---|---|---|---|---|---|---|---|
| China | 11,369.1 | 12,975 | 14,734.6 | 16,679.5 | 17,823.2 | 18,453.3 | 18,451.2 | 18,865.6 | 19,908.7 | 21,144.4 | 22,310.6 | 25,683.2 | 25,615.2 | 29,215.5 | 29,593.5 |
| Japan | 6,984.7 | 6,914.6 | 7,134.3 | 7,105.1 | 7,161.4 | 7,035.9 | 7,304.5 | 7,267.7 | 7,263.4 | 7,363.3 | 7,432.9 | 8,088.6 | 8,119.1 | 8,520.4 | 8,948.1 |
| Indonesia | 1,139 | 1,242.6 | 1,337.9 | 1,509 | 1,724.6 | 1,991.9 | 2,123.4 | 2,305.5 | 2,378.2 | 2,560.8 | 2,725 | 2,909 | 3,166.2 | 3,456.2 | 3,638.5 |
| South Korea | 1,681.5 | 1,686.4 | 1,766.3 | 1,804.1 | 1,815.8 | 1,748.3 | 1,765.4 | 1,916.4 | 1,856.6 | 1,900.6 | 1,865.9 | 2,039.4 | 1,967.5 | 2,207 | 2,408.5 |
| India | 230 | 296 | 371 | 452.5 | 543 | 649 | 405 | 575 | 721 | 881 | 1,042 | 1,282.1 | 1,492.5 | 1,769.6 | 2,064.3 |
Source: Euromonitor International, 2023
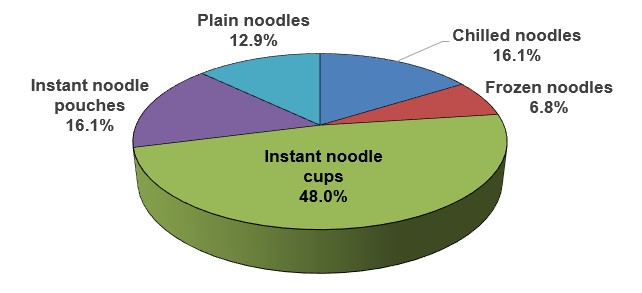
Instant noodle cups in Japan were the highest in demand, registering a sales of US$4.3 billion (48.0%) in 2023, followed by instant noodle pouches and chilled noodles bringing in US$1.4 billion each (16.1% per category), plain noodles at US$1.2 billion (12.9%), and frozen noodles at US$611.5 million (6.8%).
Description of above image
- Chilled noodles: 16.1%
- Frozen noodles: 6.8%
- Instant noodle cups: 48.0%
- Instant noodle pouches: 16.1%
- Plain noodles: 12.9%
Source: Euromonitor International, 2023
| Category | 2018 | 2019 | 2020 | 2021 | 2022 | 2023 |
|---|---|---|---|---|---|---|
| Total - noodles | 7,363.3 | 7,432.9 | 8,088.6 | 8,119.1 | 8,520.4 | 8,948.1 |
| Chilled noodles | 1,263.2 | 1,257.9 | 1,404.3 | 1,383.4 | 1,426.9 | 1,443.7 |
| Frozen noodles | 464.3 | 485.3 | 562.3 | 537.3 | 570.2 | 611.5 |
| Subtotal - instant noodles | 4,619.7 | 4,674.4 | 4,904.1 | 5,044.4 | 5,337.3 | 5,737.3 |
| Cups | 3,488.8 | 3,557.5 | 3,611.6 | 3,736.0 | 3,982.7 | 4,292.5 |
| Pouches | 1,130.9 | 1,117.0 | 1,292.5 | 1,308.4 | 1,354.6 | 1,444.9 |
| Plain noodles | 1,016.2 | 1,015.2 | 1,217.8 | 1,154.0 | 1,186.0 | 1,155.5 |
| Source: Euromonitor International, 2023 | ||||||
| Category | Annual growth % 2023/2022 | CAGR* % 2018-2023 | Total growth % 2018-2023 |
|---|---|---|---|
| Total - noodles | 5.0 | 4.0 | 21.5 |
| Chilled noodles | 1.2 | 2.7 | 14.3 |
| Frozen noodles | 7.2 | 5.7 | 31.7 |
| Subtotal - instant noodles | 7.5 | 4.4 | 24.2 |
| Cups | 7.8 | 4.2 | 23.0 |
| Pouches | 6.7 | 5.0 | 27.8 |
| Plain noodles | −2.6 | 2.6 | 13.7 |
|
Source: Euromonitor International, 2023 *CAGR: Compound Annual Growth Rate |
|||
| Category | 2023 | 2024 | 2025 | 2026 | 2027 | 2028 |
|---|---|---|---|---|---|---|
| Total - noodles | 8,948.1 | 9,153.9 | 9,295.1 | 9,421.5 | 9,551.0 | 9,684.1 |
| Chilled noodles | 1,443.7 | 1,446.8 | 1,445.4 | 1,446.2 | 1,451.0 | 1,459.1 |
| Frozen noodles | 611.5 | 635.7 | 654.0 | 669.8 | 684.8 | 699.0 |
| Subtotal - instant noodles | 5,737.3 | 5,924.2 | 6,058.3 | 6,174.1 | 6,285.5 | 6,394.3 |
| Cups | 4,292.5 | 4,423.0 | 4,518.1 | 4,601.5 | 4,682.8 | 4,763.1 |
| Pouches | 1,444.9 | 1,501.2 | 1,540.1 | 1,572.6 | 1,602.7 | 1,631.2 |
| Plain noodles | 1,155.5 | 1,147.1 | 1,137.5 | 1,131.3 | 1,129.6 | 1,131.7 |
| Source: Euromonitor International, 2023 | ||||||
| Category | Annual growth % 2024/2023 | CAGR* % 2023-2028 | Total growth % 2023-2028 |
|---|---|---|---|
| Total - noodles | 1.4 | 1.6 | 8.2 |
| Chilled noodles | 0.6 | 0.2 | 1.1 |
| Frozen noodles | 2.1 | 2.7 | 14.3 |
| Subtotal - instant noodles | 1.7 | 2.2 | 11.5 |
| Cups | 1.7 | 2.1 | 11.0 |
| Pouches | 1.8 | 2.5 | 12.9 |
| Plain noodles | 0.2 | −0.4 | −2.1 |
|
Source: Euromonitor International, 2023 *CAGR: Compound Annual Growth Rate |
|||
Competitive landscape
In 2023, leading packaged food companies (brands) of noodle products in Japan included Nissin Foods Holdings Company Ltd. (Nissin, Myojo) at a market share of 31.7% (US$2.8 billion), Toyo Suisan Kaisha Ltd. (Maruchan) at 20.6% (US$1.8 billion), and Sanyo Foods Co Ltd. (Sapporo Ichiban) at 6.9% (US$615.4 million). Private label noodle companies accounted for 8.0% (US$715.9 million) of sales over the year.
| Company | Top brand(s) | Retail sales (US$ million) | Market share in 2023 |
|---|---|---|---|
| Nissin Foods Holdings Co Ltd. | Nissin, Myojo | 2,839.4 | 31.7 |
| Toyo Suisan Kaisha Ltd. | Maruchan | 1,847.3 | 20.6 |
| Sanyo Foods Co Ltd. | Sapporo Ichiban | 615.4 | 6.9 |
| Shimadaya Co Ltd. | Shimadaya | 297.4 | 3.3 |
| Ace Cook Co Ltd. | Super Cup | 292.2 | 3.3 |
| Hyougo-ken Tenobesomen Cooperative | Ibonoito | 240.8 | 2.7 |
| Japan Tobacco Inc. | TableMark | 223.8 | 2.5 |
| Nongshim Co Ltd. | Nong Shim | 150.0 | 1.7 |
| House Foods Corporation | House Foods | 79.6 | 0.9 |
| Nisshin Seifun Group Inc. | Nisshin Seifun | 54.6 | 0.6 |
| Private label | Private label | 715.9 | 8.0 |
| Others | Others | 1,484.6 | 16.6 |
| Total - noodles | 8,948.1 | 100.0 | |
| Source: Euromonitor International, 2023 | |||
Retail distribution channels
The majority of Japan's noodle market was distributed through store-based grocery retailers and non-grocery specialists (US$8.4 billion) versus non-store retailing or e-commerce sales (US$548.1 million) in 2023. Both store-based (offline) and e-commerce (online) retail sales grew by a CAGR of 3.8% and 6.2%, respectively between 2018 and 2023.
Japanese grocery retailers distributed most of the noodle products (US$7.2 billion) representing a market share of 80.2%, mainly within supermarkets (34.8%), convenience stores (24.8%), and hypermarkets (18.9%) in 2023. The remainder of these products were distributed through non-grocery specialists (13.7%) such as health and beauty specialists (10.1%), general merchandise stores (3.6%) and e-commerce (6.1%) over last year.
| Outlet Type | 2018 | 2023 | CAGR* % 2018-2023 | ||
|---|---|---|---|---|---|
| Actual | Share | Actual | Share | ||
| Total - retail channels | 7,363.3 | 100.0 | 8,948.1 | 100.0 | 4.0 |
| Store-based retail - offline | 6,957.4 | 94.5 | 8,399.9 | 93.9 | 3.8 |
| Grocery retailers | 6,058.2 | 82.3 | 7,177.3 | 80.2 | 3.4 |
| Convenience retail stores | 2,042.4 | 27.7 | 2,2163.7.3 | 24.8 | 1.6 |
| Supermarkets | 2,504.1 | 34.0 | 3,116.8 | 34.8 | 4.5 |
| Hypermarkets | 1,374.5 | 18.7 | 1,688.6 | 18.9 | 4.2 |
| Warehouse clubs | 60.2 | 0.8 | 76.6 | 0.9 | 4.9 |
| Food/drink tobacco specialists | 32.5 | 0.4 | 32.1 | 0.4 | −0.2 |
| Small local grocers | 44.6 | 0.6 | 46.9 | 0.5 | 1.0 |
| Non-grocery specialists | 899.2 | 12.2 | 1,222.7 | 13.7 | 6.3 |
| General merchandise stores | 285.6 | 3.9 | 318.2 | 3.6 | 2.2 |
| Health and beauty specialists | 613.6 | 8.3 | 904.5 | 10.1 | 8.1 |
| Non-store retail - e-commerce | 405.9 | 5.5 | 548.1 | 6.1 | 6.2 |
|
Source: Euromonitor International, 2023 *CAGR: Compound Annual Growth Rate |
|||||
New product launches
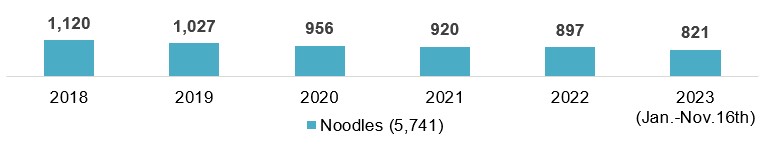
Mintel indicated that there were 5,741 new noodle food products launched in Japan's grocery retailer outlets (including new variety/range extension, packaging, formulation or relaunched) between the period of January 2018 and November 16th, 2023. The leading locations of manufacturer (countries reported: n=10) launching products in Japan (321) during this period were Thailand (8), China (7), Malaysia (5), Belgium (2), South Korea (2), France (2), Italy (2), Vietnam (1), and Algeria (1).
Description of above image
| 2018 | 2019 | 2020 | 2021 | 2022 | 2023 (January to November 16) | Total | |
|---|---|---|---|---|---|---|---|
| Noodles | 1,120 | 1,027 | 956 | 920 | 897 | 821 | 5,741 |
Source: Mintel, 2023
Pasta, rice and noodle manufacturers are launching new innovative products that evolve around vitamin fortification, convenience, and sustainable production. In the APAC region, several product launches are highlighting their presence on social media channels. As well, protein content is a bigger focus to help consumers meet their required dietary needs. Meanwhile, the Europe, Middle East and Africa (EMEA) region are focusing on the need for fast and convenient meals, along with sustainable sourcing claims. At the same time, the Americas are launching products that are genetically modified organism-free (GMO) and that have vitamin/mineral fortified claims.Footnote 1
Leading parent companies launching these new noodle or pasta products (1,086) in Japan between Q4-2022 and Q4-2023 were Nissin Foods (310), Acecook (152), Toyo Suisan Kaisha (139), Sanyo Foods (101), FamilyMart (51), and Nisshin Seifun Group (33). New noodle/pasta brands appearing for the first time launched in the Japanese market within the last 6 months, included Nippn Oh'My Frozen Pasta Premium Shigokuno (Bolognese spaghetti), Myojo Ippai Manzoku (soy sauce noodles), Acecook Konshin No Ippin (special Chinese noodles) and Acecook Aka No Wonton Men (Tanmen noodles with red ginger pickles wontons).
Top growing categories for pasta/noodle products in Japan were soup (+300%) and snacks (+100%) between Q4-2022 and Q4-2023. During this same period, declining categories were side dishes (−100%), processed fish, meat and egg products (−50%), sauces and seasonings (−22%), and meals and meal centers (−14%). Top growing claims (Q3-2022 vs Q3-2023) were low/no/reduced sodium (+400%), convenient packaging (+200%), microwaveable (+156%), and ethical - environmentally friendly packaging (+150%). Declining claims over this period were wholegrain (−100%), premium (−90%), social media (−46%), and added calcium (−34%).
New ingredients found within these products appearing within the last 12 months included oats, potassium lactate, Asian pear, Acacia honey, Ume extract, Umami powder, turtle meat, whey calcium, beef bone broth, and mushroom juice. The fastest growing or most common flavours used were scallion/spring, green or Welsh onion (+500%), Tantan/Dandan (+300%), chilli/chilli pepper (+200%), mustard (+200%), seaweed/Wakame (+100%), and Chow Mein (+100%) between Q4-2021 and Q4-2023.
Between January 2018 and November 21st 2023, top flavour components found in these noodle/pasta products were soy/soya sauce or Shoyu, spice/spicy, Miso, salt/salted, Tonkotsu/pork bone/pork marrow, chicken, curry, seafood, Tantan/Dandan, and pork.
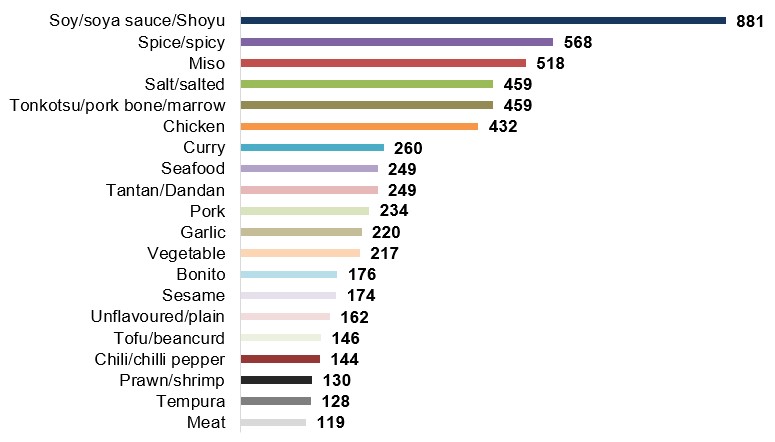
Description of above image
- Soy/soya sauce/Shoyu: 881
- Spice/spicy: 568
- Miso: 518
- Tonkotsu/pork bone/marrow: 459
- Salt/salted: 459
- Chicken: 432
- Curry: 260
- Tantan/Dandan: 249
- Seafood: 249
- Pork: 234
- Garlic: 220
- Vegetable: 217
- Bonito: 176
- Sesame: 174
- Unflavoured/plain: 162
- Tofu/beancurd: 146
- Chili/chilli pepper: 144
- Prawn/shrimp: 130
- Tempura: 128
- Meat: 119
Source: Mintel, 2023
Total item count: 5,769
| Product attributes | Yearly launch - item count | ||||||
|---|---|---|---|---|---|---|---|
| 2018 | 2019 | 2020 | 2021 | 2022 | 2023 | Total | |
| Yearly product launches | 1,120 | 1,027 | 956 | 920 | 897 | 821 | 5,741 |
| Top launch types | |||||||
| New variety/range extension | 534 | 480 | 404 | 414 | 429 | 388 | 2,649 |
| Relaunch | 349 | 364 | 411 | 345 | 303 | 273 | 2,045 |
| New packaging | 138 | 99 | 74 | 92 | 88 | 56 | 547 |
| New product | 98 | 81 | 67 | 68 | 75 | 102 | 491 |
| New formulation | 1 | 3 | 0 | 1 | 2 | 2 | 9 |
| Top sub-categories | |||||||
| Instant noodles | 712 | 663 | 640 | 645 | 630 | 577 | 3,867 |
| Prepared meals | 115 | 77 | 89 | 68 | 76 | 62 | 487 |
| Meal kits | 91 | 96 | 77 | 84 | 70 | 65 | 483 |
| Noodles | 36 | 27 | 21 | 18 | 15 | 12 | 129 |
| Stocks | 26 | 12 | 8 | 16 | 19 | 20 | 101 |
| Top five companies | |||||||
| Nissin Food Products | 165 | 194 | 173 | 183 | 140 | 129 | 984 |
| Acecook | 162 | 152 | 162 | 151 | 151 | 118 | 896 |
| Toyo Suisan Kaisha | 128 | 103 | 108 | 98 | 107 | 120 | 664 |
| Sanyo Foods | 109 | 96 | 92 | 97 | 90 | 80 | 564 |
| Myojo Foods | 96 | 62 | 84 | 93 | 84 | 59 | 478 |
| Top five brands | |||||||
| Toyo Suisan Maruchan | 48 | 32 | 41 | 33 | 36 | 37 | 227 |
| Sapporo Ichiban | 69 | 46 | 16 | 28 |
21 |
30 | 210 |
| Nissin No Donbee | 23 | 39 | 47 | 40 | 26 | 18 | 193 |
| Seven & i Premium | 47 | 45 | 29 | 14 | 11 | 22 | 168 |
| Sanyo Foods | 0 | 14 | 47 | 42 | 35 | 24 | 162 |
| Import status (if reported) | |||||||
| Not imported | 91 | 74 | 47 | 39 | 28 | 42 | 321 |
| Imported | 8 | 0 | 6 | 12 | 2 | 2 | 30 |
| Top five price groups (US dollars) | |||||||
| $0.31 - 5.30 | 1,113 | 1,014 | 940 | 912 | 885 | 812 | 5,676 |
| $5.31 - 10.30 | 5 | 12 | 14 | 6 | 10 | 4 | 51 |
| $10.31 - 15.30 | 0 | 1 | 0 | 1 | 0 | 3 | 5 |
| $15.31 - 20.30 | 0 | 0 | 0 | 1 | 2 | 0 | 3 |
| $20.31 - 30.00 | 0 | 0 | 0 | 0 | 0 | 2 | 2 |
| Top five flavours (including blend) | |||||||
| Soya sauce/Shoyu | 54 | 47 | 39 | 45 | 49 | 40 | 274 |
| Miso | 38 | 40 | 40 | 37 | 33 | 36 | 224 |
| Unflavoured/plain | 38 | 38 | 31 | 25 | 17 | 13 | 162 |
| Tonkotsu/pork bone/pork marrow | 34 | 25 | 30 | 23 | 28 | 17 | 157 |
| Curry | 29 | 24 | 20 | 17 | 25 | 23 | 138 |
| Top package types | |||||||
| Tub | 697 | 621 | 626 | 518 | 501 | 439 | 3,402 |
| Flexible (stand-up pouch/sachet) | 351 | 317 | 262 | 247 | 258 | 241 | 1,676 |
| Tray | 41 | 40 | 47 | 126 | 119 | 124 | 497 |
| Bottle | 20 | 36 | 14 | 9 | 7 | 9 | 95 |
| Tube | 5 | 6 | 3 | 10 | 4 | 4 | 32 |
| Source: Mintel; Global New Product Database, 2023 | |||||||
Examples of new products
Tanmen Noodles with Red Ginger Pickles Wontons
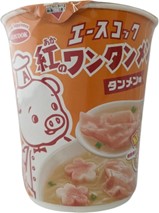
Source: Mintel, 2023
| Company | Acecook |
|---|---|
| Brand | Acecook Aka No Wonton Men |
| Category | Meals and meal centers, instant noodles |
| Market | Japan |
| Claims | Added calcium, vitamin / mineral fortified, time / speed |
| Store name | Yodobashi Online Store |
| Store type | Internet / mail order |
| Date published | November 2023 |
| Launch type | New product |
| Price in US dollars | 1.70 |
This product retails in a 60 gram pack. 60th anniversary of the Acecook Wonton Men range. Comes with a new kind of wontons made with red ginger pickles. High in calcium. Ready in just three minutes with hot water. Launched on October 2, 2023, with an retail recommended price of 254 yen. Logos and certifications: JAS. Flavours available include red ginger, Alpinia purpurata and pickle, pickled and dumpling, and Wonton.
Boiled Somen Noodles
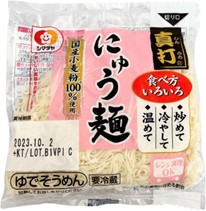
Source: Mintel, 2023
| Company | Shimadaya |
|---|---|
| Brand | Shimadaya Shinuchi |
| Category | Side dishes, noodles |
| Market | Japan, not imported |
| Claims | Microwaveable, ease of use |
| Store name | Life |
| Store type | Supermarket |
| Store location | Suginami, Tokyo 167-0042 |
| Date published | October 2023 |
| Launch type | New product |
| Price in US dollars | 0.86 |
This product retails in a 160 gram pack. Made with 100% Japanese wheat flour. Can be easily prepared in bain marie, added to hot pot, stir-fried or microwaved. Can be served cold by cooling down the noodles with cold water after heated in bain marie. Launched on September 1, 2023, open-priced.
Chicken Ramen Noodles for Hot Pot
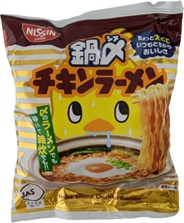
Source: Mintel, 2023
| Company | Nissin Food Products |
|---|---|
| Brand | Nissin Nabe Shime Chicken Ramen |
| Category | Meals and meal centers, instant noodles |
| Market | Japan |
| Claims | Time / speed |
| Store name | Yodobashi Online Store |
| Store type | Internet / mail order |
| Date published | October 2023 |
| Launch type | New product |
| Price in US dollars | 0.98 |
This product retails in an 80 gram pack. Features slightly thick noodles that are unlikely to go soggy. Can be added to hot pot or rice porridge. Instant noodles with cooking instructions - Launched on September 25, 2023, with an retail recommended price of 146 yen. Logos and certifications: JAS.
Rich Soy Sauce Noodles
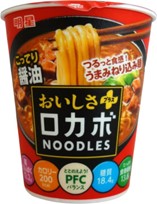
Source: Mintel, 2023
| Company | Myojo Foods |
|---|---|
| Manufacturer | Higashi Nihon Myojo |
| Brand | Myojo Locabo Noodles Oishisa Plus |
| Category | Meals and meal centers, instant noodles |
| Market | Japan |
| Claims | High / added fibre, low / no / reduced carb, ethical – environmentally friendly package / sustainable (habitat / resources), high / added protein, low / reduced sugar |
| Store name | Lawson |
| Store type | Convenience store, Kitakase, Saiwai-ku, Kawasaki 212-0057 |
| Date published | May 2023 |
| Launch type | New product |
| Price in US dollars | 1.69 |
This product retails in a 60 gram pack. Low in carb and sugar. Features smooth noodles with umami, high in protein and dietary fibre. Contains 12.2 grams protein, 200 calories, 18.4 grams sugar, and 13.8 grams dietary fibre. Has protein cube toppings. Can be prepared with hot water in four minutes. Provide PFC balance, with balanced protein, fat and carbohydrate contents. Comes with a rich sauce sachet made with soy sauce. Pack is partially printed with biomass ink. Launched on March 27, 2023, with an retail recommended price of 231 yen. Logos and certifications: Locabo Low-Carb Plus, QR code, Biomass 10, Micro QR code. Also, available in cloudy chicken soup flavour.
For more information
The Canadian Trade Commissioner Service:
International Trade Commissioners can provide Canadian industry with on-the-ground expertise regarding market potential, current conditions and local business contacts, and are an excellent point of contact for export advice.
More agri-food market intelligence:
International agri-food market intelligence
Discover global agriculture and food opportunities, the complete library of Global Analysis reports, market trends and forecasts, and information on Canada's free trade agreements.
Agri-food market intelligence service
Canadian agri-food and seafood businesses can take advantage of a customized service of reports and analysis, and join our email subscription service to have the latest reports delivered directly to their inbox.
More on Canada's agriculture and agri-food sectors:
Canada's agriculture sectors
Information on the agriculture industry by sector. Data on international markets. Initiatives to support awareness of the industry in Canada. How the department engages with the industry.
For additional information on FoodEx Japan 2024, please contact:
Ben Berry, Deputy Director
Trade Show Strategy and Delivery
Agriculture and agri-food Canada
ben.berry@agr.gc.ca
Resources
- Euromonitor International | November 2022. Datagraphics: Noodles in Japan
- Global Trade Tracker (GTT), 2023
- Kaczorowski, Mikolaj. Mintel | 6 September, 2023. A year of innovation in pasta, rice and noodles.
- Mintel Global New Products Database, 2023
- Trade Commissioner Service – Embassy of Canada, 2023
Sector Trend Analysis – Noodles in Japan
Global Analysis Report
Prepared by: Erin-Ann Chauvin, Senior Market Analyst
© His Majesty the King in Right of Canada, represented by the Minister of Agriculture and Agri-Food (2024).
Photo credits
All photographs reproduced in this publication are used by permission of the rights holders.
All images, unless otherwise noted, are copyright His Majesty the King in Right of Canada.
To join our distribution list or to suggest additional report topics or markets, please contact:
Agriculture and Agri-Food Canada, Global Analysis1341 Baseline Rd, Tower 5, 3rd floor
Ottawa ON K1A 0C5
Canada
Email: aafc.mas-sam.aac@agr.gc.ca
The Government of Canada has prepared this report based on primary and secondary sources of information. Although every effort has been made to ensure that the information is accurate, Agriculture and Agri-Food Canada (AAFC) assumes no liability for any actions taken based on the information contained herein.
Reproduction or redistribution of this document, in whole or in part, must include acknowledgement of agriculture and agri-food Canada as the owner of the copyright in the document, through a reference citing AAFC, the title of the document and the year. Where the reproduction or redistribution includes data from this document, it must also include an acknowledgement of the specific data source(s), as noted in this document.
Agriculture and Agri-Food Canada provides this document and other report services to agriculture and food industry clients free of charge.