

Note: This report includes forecasting data that is based on baseline historical data.
Executive summary
The pet population in Australia has increased by a compound annual growth rate (CAGR) of 6.3% from 22.1 million pets in 2016 to 30.0 million pets in 2021.
Australia was the fourteenth largest global market for pet food with imports valued at US$421.7 million in 2021, representing a moderate increase in CAGR of 11.5% from US$245.1 million in 2016. Canada was Australia's thirteenth largest supplier of pet food (representing a 0.3% market share), with imports valued at US$1.3 million, 552.7 thousand kgs in 2021
Retail sales of pet food in Australia has increased 4.0% in CAGR from US$2.5 billion in 2016 to US$3.0 billion in 2021 and is expected to increase in CAGR by a further 4.3% attaining US$3.7 billion by 2026. Dog and cat food were the largest categories with retail sales of US$1.8 billion (59.2% market share) and US$1.0 billion (33.7% market share) respectively in 2021.
The five largest pet food companies in Australia controlled 67.9% of the retail market share in 2021 with Ebos Group Ltd experiencing the largest CAGR of 5.3% from 2016 to 2021 as their market share increased from 7.4% in 2016 to 9.6% in 2021.
Pet food retail sales in Australia were distributed primarily through store-based retail channels (92.7% market share representation), while the remaining pet food retail sales were distributed via non-store retailing (4.3% market share representation), and non-retail channels (3.0% market share representation) in 2021.
According to Mintel's Global New Products Database (GNPD), there were 605 new pet food products launched in Australia between January 2016 and December 2021. Dog snacks & treats, dog food wet and cat food wet, were top sub-categories of newly released pet food product launches in Australia during the prescribed period.
Pet population and ownership
The pet population in Australia has increased by a compound annual growth rate (CAGR) of 6.3% from 22.1 million pets in 2016 to 30.0 million pets in 2021. The pet population is forecast to slightly increase by a CAGR of 0.5% as the pet population is expected to grow to 30.8 million pets in 2026.
In 2021, fish accounted for 37.2% of the pet population (11.2 million) while dogs and cats accounted for 21.1% (6.3 million dogs) and 16.3% (4.9 million cats) respectively. Small mammals attained the largest CAGR of 22.8% as the mammal population increased from 536.9 thousand in 2016 to 1.5 million in 2021 while the small dog population is expected to obtain the largest CAGR of 4.1% as the population increases to 4.6 million by 2026. in the forecast period.
| Category | 2016 | 2021 | CAGR* % 2016-2021 | 2022 | 2026 | CAGR* % 2021-2026 |
|---|---|---|---|---|---|---|
| Pet Population | 22,106.3 | 30,047.3 | 6.3 | 30,176.0 | 30,768.0 | 0.5 |
| Fish | 8,729.5 | 11,186.5 | 5.1 | 10,921.0 | 10,471.0 | −1.3 |
| Dogs (total) | 4,759.0 | 6,344.0 | 5.9 | 6,567.0 | 7,533.0 | 3.5 |
| Small Dogs (up to 20 pounds or 9 kilograms) | 2,292.0 | 3,780.0 | 10.5 | 3,914.0 | 4,616.0 | 4.1 |
| Medium Dogs (20 to 50 pounds or 9 to 23 kilograms) | 1,518.0 | 1,600.0 | 1.1 | 1,670.0 | 1,896.0 | 3.5 |
| Large Dogs (Over 50 pounds or over 23 kilograms) | 949.0 | 964.0 | 0.3 | 983.0 | 1,021.0 | 1.2 |
| Birds | 4,187.4 | 5,448.4 | 5.4 | 5,420.0 | 5,183.0 | −1.0 |
| Cats | 3,478.0 | 4,903.0 | 7.1 | 5,071.0 | 5,378.0 | 1.9 |
| Small mammal/reptiles (total) | 952.4 | 2,165.4 | 17.9 | 2,197.0 | 2,203.0 | 0.3 |
| Small mammals | 536.9 | 1,502.0 | 22.8 | 1,530.0 | 1,564.0 | 0.8 |
| Reptiles | 415.5 | 663.4 | 9.8 | 667.0 | 639.0 | −0.7 |
|
Source: Euromonitor International, 2022 *CAGR: Compound Annual Growth Rate Historical data: 2016 to 2021 Forecast data: 2022 to 2027 |
||||||
Australia's dog ownership experienced a 1.6% increase in CAGR from 3.4 million households in 2016 to 3.7 million households in 2021. The corresponding percentage of those households owning dogs increased from 38.7% in 2016 to 39.3% in 2021. The number of households owning cats also increased from 2.6 million in 2016 to 2.8 million in 2021 representing an increase in the percentage of those same households owning cats from 29.3% to 29.8% in the same period.
| Category | 2016 | 2017 | 2018 | 2019 | 2020 | 2021 | CAGR* % 2016-2021 |
|---|---|---|---|---|---|---|---|
| Dog | 3,429.4 | 3,472.1 | 3,519.6 | 3,605.4 | 3,691.5 | 3,720.8 | 1.6 |
| % share | 38.7 | 38.5 | 38.4 | 38.7 | 39.1 | 39.3 | 0.3 |
| Cat | 2,596.5 | 2,656.0 | 2,701.1 | 2,748.5 | 2,801.2 | 2,820.7 | 1.7 |
| % share | 29.3 | 29.5 | 29.5 | 29.5 | 29.7 | 29.8 | 0.3 |
|
Source: Euromonitor International, 2022 *CAGR: Compound Annual Growth Rate |
|||||||
Retail market size
The premiumization and humanization trends, in addition to a growing pet population, continue to influence the pet food industry in Australia. As well, the demand for specialty and home-made pet meals to ensure personalized and nutritious culinary experiences has increased. Specifically, functional nutrition is expected to experience rising popularity as targeted nutrition immunity-boosting, mood management, mental wellbeing and digestive health interest strengthens.
Pet owners are also seeking indulgent yet healthy treats to add variety to their pet's diet to ensure they enjoy their food. Innovative shapes, novel proteins and new textures are increasing interest for pet owners, and interactive feeding experiences are enriching the bonding process. (Euromonitor International, 2022
Retail sales of pet food in Australia has increased 4.0% in CAGR from US$2.5 billion in 2016 to US$3.0 billion in 2021 and is expected to increase in CAGR by a further 4.3% attaining US$3.7 billion by 2026. Dog and cat food were the largest categories with retail sales of US$1.8 billion (59.2% market share) and US$1.0 billion (33.7% market share) respectively in 2021. All categories of pet food experienced positive growth in both the historic and forecast periods. In particular, the small mammals/reptiles category attained the largest CAGR of 19.7% as retail sales of food increased from US$41.5 million in 2016 to US$102.1 million in 2021, while retail sales of dog food are expected to attain a CAGR of 5.0% with sales of US$2.3 billion by 2026.
| Category | 2016 | 2021 | CAGR* % 2016-2021 | 2022 | 2026 | CAGR* % 2021-2026 |
|---|---|---|---|---|---|---|
| Pet food total | 2,481.4 | 3,021.3 | 4.0 | 3,141.3 | 3,732.3 | 4.3 |
| Dog Food | 1,496.5 | 1,790.0 | 3.6 | 1,866.8 | 2,283.6 | 5.0 |
| Cat Food | 850.7 | 1,018.4 | 3.7 | 1,059.4 | 1,220.4 | 3.7 |
| Small Mammal/Reptile Food | 41.5 | 102.1 | 19.7 | 102.9 | 106.9 | 0.9 |
| Bird Food | 70.9 | 73.6 | 0.8 | 74.6 | 80.8 | 1.9 |
| Fish Food | 21.8 | 37.2 | 11.3 | 37.7 | 40.6 | 1.8 |
|
Source: Euromonitor International, 2022 *CAGR: Compound Annual Growth Rate |
||||||
Company shares
The five largest pet food companies in Australia controlled 67.9% of the retail market share in 2021 with Ebos Group Ltd experiencing the largest CAGR of 5.3% from 2016 to 2021 as their market share increased from 7.4% in 2016 to 9.6% in 2021. Mars Inc. and Nestlé SA maintained their prominent positions as top companies with a combined market share presence of 50.0% in 2021, despite their recent declines in CAGR of 1.8% and 0.6% respectively from 2016 to 2021. Private label pet food companies declined in CAGR by 4.9%% as their market share decreased from 8.1% to 6.3% from 2016 to 2021.
| Company | 2016 | 2017 | 2018 | 2019 | 2020 | 2021 | CAGR* % 2016-2021 |
|---|---|---|---|---|---|---|---|
| Total | 100.0 | 100.0 | 100.0 | 100.0 | 100.0 | 100.0 | 100.0 |
| Mars Inc | 39.4 | 39.0 | 38.5 | 38.2 | 37.2 | 36.0 | −1.8 |
| Nestlé SA | 14.4 | 14.5 | 13.8 | 13.4 | 13.7 | 14.0 | −0.6 |
| Ebos Group Ltd | 7.4 | 8.2 | 8.9 | 9.3 | 9.4 | 9.6 | 5.3 |
| Real Pet Food Co, The | 6.0 | 4.8 | 5.2 | 5.2 | 5.0 | 4.9 | −4.0 |
| Colgate-Palmolive Co | 3.1 | 3.2 | 3.3 | 3.3 | 3.4 | 3.4 | 1.9 |
| Nova Concepts Pty Ltd | 0.9 | 0.9 | 0.9 | 0.9 | 1.0 | 1.0 | 2.1 |
| New Hope Group Co Ltd | 0.9 | 0.9 | 0.9 | 0.9 | 0.9 | 0.0 (2017-2021) | |
| Prime Pet Care Pty Ltd | 0.7 | 0.7 | 0.7 | 0.6 | 0.6 | 0.6 | −3.0 |
| Rice Growers Ltd | 0.7 | 0.7 | 0.7 | 0.6 | 0.6 | 0.6 | −3.0 |
| Peters Pure Animal Foods Pty Ltd | 0.6 | 0.6 | 0.6 | 0.6 | 0.5 | 0.5 | −3.6 |
| Private Label | 8.1 | 7.8 | 7.4 | 7.0 | 6.7 | 6.3 | −4.9 |
| Others | 15.9 | 15.9 | 17.0 | 17.7 | 18.8 | 20.3 | 5.0 |
|
Source: Euromonitor International, 2022 *CAGR: Compound Annual Growth Rate |
|||||||
Brand shares
According to Euromonitor International (2022), larger multinational players remained the top performers in 2021, with limited change across the competitive landscape. That said, the competition between top brands and smaller premium players is intensifying. (Of note, the company Mars Inc owns four of the top five pet food brands - Pedigree, Whiskas, Cesar and Optimum, in Australia with a combined market share of 22.8% in 2021). However, rising unit prices (due to supply chain disruptions and inflationary pressures), changing consumer demand and rapidly shifting market positions has effected some mainstream pet food brands and their ability to successfully compete within the Australian market. Relatedly, private label, economy and mid-priced pet food brands will likely be effected by the continued influence of the premiumization and humanization trends. (Euromonitor International, 2022)
BlackHawk (Ebos Group Ltd) was the largest pet food brand in Australia with retail sales of US$239.2 million in 2021 representing the largest increase in CAGR of 10.2% from US$147.2 million in 2016. Pedigree (Mars Inc), the second largest pet food brand attained US$230.4 million in 2021, representing an increase in CAGR of 1.4% from retail sales of US$214.8 million valued in 2016. Private label pet food brands experienced a decline in CAGR of 1.1% as retail sales decreased to US$190.0 million in 2021 from US$200.8 million in 2016.
| Brand | 2016 | 2017 | 2018 | 2019 | 2020 | 2021 | CAGR* % 2016-2021 |
|---|---|---|---|---|---|---|---|
| Total | 2,481.4 | 2,546.1 | 2,630.6 | 2,704.3 | 2,855.1 | 3,021.3 | 4.0 |
| BlackHawk (Ebos Group Ltd) | 147.2 | 171.0 | 193.2 | 208.9 | 221.5 | 239.2 | 10.2 |
| Pedigree (Mars Inc) | 214.8 | 216.9 | 217.9 | 218.7 | 225.4 | 230.4 | 1.4 |
| Whiskas (Mars Inc) | 170.8 | 169.6 | 168.0 | 166.1 | 165.8 | 165.0 | −0.7 |
| Cesar (Mars Inc) | 138.2 | 137.3 | 139.3 | 141.4 | 143.2 | 146.4 | 1.2 |
| Optimum (Mars Inc) | 108.0 | 115.7 | 122.5 | 129.9 | 138.4 | 145.9 | 6.2 |
| Fancy Feast/Gourmet (Nestlé SA) | 97.7 | 102.0 | 108.0 | 111.0 | 120.3 | 130.2 | 5.9 |
| Supercoat (Nestlé SA) | 113.6 | 118.4 | 104.0 | 98.4 | 110.7 | 118.7 | 0.9 |
| Vip (Real Pet Food Co, The) | 81.5 | 85.6 | 87.8 | 90.1 | 91.2 | 92.6 | 2.6 |
| Sheba (Mars Inc) | 72.3 | 78.3 | 80.3 | 82.0 | 85.5 | 87.9 | 4.0 |
| Royal Canin (Mars Inc) | 60.6 | 65.1 | 70.1 | 75.8 | 81.0 | 85.5 | 7.1 |
| Private label | 200.8 | 199.0 | 195.0 | 190.6 | 190.5 | 190.0 | −1.1 |
| Others | 397.6 | 408.8 | 449.6 | 481.3 | 541.1 | 615.3 | 9.1 |
|
Source: Euromonitor International, 2022 *CAGR: Compound Annual Growth Rate |
|||||||
Market segmentation
Dog food
Australian consumers are focused on providing their dogs with customized tailored nutrition that provides added benefits that boost immune function and bodily functions such as weight management, digestive health and mobility, as well as skin and coat health for their dogs. In addition, pet owners want to make conscious purchases of ethically and alternative sourced proteins. Euromonitor International notes that insect protein-based dog food and treats are expected to gain more popularity in 2022, as more players are introducing options, such as Australian-made Doggylicious Protein Cookies from ONE (with Everything!), that include cricket protein, while producers such as Feed for Thought, incorporate black soldier fly larvae into heir pet food as a source of alternative protein for dogs.
The popularity of subscription-based meal kits for dogs is also increasing as owners seek the convenience and ability to custom prepare meals that ensure fresh ingredients and provide food sourcing information. Newer formats offering human-style food such as stews and bone broths, and varied textures in dog treats such as snack bars for dogs, are also expected to witness strong growth as pet parents explore different food options for their dogs to enjoy. In addition, innovative technology that provides customized feeding solutions such as ilume, a gourmet dog food delivery service that uses data from the dog's smart collar and bowl tracker to create personalised nutrition meal plans for individual dogs, are also being developed.
Total retail sales of dog food in Australia reached US$1.8 billion in 2021, growing 4.4% as retail sales increased from US$1.7 billion in 2020. The dog food market grew at a moderate CAGR of 3.6% between 2016 and 2021. In absolute value terms, dry dog food was the largest subcategory with retail sales of US$828.0 million (46.3% market share) in 2021, growing 4.9% in CAGR from retail sales of US$652.3 million in 2016. Wet dog food was the second largest retail subcategory with retail sales of US$698.9 million in 2021 (39.0% market share). Premium (dry and wet) dog food saw the largest CAGR's of 6.8% and 4.6% respectively, in comparison to mid-priced, and economy dog food which experienced slight declines in CAGR's during the same period. Dog treats and mixers represented a 14.7% market share of dog food sold in Australia with retail sales valued at US$263.1 million in 2021.
Growth in the dog food category is expected to be strongly positive with a larger CAGR of 5.0% as retail sales attain US$2.3 billion by 2026, supported by increases in dog population and adoptions, as more people spent more time at home during the pandemic (Euromonitor International 2022). Wet dog food in particular, is expected to experience a larger CAGR of 4.8% by 2026, in comparison to the CAGR of 2.0% the subcategory achieved between 2016 to 2021. Premium (dry and wet) dog food is expected to increase in CAGR's of (6.5% and 7.4% respectively) reaching US$906.8 million and US$652.1 million respectively, while mid-priced and economy dog food are anticipated to decline in CAGR (with the exception of economy wet dog food which is expected to attain a slight increase in CAGR of 0.1%) by 2026. Retail sales of dog treats and mixers are expected to attain US$334.8 million by 2026, as the growing popularity of using treats for rewards, training and bonding with dogs continues.
| Category | 2016 | 2017 | 2018 | 2019 | 2020 | 2021 |
|---|---|---|---|---|---|---|
| Dog Food Total | 1,496.5 | 1,536.9 | 1,596.7 | 1,645.3 | 1,713.9 | 1,790.0 |
| Dry Dog Food | 652.3 | 684.1 | 718.0 | 748.1 | 788.8 | 828.0 |
| Premium Dry Dog Food | 477.4 | 512.8 | 550.1 | 582.9 | 624.5 | 662.3 |
| Mid-Priced Dry Dog Food | 114.0 | 112.6 | 111.1 | 109.9 | 110.2 | 112.3 |
| Economy Dry Dog Food | 60.8 | 58.7 | 56.8 | 55.2 | 54.1 | 53.3 |
| Wet Dog Food | 633.9 | 635.0 | 652.5 | 663.2 | 676.2 | 698.9 |
| Premium Wet Dog Food | 364.5 | 375.9 | 400.1 | 416.5 | 432.1 | 456.2 |
| Mid-Priced Wet Dog Food | 171.3 | 165.9 | 160.9 | 156.3 | 154.4 | 153.7 |
| Economy Wet Dog Food | 98.0 | 93.2 | 91.6 | 90.5 | 89.7 | 89.0 |
| Dog Treats and Mixers | 210.3 | 217.8 | 226.1 | 234.0 | 249.0 | 263.1 |
| Source: Euromonitor International, 2022 | ||||||
| Category | Annual growth % 2020-2021 | CAGR* % 2016-2021 | Total growth % 2016-2021 |
|---|---|---|---|
| Dog Food Total | 4.4 | 3.6 | 19.6 |
| Dry Dog Food | 5.0 | 4.9 | 26.9 |
| Premium Dry Dog Food | 6.1 | 6.8 | 38.7 |
| Mid-Priced Dry Dog Food | 1.9 | −0.3 | −1.5 |
| Economy Dry Dog Food | −1.5 | −2.6 | −12.3 |
| Wet Dog Food | 3.4 | 2.0 | 10.3 |
| Premium Wet Dog Food | 5.6 | 4.6 | 25.2 |
| Mid-Priced Wet Dog Food | −0.5 | −2.1 | −10.3 |
| Economy Wet Dog Food | −0.8 | −1.9 | −9.2 |
| Dog Treats and Mixers | 5.7 | 4.6 | 25.1 |
|
Source: Euromonitor International, 2022 *CAGR: Compound Annual Growth Rate |
|||
| Category | 2022 | 2023 | 2024 | 2025 | 2026 |
|---|---|---|---|---|---|
| Dog Food Total | 1,866.8 | 1,963.2 | 2,064.5 | 2,171.0 | 2,283.6 |
| Dry Dog Food | 866.8 | 911.6 | 960.1 | 1,010.6 | 1,063.9 |
| Premium Dry Dog Food | 701.8 | 748.2 | 798.8 | 851.5 | 906.8 |
| Mid-Priced Dry Dog Food | 112.6 | 111.7 | 110.2 | 108.6 | 107.4 |
| Economy Dry Dog Food | 52.3 | 51.7 | 51.1 | 50.4 | 49.8 |
| Wet Dog Food | 725.0 | 762.9 | 801.2 | 841.7 | 884.9 |
| Premium Wet Dog Food | 485.8 | 525.7 | 565.8 | 607.8 | 652.1 |
| Mid-Priced Wet Dog Food | 150.9 | 148.8 | 146.7 | 144.9 | 143.2 |
| Economy Wet Dog Food | 88.3 | 88.4 | 88.7 | 89.1 | 89.6 |
| Dog Treats and Mixers | 275.0 | 288.8 | 303.2 | 318.7 | 334.8 |
| Source: Euromonitor International, 2022 | |||||
| Category | Annual growth % 2021-2022 | CAGR* % 2021-2026 | Total growth % 2021-2026 |
|---|---|---|---|
| Dog Food Total | 4.3 | 5.0 | 27.6 |
| Dry Dog Food | 4.7 | 5.1 | 28.5 |
| Premium Dry Dog Food | 6.0 | 6.5 | 36.9 |
| Mid-Priced Dry Dog Food | 0.3 | −0.9 | −4.4 |
| Economy Dry Dog Food | −1.9 | −1.3 | −6.6 |
| Wet Dog Food | 3.7 | 4.8 | 26.6 |
| Premium Wet Dog Food | 6.5 | 7.4 | 42.9 |
| Mid-Priced Wet Dog Food | −1.8 | −1.4 | −6.8 |
| Economy Wet Dog Food | −0.8 | 0.1 | 0.7 |
| Dog Treats and Mixers | 4.5 | 4.9 | 27.3 |
|
Source: Euromonitor International, 2022 *CAGR: Compound Annual Growth Rate |
|||
Mars Inc and Ebos Group Ltd remained the leading companies for dog food with value market share representation of 40.0% and 13.8% in 2021, despite Mars Inc decline in CAGR of 0.9% as their market share decreased from 41.8% recorded in 2016. In comparison, Ebos Group Ltd did experience the largest increase in CAGR of 5.8% as their market share grew from 10.4% held in 2016. Private label dog food companies represented a 5.9% market share in 2021 (versus a 94.1% brand label market penetration share) and have declined in market share representation by a CAGR of 5.7% from 2016 to 2021.
| Company | 2016 | 2017 | 2018 | 2019 | 2020 | 2021 | CAGR* % 2016-2021 |
|---|---|---|---|---|---|---|---|
| Total | 100.0 | 100.0 | 100.0 | 100.0 | 100.0 | 100.0 | 100.0 |
| Mars Inc | 41.8 | 41.8 | 41.3 | 41.1 | 40.7 | 40.0 | −0.9 |
| Ebos Group Ltd | 10.4 | 11.6 | 12.4 | 12.9 | 13.3 | 13.8 | 5.8 |
| Nestlé SA | 9.6 | 9.6 | 9.0 | 8.7 | 9.1 | 9.3 | −0.6 |
| Real Pet Food Co, The | 7.8 | 7.4 | 8.0 | 8.0 | 7.9 | 7.7 | −0.3 |
| Colgate-Palmolive Co | 3.0 | 3.0 | 3.1 | 3.1 | 3.2 | 3.3 | 1.9 |
| Nova Concepts Pty Ltd | 1.5 | 1.5 | 1.5 | 1.5 | 1.6 | 1.7 | 2.5 |
| Prime Pet Care Pty Ltd | 1.1 | 1.1 | 1.1 | 1.1 | 1.0 | 1.0 | −1.9 |
| Rice Growers Ltd | 1.2 | 1.2 | 1.1 | 1.1 | 1.0 | 1.0 | −3.6 |
| Ridley Corp Ltd | 0.8 | 0.7 | 0.7 | 0.6 | 0.6 | 0.6 | −5.6 |
| Greencross Ltd | 0.3 | 0.3 | 0.3 | 0.3 | 0.3 | 0.3 | 0.0 |
| Private Label | 7.9 | 7.4 | 6.9 | 6.4 | 6.2 | 5.9 | −5.7 |
| Others | 13.9 | 13.5 | 14.6 | 15.1 | 15.0 | 15.4 | 2.1 |
|
Source: Euromonitor International, 2022 *CAGR: Compound Annual Growth Rate |
|||||||
Cat food
Premiumization remains a priority despite the economic challenges imposed by the pandemic, as cat owners are continually looking for products that offer the best quality, sourcing and nutritional components for their pet's health. Of note, premium wet and dry cat food attained CAGR's of 5.9% and 6.1% historically and are forecast to increase, albeit at lower CAGR's of 5.1% and 5.8%, in the forecast period. In comparison, economy wet and dry cat food declined in CAGR by 4.8% and 3.2% in the historic period and are forecast to decline in CAGR by a further 1.5% and 1.0% by 2026. Sustainability, with regards to cat food packaging, is also a priority amongst consumers who value recyclable packaging materials, whilst keeping freshness and portion control. (Euromonitor International, 2022)
Retail sales of cat food in Australia reached US$1.0 billion in 2021, growing 4.5% from US$974.2 million in 2020. The cat food market grew at a CAGR of 3.7% between 2016 and 2021. While wet cat food was the largest subcategory in absolute value terms, recording retail sales of US$597.1 million (58.6% market share) in 2021, cat treats and mixers were the largest growing subcategory, expanding by a CAGR of 7.0% from 2016 to 2021, with total retail sales of US$41.6 million (4.1% market share) in 2021.
Retail sales of cat food will continue to grow throughout 2021-2026 with an expected CAGR of 3.7%, achieving US$1.2 billion by 2026. Retail sales in all subcategories (wet and dry cat food, and cat treats and mixers) will continue to increase in the forecast period, with cat treats and mixers expected to again, attain the larger CAGR (6.4%) reaching US$56.6 million by 2026, as consumers continue to express affection for their cats using treats. Excessive treat feeding however, has prompted some companies like Vitapet to explore the healthy space with Natural Bites, a low-calorie treat made from natural protein sources with no added preservatives, flavours or colours (Euromonitor International 2022).
| Category | 2016 | 2017 | 2018 | 2019 | 2020 | 2021 |
|---|---|---|---|---|---|---|
| Cat Food Total | 850.7 | 874.7 | 898.7 | 922.8 | 974.2 | 1,018.4 |
| Wet Cat Food | 515.2 | 527.4 | 539.7 | 551.6 | 579.2 | 597.1 |
| Premium Wet Cat Food | 250.4 | 264.4 | 279.0 | 293.4 | 317.7 | 333.0 |
| Mid-Priced Wet Cat Food | 244.1 | 243.8 | 242.7 | 241.2 | 245.0 | 247.9 |
| Economy Wet Cat Food | 20.7 | 19.3 | 18.1 | 17.0 | 16.6 | 16.2 |
| Dry Cat Food | 306.0 | 316.3 | 326.1 | 336.3 | 356.4 | 379.8 |
| Premium Dry Cat Food | 217.4 | 229.1 | 240.5 | 252.1 | 271.4 | 292.3 |
| Mid-Priced Dry Cat Food | 75.9 | 75.1 | 73.9 | 73.0 | 74.0 | 76.7 |
| Economy Dry Cat Food | 12.6 | 12.1 | 11.7 | 11.3 | 11.1 | 10.7 |
| Cat Treats and Mixers | 29.6 | 31.0 | 32.9 | 34.9 | 38.6 | 41.6 |
| Source: Euromonitor International, 2022 | ||||||
| Category | Annual growth % 2020-2021 | CAGR* % 2016-2021 | Total growth % 2016-2021 |
|---|---|---|---|
| Cat Food Total | 4.5 | 3.7 | 19.7 |
| Wet Cat Food | 3.1 | 3.0 | 15.9 |
| Premium Wet Cat Food | 4.8 | 5.9 | 33.0 |
| Mid-Priced Wet Cat Food | 1.2 | 0.3 | 1.6 |
| Economy Wet Cat Food | −2.4 | −4.8 | −21.7 |
| Dry Cat Food | 6.6 | 4.4 | 24.1 |
| Premium Dry Cat Food | 7.7 | 6.1 | 34.5 |
| Mid-Priced Dry Cat Food | 3.6 | 0.2 | 1.1 |
| Economy Dry Cat Food | −3.6 | −3.2 | −15.1 |
| Cat Treats and Mixers | 7.8 | 7.0 | 40.5 |
|
Source: Euromonitor International, 2022 *CAGR: Compound Annual Growth Rate |
|||
| Category | 2022 | 2023 | 2024 | 2025 | 2026 |
|---|---|---|---|---|---|
| Cat Food Total | 1,059.4 | 1,100.3 | 1,139.9 | 1,179.5 | 1,220.4 |
| Wet Cat Food | 613.0 | 632.2 | 650.8 | 669.6 | 689.0 |
| Premium Wet Cat Food | 349.9 | 369.1 | 388.0 | 407.3 | 426.8 |
| Mid-Priced Wet Cat Food | 247.3 | 247.6 | 247.4 | 247.1 | 247.2 |
| Economy Wet Cat Food | 15.9 | 15.6 | 15.4 | 15.2 | 15.0 |
| Dry Cat Food | 401.1 | 420.0 | 438.1 | 456.1 | 474.8 |
| Premium Dry Cat Food | 313.3 | 331.9 | 350.1 | 368.1 | 386.8 |
| Mid-Priced Dry Cat Food | 77.2 | 77.7 | 77.8 | 77.8 | 77.8 |
| Economy Dry Cat Food | 10.5 | 10.4 | 10.3 | 10.2 | 10.2 |
| Cat Treats and Mixers | 45.3 | 48.1 | 50.9 | 53.7 | 56.6 |
| Source: Euromonitor International, 2022 | |||||
| Category | Annual growth % 2021-2022 | CAGR* % 2021-2026 | Total growth % 2021-2026 |
|---|---|---|---|
| Cat Food Total | 4.0 | 3.7 | 19.8 |
| Wet Cat Food | 2.7 | 2.9 | 15.4 |
| Premium Wet Cat Food | 5.1 | 5.1 | 28.2 |
| Mid-Priced Wet Cat Food | −0.2 | −0.1 | −0.3 |
| Economy Wet Cat Food | −1.9 | −1.5 | −7.4 |
| Dry Cat Food | 5.6 | 4.6 | 25.0 |
| Premium Dry Cat Food | 7.2 | 5.8 | 32.3 |
| Mid-Priced Dry Cat Food | 0.7 | 0.3 | 1.4 |
| Economy Dry Cat Food | −1.9 | −1.0 | −4.7 |
| Cat Treats and Mixers | 8.9 | 6.4 | 36.1 |
|
Source: Euromonitor International, 2022 *CAGR: Compound Annual Growth Rate |
|||
The top companies in Australia's cat food sector, Mars Inc and Nestlé SA, accounted for a combined 59.0% market share in 2021. Although Mars Inc represented the slightly larger market share in cat food (34.0%) in relation to Nestlé SA (25.0%) in 2021, its growth decreased at a CAGR 2.4% from 2016 to 2021, while Nestlé SA remained stable (unchanged) during the same period. Of note, Ebos Group Ltd experienced the largest increase in CAGR (7.3%) as their market share representation grew from 3.1% in 2016 to 4.4% in 2021, while in contrast, The Real Pet Food Co experienced the largest decline in CAGR of 26.4% as their market share weakened from 3.7% to 0.8% during the same period. Private label cat food companies represented a 4.8% market share in 2021 (versus a 95.2% brand label market penetration share) and have declined in market % share representation by a CAGR of 3.4% from 2016 to 2021.
Mars Australia continued to lead overall cat food with its Whiskas brand in 2021, whilst Nestlé Purina PetCare Australia followed closely with the Purina Fancy Feast line, which increased its value share by expanding its product variety to appeal to consumers yearning for changes in food texture and taste for their cats (Euromonitor International 2022).
Within the cat treats and mixers category, Inaba Pet Food Co Ltd are innovating products to tackle the problem of overfeeding, with treats that are nutritious, low in fat and aim to mitigate health problems. Inaba treats also strengthened the competition in this space after its launch in the Australian market in 2020 of its low calorie, ethically sourced protein treats in various formats, with Churu Bites and Churu Pops gaining popularity (Euromonitor International 2022).
| Company | 2016 | 2017 | 2018 | 2019 | 2020 | 2021 | CAGR* % 2016-2021 |
|---|---|---|---|---|---|---|---|
| Total | 100.0 | 100.0 | 100.0 | 100.0 | 100.0 | 100.0 | 0.0 |
| Mars Inc | 38.4 | 37.2 | 36.6 | 36.0 | 35.0 | 34.0 | −2.4 |
| Nestlé SA | 25.0 | 25.0 | 24.3 | 23.7 | 24.1 | 25.0 | 0.0 |
| Colgate-Palmolive Co | 3.9 | 4.0 | 4.1 | 4.1 | 4.3 | 4.4 | 2.4 |
| Ebos Group Ltd | 3.1 | 3.5 | 3.9 | 4.2 | 4.2 | 4.4 | 7.3 |
| New Hope Group Co Ltd | 2.6 | 2.6 | 2.6 | 2.6 | 2.5 | −1.0 (2017-2021) | |
| Tropical Canning Corp Sdn Bhd | 1.8 | 1.7 | 1.7 | 1.6 | 1.5 | 1.5 | −3.6 |
| Real Pet Food Co, The | 3.7 | 0.8 | 0.9 | 0.9 | 0.9 | 0.8 | −26.4 |
| MPM Products Ltd | 0.5 | 0.5 | 0.6 | 0.6 | 0.6 | 0.6 | 3.7 |
| Inaba Pet Food Co Ltd | 0.0 | 0.0 | 0.0 | 0.0 | 0.0 | 0.1 | N/C |
| Macro Investments Pty Ltd | 0.1 | 0.1 | 0.1 | 0.1 | 0.1 | 0.1 | 0.0 |
| Private Label | 5.7 | 5.8 | 5.6 | 5.3 | 5.0 | 4.8 | −3.4 |
| Others | 17.7 | 18.4 | 19.6 | 20.7 | 21.7 | 21.8 | 4.3 |
|
Source: Euromonitor International, 2022 *CAGR: Compound Annual Growth Rate N/C: Not calculable |
|||||||
Other pet food
The strict lockdown restrictions and social distancing measures implemented during the pandemic increased the need for companionship, encouraging Australians to adopt more pets whilst spending more time at home. In addition to dogs and cats, there was also a rise in the adoption of other pets, such as small mammals, fish and birds (Euromonitor International 2022).
Retail sales of other pet food increased at a moderate CAGR of 9.6% from US$134.3 million in 2016 to US$212.8 million in 2021, as pet humanization was evident amongst other pet owners as well. Other pet food is forecast to increase by an additional, albeit lower, CAGR of 1.4% as retail sales are expected to reach US$228.2 million by 2026 as clean labels and fresh fruits and vegetables are expected to contribute, and improve value growth of other pet food over the forecast period. Euromonitor International also notes that although other pet food is expected to witness positive value growth throughout the forecast period, the growth will be more conservative compared with food for other popular pets such as cats and dogs, due to the lack of dynamism in the category and limited interest, as product innovation and range expansion remains limited. Relatedly, first-time small pet ownership of rabbits and guinea pigs, is usually transient due to their shorter life spans. As such, the higher interest shown towards other pets during the pandemic with people spending more time at home, will decline as lifestyles return to normal (Euromonitor International 2022).
Small mammal/reptile food was the largest subcategory of other pet food with retail sales of US$102.1 million (48.0%market share) in 2021, representing the largest increase in CAGR of 19.7% from US$41.5 million in 2016. Of note, food for small mammal/reptiles experienced dynamic value growth of 56.1% as retail sales increased from US$65.4 million to US$102.1 million during 2020-2021, as the adoption of such pets significantly rose during the pandemic. Other pet parents are expected to continue investing in these pets during 2022 maintaining the heightened level of sales (Euromonitor International 2022).
Similar to small mammals/reptiles, the bird population has also increased from 2016, despite the slight decline sustained from 2021 to 2022, leading to value growth of 1.4% for bird food from US$73.6 million in 2021 to expected values of US$74.6 million in 2022. Increased time at home has encouraged bird ownership as older consumers looking for companionship, consider birds as a pet, rather than the more popular choice of cats and dogs. Further, the continued desire to treat pets as family and provide them with the best available nutrition and food options also helped strengthen the value growth of bird food in Australia (Euromonitor International 2022). Retail sales of bird food is expected to experience the largest increase in CAGR (1.9%) in the forecast period attaining US$80.8 million by 2026.
The fish population also increased significantly in the historic period as Australians, with limited space, opted for fish ownership, which requires less time and attention to rear in comparison to cats and dogs. Fish food value sales grew a significant 30.1% from US$28.6 million in 2020 to US$37.2 million in 2021 and are expected to maintain their growth by increasing in CAGR by 1.8% as anticipated retail sales attain US$40.6 million by 2026. When selecting fish food, consumers considered food that is a balance of selected premium ingredients developed to promote proper growth and health, and affordable in nature (Euromonitor International 2022).
| Category | 2016 | 2017 | 2018 | 2019 | 2020 | 2021 |
|---|---|---|---|---|---|---|
| Other Pet Food | 134.3 | 134.5 | 135.2 | 136.2 | 167.0 | 212.8 |
| Small Mammal/Reptile Food | 41.5 | 41.6 | 41.8 | 42.0 | 65.4 | 102.1 |
| Bird Food | 70.9 | 71.1 | 71.5 | 72.0 | 72.9 | 73.6 |
| Fish Food | 21.8 | 21.8 | 21.9 | 22.1 | 28.6 | 37.2 |
| Source: Euromonitor International, 2022 | ||||||
| Category | Annual growth % 2020-2021 | CAGR* % 2016-2021 | Total growth % 2016-2021 |
|---|---|---|---|
| Other Pet Food | 27.4 | 9.6 | 58.5 |
| Small Mammal/Reptile Food | 56.1 | 19.7 | 146.0 |
| Bird Food | 1.0 | 0.8 | 3.8 |
| Fish Food | 30.1 | 11.3 | 70.6 |
|
Source: Euromonitor International, 2022 *CAGR: Compound Annual Growth Rate |
|||
| Category | 2022 | 2023 | 2024 | 2025 | 2026 |
|---|---|---|---|---|---|
| Other Pet Food | 215.2 | 218.5 | 221.5 | 224.7 | 228.2 |
| Small Mammal/Reptile Food | 102.9 | 104.1 | 104.9 | 105.8 | 106.9 |
| Bird Food | 74.6 | 76.1 | 77.6 | 79.2 | 80.8 |
| Fish Food | 37.7 | 38.3 | 39.0 | 39.8 | 40.6 |
| Source: Euromonitor International, 2022 | |||||
| Category | Annual growth % 2021-2022 | CAGR* % 2021-2026 | Total growth % 2021-2026 |
|---|---|---|---|
| Other Pet Food | 1.1 | 1.4 | 7.2 |
| Small Mammal/Reptile Food | 0.8 | 0.9 | 4.7 |
| Bird Food | 1.4 | 1.9 | 9.8 |
| Fish Food | 1.3 | 1.8 | 9.1 |
|
Source: Euromonitor International, 2022 *CAGR: Compound Annual Growth Rate |
|||
Other pet food had a fairly concentrated competitive environment. Mars Inc, Peters Pure Animal Foods Pty Ltd and Spectrum Brands Holdings Inc, were the largest other pet food companies in Australia with combined market shares of 22.3% in 2021, despite each companies declines in CAGR of market share representation by 9.7%, 7.4% and 8.5% respectively from 2016. Of note, Rolf C Hagen Inc experienced the largest decline in CAGR (11.1%) as the company's market share decreased from 2.7% held in 2016 to 1.5% in 2021. Private label other pet food companies represented a strong 17.0% market share in 2021 (versus an 83.0% brand label market penetration share) despite private label other pet food's market share representation declining in CAGR by 7.9% from a 25.6% market share held in 2016. Brand label other pet food are expected to continue their prominence within the category by highlighting natural and clean label claims on-pack to appeal to pet owners.
| Company | 2016 | 2017 | 2018 | 2019 | 2020 | 2021 | CAGR* % 2016-2021 |
|---|---|---|---|---|---|---|---|
| Total | 100.0 | 100.0 | 100.0 | 100.0 | 100.0 | 100.0 | 0.0 |
| Mars Inc | 19.5 | 19.0 | 18.6 | 18.3 | 14.9 | 11.7 | −9.7 |
| Peters Pure Animal Foods Pty Ltd | 10.6 | 10.9 | 11.0 | 11.1 | 9.1 | 7.2 | −7.4 |
| Spectrum Brands Holdings Inc | 5.3 | 5.4 | 5.3 | 5.3 | 4.3 | 3.4 | −8.5 |
| Vortex Industries Pty Ltd | 4.7 | 4.6 | 4.6 | 4.6 | 3.8 | 3.0 | −8.6 |
| Lovitts Pty Ltd | 3.1 | 2.9 | 2.9 | 2.8 | 2.3 | 1.8 | −10.3 |
| Rolf C Hagen Inc | 2.7 | 2.6 | 2.5 | 2.4 | 1.9 | 1.5 | −11.1 |
| Kamihata Fish Ind Ltd | 1.0 | 1.0 | 1.1 | 1.1 | 0.9 | 0.8 | −4.4 |
| Nestlé SA | 0.9 | 0.9 | 0.9 | 1.0 | 0.8 | 0.7 | −4.9 |
| Unicharm Corp | 1.0 | 1.0 | 1.0 | 0.9 | 0.8 | 0.6 | −9.7 |
| Private Label | 25.6 | 25.7 | 25.9 | 26.2 | 21.6 | 17.0 | −7.9 |
| Others | 25.6 | 26.0 | 26.1 | 26.3 | 39.5 | 52.3 | 15.4 |
|
Source: Euromonitor International, 2022 *CAGR: Compound Annual Growth Rate |
|||||||
Distribution channels
Pet food retail sales in Australia were distributed primarily through store-based retail channels (92.7% market share representation), while the remaining pet food retail sales were distributed via non-store retailing (4.3% market share representation), and non-retail channels (3.0% market share representation) in 2021. Of note, of the distribution channels available (store-based, non-store retailing and non-retail), only store-based retailing declined in CAGR by 0.7% as their market share representation declined from 95.8% held in 2016 to 92.7% in 2021 (while discounters, warehouse clubs and pet superstores increased in CAGR's of market share representation by 0.9%, 3.1% and 1.6% respectively, from 2016 to 2021). In comparison, non-store retailing (specifically e-commerce) experienced the largest increase in CAGR (23.4%) as their market share representation grew from 1.5% held in 2016 to 4.3% held in 2021, while non-retail channels (veterinary clinics) also experienced an increase in CAGR of 2.1% as its market share representation expanded from 2.7% held in 2016 to 3.0% held in 2021.
Within store-based retailing, grocery (modern-retailers), supermarkets (despite their decline in CAGR of 0.7%), held a significant market share representation of 61.1%, representing Australia's primary distribution channel choice for pet food in 2021. Cat owners in particular, appreciate the convenience of shopping for cat food while completing their other grocery shopping. Further, Euromonitor International notes that although supermarket shelves are crowded and require competitive pricing, many mainstream and premium pet food brands alike are keen on exploring the popularity of supermarkets as an opportunity to reach a larger number of customers. Other store-based retailing channels, specifically non-grocery specialists (pet superstores and shops) attained a 10.7% and 16.1% market share, while e-commerce (non-store retailing) represented a 4.3% market share in 2021.
Although supermarkets remained the primary distribution channel for pet food in Australia in 2021, interest in the e-commerce channel for its convenience, accessibility and available discounts, has been increasing. Further, e-commerce growth in part, has been supported by the increasing popularity of various pet food products, such as meal service kits for dogs. Bezzie, by Marley Spoon for example, has leveraged their existing e-commerce presence and diversified their meal kit service offerings by launching their dog food subscription service, enabling the provision of personalized meal kits for dogs to consumers, while encouraging e-commerce as a preferable distribution channel for consumers and their pet food needs.
| Channel | 2016 | 2017 | 2018 | 2019 | 2020 | 2021 | CAGR* % 2016-2021 |
|---|---|---|---|---|---|---|---|
| Distribution channel (total) | 100.0 | 100.0 | 100.0 | 100.0 | 100.0 | 100.0 | 0.0 |
| Store-Based Retailing | 95.8 | 95.3 | 94.7 | 94.0 | 93.4 | 92.7 | −0.7 |
| Grocery Retailers | 66.2 | 66.0 | 65.6 | 65.3 | 64.9 | 64.1 | −0.6 |
| Modern Grocery Retailers | 65.6 | 65.4 | 65.0 | 64.7 | 64.4 | 63.6 | −0.6 |
| Convenience Stores | 0.4 | 0.4 | 0.4 | 0.3 | 0.3 | 0.3 | −5.6 |
| Discounters | 2.1 | 2.1 | 2.2 | 2.2 | 2.2 | 2.2 | 0.9 |
| Supermarkets | 63.2 | 62.9 | 62.5 | 62.2 | 61.9 | 61.1 | −0.7 |
| Traditional Grocery Retailers | 0.6 | 0.6 | 0.5 | 0.5 | 0.5 | 0.5 | −3.6 |
| Mixed Retailers | 1.9 | 1.9 | 1.9 | 1.9 | 1.9 | 1.8 | −1.1 |
| Mass Merchandisers | 1.3 | 1.3 | 1.3 | 1.3 | 1.2 | 1.2 | −1.6 |
| Warehouse Clubs | 0.6 | 0.7 | 0.7 | 0.7 | 0.7 | 0.7 | 3.1 |
| Non-Grocery Specialists | 27.7 | 27.3 | 27.2 | 26.9 | 26.6 | 26.8 | −0.7 |
| Pet superstores | 9.9 | 10.3 | 10.6 | 10.7 | 10.7 | 10.7 | 1.6 |
| Pet shops | 17.8 | 17.1 | 16.6 | 16.1 | 15.8 | 16.1 | −2.0 |
| Non-Store Retailing | 1.5 | 1.9 | 2.3 | 2.8 | 3.6 | 4.3 | 23.4 |
| E-Commerce | 1.5 | 1.9 | 2.3 | 2.8 | 3.6 | 4.3 | 23.4 |
| Non-retail channels | 2.7 | 2.9 | 3.0 | 3.1 | 3.0 | 3.0 | 2.1 |
| Veterinary clinics | 2.7 | 2.9 | 3.0 | 3.1 | 3.0 | 3.0 | 2.1 |
|
Source: Euromonitor International, 2022 *CAGR: Compound Annual Growth Rate |
|||||||
Trade Overview
Global imports
The global market for pet food has experienced positive growth and increased in CAGR by 12.8% as imports have risen from US$11.3 billion in 2016 to US$20.6 billion in 2021. Germany was the largest market for pet food with imports valued at US$2.0 billion (9.6% market share), followed by the United States (U.S) with US$1.5 billion (7.5% market share), and Poland with imports worth US$1.1 billion (5.6% market share) in 2021.
Australia was the fourteenth largest global market for pet food with imports valued at US$421.7 million (2.1% market share) in 2021, representing a moderate increase in CAGR of 11.5% from US$245.1 million in 2016. In comparison, Canada was the fifth largest global market for pet food with imports of US$1.1 billion (5.2% market share) in 2021, representing an equally moderate increase in CAGR of 11.4% from pet food imports of US$621.4 million in 2016.
| Country | 2016 | 2017 | 2018 | 2019 | 2020 | 2021 | CAGR* % 2016-2021 | Market share % 2021 |
|---|---|---|---|---|---|---|---|---|
| World (total) | 11,288.4 | 12,826.7 | 14,093.0 | 14,999.7 | 17,578.6 | 20,569.4 | 12.8 | 100.0 |
| Germany | 1,079.0 | 1,349.7 | 1,466.6 | 1,515.4 | 1,685.3 | 1,975.1 | 12.9 | 9.6 |
| United States | 783.6 | 847.0 | 986.4 | 1,032.0 | 1,236.7 | 1,540.4 | 14.5 | 7.5 |
| Poland | 214.3 | 440.4 | 570.6 | 695.8 | 989.3 | 1,149.7 | 39.9 | 5.6 |
| United Kingdom | 741.2 | 845.8 | 880.8 | 928.9 | 1,007.2 | 1,122.9 | 8.7 | 5.5 |
| Canada (5) | 621.4 | 668.7 | 683.2 | 799.9 | 898.2 | 1,064.1 | 11.4 | 5.2 |
| France | 653.8 | 684.4 | 702.4 | 720.9 | 903.2 | 1,054.8 | 10.0 | 5.1 |
| Italy | 572.3 | 617.2 | 633.9 | 681.7 | 708.8 | 852.7 | 8.3 | 4.1 |
| Netherlands | 480.4 | 537.2 | 638.3 | 611.0 | 700.1 | 782.1 | 10.2 | 3.8 |
| Belgium | 558.0 | 598.0 | 518.0 | 528.6 | 675.8 | 748.3 | 6.0 | 3.6 |
| Japan | 641.6 | 619.4 | 644.0 | 646.8 | 674.4 | 702.7 | 1.8 | 3.4 |
| Australia (14) | 245.1 | 245.5 | 282.1 | 310.0 | 335.1 | 421.7 | 11.5 | 2.1 |
|
Source: Global Trade Tracker, 2022 *CAGR: Compound Annual Growth Rate |
||||||||
Australian imports
Australia has a diverse supply network of pet food providers. Thailand, the United States (U.S) and France were the largest suppliers of pet food to Australia in 2021 with values of US$134.8 million (32.0% market share), US$126.3 million (30.0% market share) and US$68.5 million (16.3% market share) respectively. In terms of value, each of the top exporting countries have experienced positive growth in their supply of pet food to Australia varying from 6.3% (Hungary) to the largest CAGR's of 229.8% (Korea) and 228.3 (Italy 2018-2021), with the exception of New Zealand and Canada, which experienced declines in CAGR's of 3.8% and 10.9% respectively, as pet food values supplied from these countries has decreased since 2016.
| Country | 2016 | 2017 | 2018 | 2019 | 2020 | 2021 | CAGR* % 2016-2021 | Market share % 2021 |
|---|---|---|---|---|---|---|---|---|
| World (total) | 245.1 | 245.5 | 282.1 | 310.0 | 335.1 | 421.7 | 11.5 | 100.0 |
| Thailand | 63.4 | 63.8 | 77.4 | 94.9 | 95.4 | 134.8 | 16.3 | 32.0 |
| United States | 86.5 | 85.5 | 91.3 | 97.1 | 110.0 | 126.3 | 7.9 | 30.0 |
| France | 26.1 | 27.5 | 46.8 | 49.9 | 46.8 | 68.5 | 21.3 | 16.3 |
| New Zealand | 41.0 | 40.4 | 43.9 | 40.4 | 44.8 | 33.8 | −3.8 | 8.0 |
| Korea | 0.0 | 0.0 | 5.5 | 16.3 | 229.8 | 3.9 | ||
| Austria | 4.1 | 3.6 | 3.8 | 4.7 | 6.8 | 11.8 | 23.7 | 2.8 |
| Hungary | 6.9 | 9.6 | 7.8 | 9.4 | 9.1 | 9.3 | 6.3 | 2.2 |
| China | 3.9 | 4.2 | 3.9 | 5.1 | 5.5 | 8.3 | 16.5 | 2.0 |
| Italy | 0.1 | 0.6 | 2.9 | 3.1 | 228.3 (2018-2021) | 0.7 | ||
| Belgium | 0.1 | 0.9 | 0.2 | 1.1 | 1.8 | 129.2 (2017-2021) | 0.4 | |
| Canada (13) | 2.4 | 2.7 | 1.3 | 1.8 | 2.0 | 1.3 | −10.9 | 0.3 |
|
Source: Global Trade Tracker, 2022 *CAGR: Compound Annual Growth Rate |
||||||||
Australian import requirements
To help protect Australia's unique environment from unwanted pests and diseases, the Department of Agriculture, Fisheries and Forestry regulates products imported into Australia. The importation of some products is, by law, subject to certain biosecurity import conditions. Some products are not permitted entry while other products are only allowed into Australia subject to meeting import conditions that mitigate the biosecurity risk. This may include a requirement for an import permit (Department of Agriculture, Fisheries and Forestry/Biosecurity and trade/Import/Online services and systems/Biosecurity Import Conditions system [BICON]). The Biosecurity Import Conditions system (BICON) can be used to determine whether a commodity intended for import into Australia:
- is permitted
- is subject to import conditions
- requires supporting documentation
- requires treatment
- needs an import permit
It is the importer's responsibility to comply with the department's import conditions when importing into Australia.
Import permits
Most import permits will be issued within 20 working days of completed applications being received and paid for in full. Applications may take longer if:
- they require technical assessment
- incomplete or incorrect information is provided by the applicant
- additional information is required to continue the assessment (applicants will be notified of this by the assessing officers)
- it is a novel product or has been prepared in a novel manner.
As of April 9, 2018, the department will no longer facilitate the clearance of conditionally non-prohibited goods that arrive without the required import permit. Therefore goods that require a permit, but arrive without one, including where an application is currently under consideration, will be directed for export from Australian territory or required to be destroyed in an approved manner.
Canada's performance
Australia was the fourteenth largest global market for pet food with imports valued at US$421.7 million in 2021, representing a moderate increase in CAGR of 11.5% from US$245.1 million in 2016. Of the US$421.7 million of pet food imported by Australia, Canada was Australia's thirteenth largest supplier (representing a 0.3% market share), with imports valued at US$1.3 million, 552.7 thousand kilogramss in 2021.
| HS code | Description | Import value (US$) | Import volume (kilograms) | Market share % |
|---|---|---|---|---|
| Pet food total | 1,328,831 | 552,694 | 100.0 | |
| 230910 | Dog or cat food, put up for retail sale | 1,328,831 | 552,694 | 100.0 |
| Source: Global Trade Tracker, 2022 | ||||
Canada exported US$1.7 million, 806.5 thousand kilogramss of pet food to Australia in 2021. The top pet food supplying Canadian provinces were Ontario, British Columbia and Québec occupying market shares of 97.1%, 2.3% and 0.7% respectively in 2021.
| HS code | Description | Export value (US$) | Export volume (kilograms) | Top provincial suppliers and market value share % | ||
|---|---|---|---|---|---|---|
| Pet food total | 1,722,390 | 806,542 | Ontario 97.1 | British Columbia 2.3 | Québec 0.7 | |
| 230910 | Dog or cat food, put up for retail sale | 1,722,390 | 806,542 | |||
| Source: Global Trade Tracker, 2022 | ||||||
Opportunities for Canada
The Comprehensive and Progressive Agreement for Trans-Pacific Partnership (CPTPP) entered into force on December 30, 2018, and is a free trade agreement between Canada and 10 other countries in the Asia-Pacific. CPTPP covers virtually all sectors and aspects of trade between Canada and member countries to reduce trade barriers and facilitate trade.
The agreement is currently in force among 8 countries: Canada, Australia, Japan, Mexico, New Zealand, Peru, Singapore and Vietnam. For the remaining signatories–Brunei, Chile, and Malaysia –the CPTPP will enter into force sixty days after they have ratified the agreement. (Global Affairs Canada; International trade and investment/trade negotiations and agreements/CPTPP explained)
Export and import tariff information related to Canadian and Australia trade is available through Canada Tariff Finder, including preferential tariff rates and the phasing out period of such tariffs, where applicable. Further, tariff preferences under CPTPP apply to goods imported from Canada that meet chapter 3 - rules of origin/origin procedures.
For Canadian pet food exports, HS codes 2309.10.00.24 canned cat food and 2309.10.00.25 other, Australia's most favoured nation (MFN) tariff rate has been removed ('free' under the CPTPP agreement) for Canadian imports, effective 2018 to 2022.
Product launch analysis
According to Mintel's Global New Products Database (GNPD), there were 605 new pet food products launched in Australia between January 2016 and December 2021. The number of yearly product launches has declined in growth by a CAGR of 2.1% from the larger launch of 109 pet products in 2016 to its lower and most recent launch of 98 pet products in 2021.
Dog snacks & treats, dog food wet and cat food wet, were top subcategories of newly released pet food product launches while no additives/preservatives, free from added/artificial colourings and free from added/artificial flavourings were top claims associated with new pet food products released during the prescribed period.
Flexible stand-up pouch, can and flexible were the predominant package types released, while new product, new variety/range extension and new packaging launch types were the leading product attributes of new pet food products released between January 2016 and December 2021.
Chicken, beef and unflavoured/plain were top flavours (including blends), while chicken meat, minerals and vitamins were top ingredients identified during this period.
| Product attributes | Yearly launch counts | Total | |||||
|---|---|---|---|---|---|---|---|
| 2016 | 2017 | 2018 | 2019 | 2020 | 2021 | ||
| Yearly product launches | 109 | 115 | 100 | 89 | 94 | 98 | 605 |
| Top subcategories | |||||||
| Dog snacks and treats | 60 | 51 | 44 | 50 | 31 | 31 | 267 |
| Dog food wet | 29 | 25 | 17 | 19 | 27 | 20 | 137 |
| Cat food wet | 17 | 24 | 29 | 5 | 18 | 16 | 109 |
| Dog food dry | 2 | 9 | 2 | 10 | 3 | 8 | 34 |
| Cat snacks and treats | 1 | 6 | 8 | 4 | 10 | 4 | 33 |
| Top claims | |||||||
| No additives/preservatives | 45 | 63 | 47 | 52 | 60 | 72 | 339 |
| Free from added/artificial colourings | 34 | 52 | 30 | 41 | 43 | 57 | 257 |
| Free from added/artificial flavourings | 29 | 49 | 29 | 44 | 46 | 50 | 247 |
| Free from added/artificial preservatives | 27 | 41 | 27 | 33 | 43 | 53 | 224 |
| Pet - adult | 35 | 31 | 46 | 34 | 26 | 48 | 220 |
| Top price groupings (US dollars) | |||||||
| 0.43 - 4.42 | 67 | 84 | 72 | 43 | 57 | 36 | 359 |
| 4.43 - 8.42 | 30 | 15 | 13 | 23 | 14 | 20 | 115 |
| 8.43 - 12.42 | 8 | 10 | 5 | 13 | 16 | 16 | 68 |
| 12.43 - 16.42 | 0 | 3 | 10 | 3 | 1 | 8 | 25 |
| 16.43 - 24.00 | 3 | 0 | 0 | 4 | 2 | 6 | 15 |
| Imported status | |||||||
| Not imported | 74 | 65 | 38 | 59 | 40 | 56 | 332 |
| Imported | 25 | 47 | 55 | 25 | 43 | 34 | 229 |
| Top packaged types | |||||||
| Flexible stand-up pouch | 52 | 38 | 33 | 42 | 62 | 59 | 286 |
| Can | 18 | 27 | 25 | 14 | 14 | 14 | 112 |
| Flexible | 15 | 21 | 11 | 16 | 7 | 11 | 81 |
| Tray | 15 | 14 | 15 | 8 | 5 | 8 | 65 |
| Flexible sachet | 6 | 5 | 11 | 4 | 0 | 0 | 26 |
| Top launch types | |||||||
| New product | 55 | 44 | 24 | 37 | 53 | 55 | 268 |
| New variety/range extension | 43 | 61 | 58 | 33 | 28 | 31 | 254 |
| New packaging | 10 | 6 | 7 | 15 | 9 | 5 | 52 |
| Relaunch | 0 | 4 | 10 | 2 | 4 | 7 | 27 |
| New formulation | 1 | 0 | 1 | 2 | 0 | 0 | 4 |
| Top flavours (including blend) | |||||||
| Chicken | 19 | 12 | 15 | 15 | 19 | 18 | 98 |
| Beef | 12 | 9 | 6 | 14 | 5 | 8 | 54 |
| Unflavoured/plain | 3 | 6 | 5 | 5 | 4 | 3 | 26 |
| Kangaroo | 6 | 5 | 2 | 3 | 0 | 1 | 17 |
| Lamb | 4 | 1 | 3 | 2 | 3 | 1 | 14 |
| Top ingredients | |||||||
| Chicken meat | 46 | 52 | 44 | 35 | 43 | 49 | 269 |
| Minerals | 43 | 45 | 32 | 49 | 41 | 51 | 261 |
| Vitamins | 46 | 41 | 33 | 41 | 40 | 45 | 246 |
| Salt | 36 | 38 | 24 | 33 | 27 | 39 | 197 |
| Beef | 41 | 36 | 31 | 30 | 26 | 30 | 194 |
| Source: Mintel GNPD, 2022 | |||||||
Examples of new products
Original Teenie Daily Dog Dental Treats

Source: Mintel 2022
| Company | Mars Petcare |
|---|---|
| Brand | Greenies |
| Category | Pet Food |
| Sub-category | Dog snacks and treats |
| Market | Australia |
| Import status | Imported product |
| Store type | Supermarket |
| Date published | November 2021 |
| Launch type | New packaging |
| Price in US dollars | 19.06 |
Greenies Original Teenie Daily Dog Dental Treats have been repackaged. The product is said to be made with natural ingredients plus vitamins, minerals and nutrients, and feature a unique chewy texture to fight plaque and tartar, clean teeth and maintain healthy gums. The balanced recipe is claimed to be delicious, nutritious, easy to digest with highly soluble ingredients, and to freshen breath. It is vet recommended treat for dental care is formulated to meet the nutritional levels established by the AAFCO Dog Food Nutrient Profiles for adult dog maintenance. The treat is suitable for dogs weighing between 2 kilograms to 7 kilograms, and retails in a 340 gram pack containing 43 units and featuring the VOHC logo.
Beef Dog Food
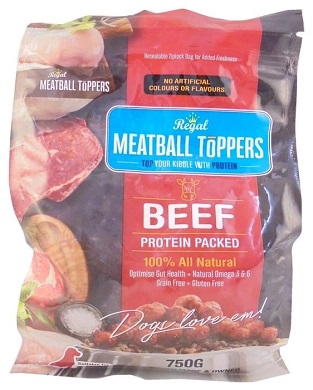
Source: Mintel 2022
| Company | Regal Pet Foods |
|---|---|
| Brand | Regal Meatball Toppers |
| Category | Pet Food |
| Sub-category | Dog Food Wet |
| Market | Australia |
| Import status | Not imported |
| Store type | Supermarket |
| Date published | June 2020 |
| Launch type | New variety / range extension |
| Price in US dollars | 3.21 |
Regal Meatball Toppers Beef Dog Food is said to be packed with proteins and 100% all natural and to top kibble with protein and offer optimise gut health with natural omega 3 and 6. It is claimed to provide the benefits of fresh food with the convenience of dry and is made from at least 90% Australian ingredients. The grain and gluten free product contains no artificial colours or flavours and retails in a 750 gram resealable pack bearing a Facebook reference.
Cat Food with Gourmet Flaked Tuna & Prawn in Gravy
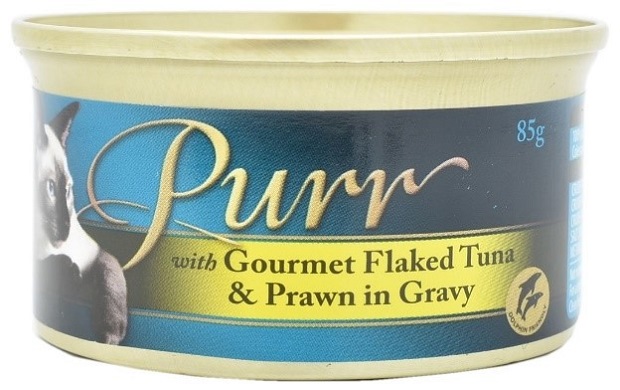
Source: Mintel 2022
| Company | Coles Supermarkets |
|---|---|
| Brand | Purr |
| Category | Pet Food |
| Sub-category | Cat Food Wet |
| Market | Australia |
| Import status | Imported product |
| Store type | Supermarket |
| Date published | March 2019 |
| Launch type | New variety / range extension |
| Price in US dollars | 0.57 |
Purr Cat Food with Gourmet Flaked Tuna & Prawn in Gravy is available now. The dolphin friendly product is free from artificial colours, flavours and preservatives, and retails in an 85 gram recyclable can.
Small Breed Dog Food with Real Beef & Vegies
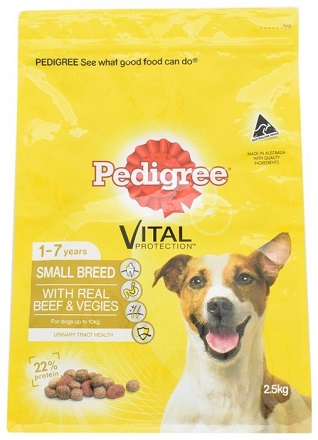
Source: Mintel 2022
| Company | Mars Petcare |
|---|---|
| Brand | Pedigree Vital Protection |
| Category | Pet Food |
| Sub-category | Dog Food Dry |
| Market | Australia |
| Import status | Not imported |
| Store type | Supermarket |
| Date published | July 2018 |
| Product source | Shopper |
| Launch type | New product |
| Price in US dollars | 6.31 |
Pedigree Vital Protection Small Breed Dog Food with Real Beef & Vegies is designed to protect dogs in four ways: to help support a strong immune system, a healthy skin and coat, good digestion and healthy teeth. The pet food contains 22% of protein, and features the following: crunchy kibble pieces provide gentle abrasion against the tooth surface helping to promote good oral health; dietary fibre made with whole grains and added beet pulp to help regulate movement through the gastrointestinal tract and promote a healthy digestive system; enhanced level of omega 6 fatty acids and zinc helps maintain a healthy skin and coat; added vitamin E, an antioxidant, to help support their immune system; and controlled level of minerals to help reduce the risk of urinary tract issue. The product is suitable for small breed dogs up to 10 kilograms and aged between 1 and 7 years, and retails in a 2.5 kilograms recloseable pack bearing the Pedigree Adoption Drive logo.
Seafood Mix Cat Snack

Source: Mintel 2022
| Company | Nestlé Purina PetCare |
|---|---|
| Brand | Purina Felix Party Mix |
| Category | Pet Food |
| Sub-category | Cat Snacks & Treats |
| Market | Australia |
| Import status | Imported product |
| Store type | Supermarket |
| Date published | September 2016 |
| Launch type | New product |
| Price in US dollars | 2.68 |
Purina Felix Party Mix Seafood Mix Cat Snack features tuna, salmon and sea bream flavours, and is said to be an irresistible mix of crunchy meaty treats for cats. The product contains proteins, vitamins and omega-6 fatty acids to enable the cat to lead a healthy and happy life. This product retails in a 60 gram pack featuring the Facebook logo.
For more information
The Canadian Trade Commissioner Service:
International Trade Commissioners can provide Canadian industry with on-the-ground expertise regarding market potential, current conditions and local business contacts, and are an excellent point of contact for export advice.
More agri-food market intelligence:
International agri-food market intelligence
Discover global agriculture and food opportunities, the complete library of Global Analysis reports, market trends and forecasts, and information on Canada's free trade agreements.
Agri-food market intelligence service
Canadian agri-food and seafood businesses can take advantage of a customized service of reports and analysis, and join our email subscription service to have the latest reports delivered directly to their inbox.
More on Canada's agriculture and agri-food sectors:
Canada's agriculture sectors
Information on the agriculture industry by sector. Data on international markets. Initiatives to support awareness of the industry in Canada. How the department engages with the industry.
Resources
- Euromonitor International:
- Country Report: Pet care in Australia, May 2022.
- Country Report: Dog food in Australia, May 2022.
- Country Report: Cat food in Australia, May 2022.
- Country Report: Other pet food in Australia, May 2022.
- Global Affairs Canada: International trade and investment/trade negotiations and agreements/CPTPP explained
- Global Trade Tracker, 2021
- Government of Australia: Department of Agriculture, Fisheries and Forestry/Biosecurity and trade/Import/Online services and systems/Biosecurity Import Conditions system [BICON]).
- Mintel Global New Products Database, 2022
Sector Trend Analysis – Pet food trends in Australia
Global Analysis Report
Prepared by: Laurie Bernardi, International Market Analyst
© His Majesty the King in Right of Canada, represented by the Minister of Agriculture and Agri-Food (2022).
Photo credits
All photographs reproduced in this publication are used by permission of the rights holders.
All images, unless otherwise noted, are copyright His Majesty the King in Right of Canada.
To join our distribution list or to suggest additional report topics or markets, please contact:
Agriculture and Agri-Food Canada, Global Analysis1341 Baseline Rd, Tower 5, 3rd floor
Ottawa ON K1A 0C5
Canada
Email: aafc.mas-sam.aac@agr.gc.ca
The Government of Canada has prepared this report based on primary and secondary sources of information. Although every effort has been made to ensure that the information is accurate, Agriculture and Agri-Food Canada (AAFC) assumes no liability for any actions taken based on the information contained herein.
Reproduction or redistribution of this document, in whole or in part, must include acknowledgement of agriculture and agri-food Canada as the owner of the copyright in the document, through a reference citing AAFC, the title of the document and the year. Where the reproduction or redistribution includes data from this document, it must also include an acknowledgement of the specific data source(s), as noted in this document.
Agriculture and Agri-Food Canada provides this document and other report services to agriculture and food industry clients free of charge.