

Note: This report includes forecasting data that is based on baseline historical data.
Executive summary
Out of 12.2 million households that own a dog(s) and/or a cat(s) and a cat/dog population of 17.2 million in Canada, 50.9% owned a cat(s) compared to 49.1% whom owned a dog(s) in 2024. Over the year in Canada, the total pet population consisted of 8.9 million cats, 8.3 million dogs (majority large dog - 43.5%), 2.5 million birds, 8.6 million fish, 1.2 million small mammals, and 274.3 thousand of reptiles.
In 2023, Canada exported to the world a total of Can$963.3 million (217.1 thousand tonnes) in dog and cat food products - put up for retail sale, and Can$143.5 million (125.6 thousand tonnes) in canary seed - which grew at a combined value compound annual growth rate (CAGR) of 5% (2019-2023). Over the year, leading Canadian provinces exporting the most in value exports of dog/cat food & canary seed were Ontario (44%), Alberta (22%), and British Colombia (14%). Top global export markets from Canada included the United States (Can$561.0 million), China (Can$54.8 million), and Mexico (Can$49.1 million) in 2023.
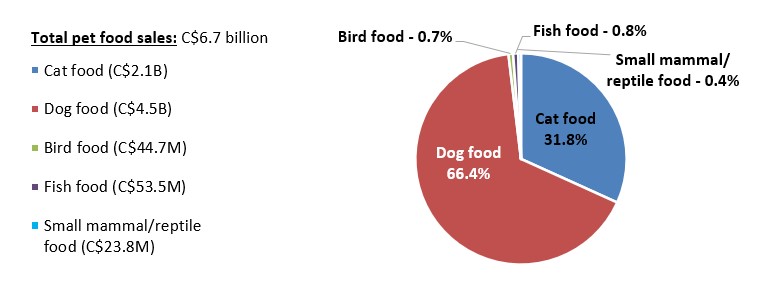
In 2024, pet food retail sales in the Canadian market totalled Can$6.7 billion growing at a CAGR of 10.0% for sales of dog & cat food (Can$6.6 billion) and at a CAGR of 8.1% for sales of other pet food (Can$122.0 million) between 2019 and 2024. Dog food sales accounted for 66.4% of the total market share within the sector, followed by cat food (31.8%), fish food (0.8%), bird food (0.7%), and small mammal/reptile food (0.4%) in 2024.
In 2023, leading companies in the overall pet food sector in Canada included Mars Inc. (top brands - dog: Pedigree, cat: Whiskas) at total sales of Can$1.5 billion or 24.7% value share; followed by Nestlé SA for dog & cat food brands (Dog Chow/Friskies) at Can$1.0 million (16.7%) and The JM Smucker Company (Milk-Bone/Meow Mix) at Can$321.7 million (5.2%).
Top companies (brand) in the other - pet food category in 2023, were Rolf C Hagen Inc. (top brands - bird: Living World, fish: Nutrafin, small mammal/reptile: Exo Terra) at total sales of Can$66.6 million or 1.1% value share in the total pet food sector; Spectrum Brands Holdings Inc. (bird/small mammal/reptile: 8in1, fish/small mammal/reptile: Tetra) at Can$26.4 million (0.4%); and Unicharm Corporation (bird/small mammal/reptile: Hartz) at Can$16.7 million (0.3%) in the overall pet food category.
Sector overview: Pet population and ownership
In 2024, the total cat (8.9 million) and dog (8.3 million) population in Canada was around 17.2 million, equivalent to 6.2 million households (39.5%) owning a cat and 6.0 million households (38.1%) owning a dog. The number of households owning a cat has increased minimally by a CAGR of 0.3% with its cat population increasing by 1.3% (2019-2024). Meanwhile, the number of households owning a dog has increased by a slightly higher CAGR of 3.3% with its dog population increasing by 1.7% over the same period - consisting of small (27.9%), medium (28.6%), and large (43.5%) dogs in 2024.
The other Canadian pet population consisted of birds (2.5 million), fish (8.6 million), small mammals (1.2 million), and reptiles (274.3 thousand) totalled around 12.6 million in 2024. This other pet population has minimally increased by a CAGR of 0.002% (2019-2024) with a decline both in the bird population (−0.001%) and within the small mammal population (−0.1%); and moreover, is expected to continue to decrease by 0.2% (2024-2029).
The globalized pet humanisation trend that extends the development of human products into pet products has continued to grow in Canada. As more owners view their pets as valued family members, pet-friendly home décor products that are functional, practical and pet-friendly have gained in popularity over the historic review period. The presence of pet-friendly and home accessories throughout the home is growing in demand with a wide range of options and designs available, that are tailored around durable and easy-to-clean fabrics, scratch-resistant materials, and pet-safe finishes in furniture such as pet beds built into sofas or chairs, cat-friendly shelving or climbing structures, and built-in feeding stations.Footnote 1
As in pet food, subscription services for curated pet product boxes are also, gaining traction in Canada. Delivery of a wide selection of toys, treats and accessories are tailored to a pet's breed and size by companies like BarkBox or PupBox Canada, which cater to demand for convenience and responds to the desire for novelty. Albeit, consumers are looking for natural and organic products that focus on sustainability and eco-friendly pet products as they become increasingly aware of the impact that these products play on the environment. This sustainable trend includes for example, cat litter and doggie bags that are made from renewable resources and that are biodegradable (ie; eco-friendly self-cleaning litter boxes - Petkit, plant-based litter - Boxiecat, biodegradeable waste bags and recyclable material in toys and accessories - WestPaw).Footnote 1
In addition, since many pet owners were forced to groom their pet in the home during lockdowns, more sophisticated home-grooming and personalized healthcare trends are continuing to gain momentum. Having pet products that offer added customization in its design is a key strategy to meet the owners own style/personality, as well as, meeting the individual pet's unique needs and preferences in terms of comfort and wellbeing. Options include made-to-measure collars with personalized name and contact information, beds with optimal support and comfort made with specific health issues or preferences in mind, along with special advancements in shampoos formulated for a pet's specific coat type, or formulated supplements tailored to their breed's health concerns.Footnote 1
| Categorization type (unit) | 2019 | 2020 | 2021 | 2022 | 2023 | 2024 | CAGR* % 2019-2024 |
|---|---|---|---|---|---|---|---|
| Households owning a cat | 39.0 | 40.0 | 40.2 | 39.9 | 39.6 | 39.5 | 0.3 |
| Households owning a cat ('000) | 5,728.2 | 5,947.7 | 6,027.6 | 6,088.8 | 6,164.2 | 6,226.1 | 1.7 |
| Households owning a dog | 34.7 | 35.8 | 39.0 | 38.4 | 38.1 | 38.1 | 1.9 |
| Households owning a dog ('000) | 5,103.8 | 5,319.8 | 5,847.8 |
5,869.2 |
5,926.9 | 6,002.5 | 3.3 |
| Total - Households owning cat/dog | 10,832.0 | 11,267.5 | 11,875.4 | 11,958.0 | 12,091.1 | 12,228.6 | 2.5 |
|
Source: Euromonitor International, 2024 *CAGR: Compound Annual Growth Rate |
|||||||
| Categorization type | 2019 | 2024 | CAGR* % 2019-2024 | 2025 | 2029 | CAGR* % 2024-2029 |
|---|---|---|---|---|---|---|
| Total - Pet population | 28,489.8 | 29,758.4 | 0.9 | 29,836.0 | 30,284.9 | 0.4 |
| Total - dog and cat population | 15,976.4 | 17,177.5 | 1.5 | 17,287.8 | 17,837.7 | 0.8 |
| Cat population | 8,365.1 | 8,901.6 | 1.3 | 8,936.3 | 9,106.4 | 0.5 |
| Subtotal - dog population | 7,611.3 | 8,275.9 | 1.7 | 8,351.5 | 8,731.3 | 1.1 |
| Small dog (up to 20lbs or 9kg) | 2,030.6 | 2,305.2 | 2.6 | 2,327.9 | 2,463.9 | 1.3 |
| Medium dog (20-50lbs or 9-23kg) | 2,195.2 | 2,368.8 | 1.5 | 2,386.2 | 2,490.7 | 1.0 |
| Large dog (over 50lbs or over 23kg) | 3,385.6 | 3,601.9 | 1.2 | 3,637.4 | 3,776.8 | 1.0 |
| Total - other pet population | 12,513.4 | 12,580.9 | 0.002 | 12,548.2 | 12,447.2 | −0.2 |
| Bird population | 2,515.5 | 2,515.4 | −0.001 | 2,506.4 | 2,478.4 | −0.3 |
| Fish population | 8,502.5 | 8,570.7 | 0.2 | 8,553.5 | 8,489.6 | −0.2 |
| Subtotal - small mammal/reptile | 1,495.4 | 1,494.8 | −0.01 | 1,488.3 | 1,479.2 | −0.2 |
| Small mammal population | 1,225.4 | 1,220.4 | −0.1 | 1,213.1 | 1,200.2 | −0.3 |
| Reptile population | 270.0 | 274.3 | 0.3 | 275.1 | 279.0 | 0.3 |
|
Source: Euromonitor International, 2024 *CAGR: Compound Annual Growth Rate |
||||||
Trade of retail dog / cat food and canary seeds
Global imports
In 2023, the global retail dog and cat food sector totalled an import value of Can$33.0 billion (9,407.1 thousand tonnes). Leading global value import markets over the year, were Germany (Can$3.3 billion), the United States (Can$2.3 billion), and the United Kingdom (Can$2.2 billion). Following Poland (Can$1.9 billion), Canada was the 5th largest importer of dog / cat food products at a value of Can$1.8 billion (419.5 thousand tonnes) in 2023.
Amongst the top 10 import markets in the world with a value market share of 54.5% in 2023, imports of all retail dog and cat food products have been growing by a total CAGR of 13.8% (2019-2023), reaching imports of Can$18.0 billion in 2023. Leading top 10 markets with the highest value growth over this period, were Poland at a CAGR of 19.6%, followed by the UK (17.1%), and Belgium (15.8%) - with Canada's imports growing by a CAGR of 14.0%.
| Country | 2019 | 2020 | 2021 | 2022 | 2023 | CAGR* % 2019-2023 | Market share % in 2023 |
|---|---|---|---|---|---|---|---|
| Total - imports | 19,913.6 | 23,587.9 | 26,004.4 | 30,001.1 | 33,009.1 | 13.5 | 100.0 |
| 1. Germany | 2,009.3 | 2,256.5 | 2,499.1 | 2,733.9 | 3,272.0 | 13.0 | 9.9 |
| 2. United States | 1,363.8 | 1,650.6 | 1,921.5 | 2,812.9 | 2,309.1 | 14.1 | 7.0 |
| 3. United Kingdom | 1,182.1 | 1,305.8 | 1,407.0 | 1,776.0 | 2,226.2 | 17.1 | 6.7 |
| 4. Poland | 922.8 | 1,323.5 | 1,440.8 | 1,486.0 | 1,888.3 | 19.6 | 5.7 |
| 5. Canada | 1,061.3 | 1,203.0 | 1,334.8 | 1,639.0 | 1,794.7 | 14.0 | 5.4 |
| 6. France | 955.0 | 1,207.2 | 1,321.7 | 1,197.7 | 1,615.6 | 14.1 | 4.9 |
| 7. Italy | 899.0 | 944.0 | 1,063.1 | 1,186.3 | 1,463.6 | 13.0 | 4.4 |
| 8. Belgium | 680.6 | 883.0 | 916.7 | 1,079.1 | 1,225.4 | 15.8 | 3.7 |
| 9. Netherlands | 810.3 | 936.5 | 981.0 | 1,021.6 | 1,220.4 | 10.8 | 3.7 |
| 10. Japan | 857.3 | 904.7 | 879.4 | 979.6 | 978.5 | 3.4 | 3.0 |
| Subtotal - top 10 importers | 10,741.6 | 12,614.8 | 13,765.2 | 15,912.1 | 17,993.8 | 13.8 | 54.5 |
|
Source: Global Trade Tracker, 2024 *CAGR: Compound Annual Growth Rate |
|||||||
| Country | 2019 | 2020 | 2021 | 2022 | 2023 | CAGR* % 2019-2023 | Market share % in 2023 |
|---|---|---|---|---|---|---|---|
| Total - global imports | 7,727.9 | 8,594.1 | 9,995.6 | 9,962.2 | 9,407.1 | 5.0 | 100.0 |
| 1. Germany | 740.6 | 780.1 | 834.3 | 843.5 | 842.8 | 3.3 | 9.0 |
| 2. United Kingdom | 502.9 | 524.9 | 562.4 | 606.4 | 677.8 | 7.8 | 7.2 |
| 3. France | 407.6 | 469.3 | 521.9 | 498.1 | 606.4 | 10.4 | 6.4 |
| 4. Poland | 328.3 | 431.6 | 499.2 | 507.8 | 500.1 | 11.1 | 5.3 |
| 5. Canada | 334.9 | 377.8 | 411.7 | 438.1 | 419.5 | 5.8 | 4.5 |
| 6. Italy | 357.3 | 319.4 | 394.3 | 375.0 | 403.6 | 3.1 | 4.3 |
| 7. Belgium | 353.3 | 381.7 | 396.6 | 585.3 | 390.2 | 2.5 | 4.1 |
| 8. Netherlands | 273.1 | 281.9 | 295.5 | 362.9 | 380.5 | 8.6 | 4.0 |
| 9. United States | 248.0 | 292.4 | 317.0 | 390.9 | 313.6 | 6.0 | 3.3 |
| 10. Spain | 210.6 | 238.4 | 566.3 | 294.2 | 311.5 | 10.3 | 3.3 |
| Subtotal - top 10 importers | 3,756.7 | 4,097.6 | 4,799.3 | 4,902.1 | 4,846.0 | 6.6 | 51.5 |
|
Source: Global Trade Tracker, 2024 *CAGR: Compound Annual Growth Rate |
|||||||
In 2023, global imports of canary seeds totalled a value of Can$180.1 million (163.0 thousand tonnes). Leading global value import markets for canary seed were Mexico (Can$46.5 million), Belgium (Can$23.9 million), and Brazil (Can$16.3 million). *Note - as reported from all reporters: Canada was the largest supplier of canary seed, accounting for 70.7% of the global supply to the world, which was equivalent to an export value of Can$119.6 million (102.6 thousand tonnes) in 2023.
Amongst the top 10 import markets in the world holding a market share of 76.7%, imports of all canary seed have been growing by a total CAGR of 5.8% (2019-2023), reaching imports of Can$138.0 million in 2023. Leading top 10 markets with the highest value growth over this period, was Saudi Arabia at a CAGR of 33.5%, followed by Mexico (15.6%), the United States (12.7%), and Turkey (12.7%). Declining top 10 markets between 2019 and 2023, were Brazil (−7.4%), Colombia (−3.3%), and Indonesia (−2.1%).
| Country | 2019 | 2020 | 2021 | 2022 | 2023 | CAGR* % 2019-2023 | Market share % in 2023 |
|---|---|---|---|---|---|---|---|
| Total - global imports | 153.7 | 162.1 | 173.1 | 193.9 | 180.1 | 4.0 | 100.0 |
| 1. Mexico | 26.0 | 33.7 | 41.7 | 22.1 | 46.5 | 15.6 | 25.8 |
| 2. Belgium | 20.4 | 24.9 | 20.7 | 27.3 | 23.9 | 4.0 | 13.3 |
| 3. Brazil | 22.2 | 20.6 | 16.4 | 18.8 | 16.3 | −7.4 | 9.1 |
| 4. Spain | 8.9 | 10.0 | 10.8 | 14.6 | 10.2 | 3.6 | 5.7 |
| 5. United States | 5.5 | 6.6 | 7.9 | 10.2 | 8.9 | 12.7 | 4.9 |
| 6. Indonesia | 8.0 | 4.1 | 6.7 | 9.6 | 7.3 | −2.1 | 4.1 |
| 7. Colombia | 8.1 | 6.7 | 10.2 | 11.3 | 7.0 | −3.3 | 3.9 |
| 8. Italy | 5.8 | 5.1 | 6.1 | 6.1 | 6.6 | 3.5 | 3.7 |
| 9. Turkey | 3.7 | 3.3 | 2.4 | 2.7 | 6.0 | 12.7 | 3.3 |
| 10. Saudi Arabia | 1.7 | 2.4 | 4.3 | 7.3 | 5.3 | 33.5 | 2.9 |
| Subtotal - top 10 importers | 110.2 | 117.4 | 127.2 | 130.0 | 138.0 | 5.8 | 76.7 |
|
Source: Global Trade Tracker, 2024 *CAGR: Compound Annual Growth Rate |
|||||||
| Country | 2019 | 2020 | 2021 | 2022 | 2023 | CAGR* % 2019-2023 | Market share % in 2023 |
|---|---|---|---|---|---|---|---|
| Total - global imports | 96,382 | 97,728 | 200,221 | 169,076 | 163,040 | −4.5 | 100.0 |
| 1. Mexico | 34,177 | 38,807 | 42,905 | 17,960 | 39,253 | 3.5 | 24.1 |
| 2. Belgium | 27,980 | 31,090 | 25,211 | 24,199 | 20,642 | −7.3 | 12.7 |
| 3. Brazil | 29,114 | 28,001 | 26,497 | 25,933 | 19,999 | −9.0 | 12.3 |
| 4. Turkey | 6,127 | 5,017 | 3,865 | 4,172 | 8,823 | 9.5 | 5.4 |
| 5. Spain | 11,926 | 11,357 | 11,760 | 11,311 | 8,816 | −7.3 | 5.4 |
| 6. United States | 7,887 | 8,327 | 8,332 | 7,864 | 8,068 | 0.6 | 4.9 |
| 7. Indonesia | 11,079 | 5,005 | 7,357 | 7,035 | 6,639 | −12.0 | 4.1 |
| 8. Italy | 7,555 | 6,289 | 7,012 | 4,899 | 5,875 | −6.1 | 3.6 |
| 9. Colombia | 10,733 | 7,826 | 10,429 | 7,941 | 5,569 | −15.1 | 3.4 |
| 10. Saudi Arabia | 1,675 | 2,446 | 3,603 | 5,688 | 4,733 | 29.7 | 2.9 |
| Subtotal - top 10 importers | 148,253 | 144,165 | 146,971 | 117,002 | 128,417 | −3.5 | 78.8 |
|
Source: Global Trade Tracker, 2024 *CAGR: Compound Annual Growth Rate |
|||||||
Canada's export performance
As reported by Canada in 2023, Canada exported to the world a total import value of Can$963.3 million (217.1 thousand tonnes) in dog and cat food products and Can$143.5 million (125.6 thousand tonnes) in canary seed. Leading global value export markets for both Canadian dog / cat food and canary seed products were the United States (Can$561.0 million) at a market share of 50.7% in 2023, followed by China (Can$54.8 million), and Mexico (Can$49.1 million). Top provinces for exporting these products were Ontario at a market share of 44.0%, Alberta (21.7%), British Colombia (14.3%), Québec (9.8%), and Saskatchewan (9.3%) in 2023.
The largest growing import markets for both dog / cat food and canary seed were the Netherlands, the United States, and Italy (2019-2023). During this period, supply to China of these same products has decreased by a CAGR of 16.7%.
| Country | 2019 | 2020 | 2021 | 2022 | 2023 | CAGR* % 2019-2023 | Market share % in 2023 |
|---|---|---|---|---|---|---|---|
| Total - exports from Canada | 909.9 | 1,127.3 | 1,198.4 | 1,193.0 | 1,106.8 | 5.0 | 100.0 |
| 1. United States | 335.1 | 400.0 | 426.1 | 502.4 | 561.0 | 13.8 | 50.7 |
| 2. China | 113.6 | 233.4 | 231.3 | 120.3 | 54.8 | −16.7 | 4.9 |
| 3. Mexico | 37.9 | 49.7 | 50.6 | 48.6 | 49.1 | 6.7 | 4.4 |
| 4. Spain | 25.7 | 25.9 | 32.7 | 46.0 | 37.3 | 9.8 | 3.4 |
| 5. Japan | 23.6 | 23.2 | 28.1 | 24.9 | 32.2 | 8.1 | 2.9 |
| 6. Netherlands | 16.7 | 17.5 | 26.0 | 28.0 | 32.1 | 17.7 | 2.9 |
| 7. South Korea | 22.0 | 24.1 | 36.8 | 36.3 | 29.4 | 7.5 | 2.7 |
| 8. Taiwan | 20.1 | 19.9 | 19.2 | 32.5 | 28.9 | 9.6 | 2.6 |
| 9. New Zealand | 21.2 | 21.8 | 21.5 | 20.9 | 24.4 | 3.6 | 2.2 |
| 10. Italy | 14.9 | 15.5 | 18.3 | 23.5 | 22.7 | 11.0 | 2.1 |
| Subtotal - top 10 importers | 630.9 | 830.8 | 890.6 | 883.2 | 872.0 | 8.4 | 78.8 |
|
Source: Global Trade Tracker, 2024 *CAGR: Compound Annual Growth Rate |
|||||||
| Country | 2019 | 2020 | 2021 | 2022 | 2023 | CAGR* % 2019-2023 | Market share % in 2023 |
|---|---|---|---|---|---|---|---|
| Total - exports from Canada | 414,632 | 456,055 | 466,609 | 401,003 | 342,671 | −4.7 | 100.0 |
| 1. United States | 111,539 | 124,896 | 126,264 | 112,820 | 102,553 | −2.1 | 29.9 |
| 2. Mexico | 41,073 | 44,922 | 45,498 | 40,104 | 41,336 | 0.2 | 12.1 |
| 3. China | 37,437 | 72,953 | 77,709 | 40,283 | 17,423 | −17.4 | 5.1 |
| 4. Spain | 16,012 | 14,502 | 16,223 | 19,676 | 15,490 | −0.8 | 4.5 |
| 5. Belgium | 20,703 | 16,964 | 16,629 | 8,327 | 14,582 | −8.4 | 4.3 |
| 6. Japan | 8,803 | 8,328 | 9,971 | 8,612 | 10,804 | 5.3 | 3.2 |
| 7. Taiwan | 7,247 | 7,074 | 7,070 | 11,106 | 9,806 | 7.9 | 2.9 |
| 8. Netherlands | 4,985 | 5,462 | 8,013 | 8,523 | 9,311 | 16.9 | 2.7 |
| 9. Italy | 8,955 | 8,378 | 9,622 | 10,224 | 9,207 | 0.7 | 2.7 |
| 10. South Korea | 6,385 | 7,037 | 11,301 | 11,107 | 8,327 | 6.9 | 2.4 |
| Subtotal - top 10 importers | 263,139 | 310,516 | 328,300 | 270,782 | 238,839 | −2.4 | 69.7 |
|
Source: Global Trade Tracker, 2024 *CAGR: Compound Annual Growth Rate |
|||||||
| Category | 2019 | 2020 | 2021 | 2022 | 2023 | CAGR* % 2019-2023 | Market share % in 2023 |
|---|---|---|---|---|---|---|---|
| Total - exports from Canada | 909.9 | 1,127.3 | 1,198.4 | 1,193.0 | 1,106.8 | 5.0 | 100.0 |
| Subtotal - Dog or cat food, retail | 794.3 | 1,011.7 | 1,057.8 | 1,027.2 | 963.3 | 4.9 | 87.0 |
| Dog or cat food, in airtight containers | 480.0 | 640.4 | 663.5 | 618.8 | 523.9 | 2.2 | 47.3 |
| Dog or cat food, not in airtight containers | 314.3 | 371.3 | 394.3 | 408.3 | 439.4 | 8.7 | 39.7 |
| Canary seed | 115.7 | 115.6 | 140.7 | 165.9 | 143.5 | 5.6 | 13.0 |
|
Source: Global Trade Tracker, 2024 *CAGR: Compound Annual Growth Rate |
|||||||
| Category | 2019 | 2020 | 2021 | 2022 | 2023 | CAGR* % 2019-2023 | Market share % in 2023 |
|---|---|---|---|---|---|---|---|
| Total - exports from Canada | 414,633 | 456,051 | 466,612 | 401,003 | 342,675 | −4.7 | 100.0 |
| Subtotal - Dog or cat food, retail | 245,443 | 305,653 | 316,897 | 267,534 | 217,120 | −3.0 | 63.4 |
| Dog or cat food, in airtight containers | 146,463 | 197,157 | 206,226 | 176,737 | 139,154 | −1.3 | 40.6 |
| Dog or cat food, not in airtight containers | 98,981 | 108,496 | 110,671 | 90,797 | 77,967 | −5.8 | 22.8 |
| Canary seed | 169,190 | 150,398 | 149,715 | 133,469 | 125,555 | −7.2 | 36.6 |
|
Source: Global Trade Tracker, 2024 *CAGR: Compound Annual Growth Rate |
|||||||
| Province/territory | 2019 | 2020 | 2021 | 2022 | 2023 | CAGR* % 2019-2023 | Market share % in 2023 |
|---|---|---|---|---|---|---|---|
| Total - exports from Canada | 909.9 | 1,127.3 | 1,198.4 | 1,193.0 | 1,106.8 | 5.0 | 100.0 |
| Ontario | 380.2 | 528.0 | 515.9 | 502.9 | 486.5 | 6.4 | 44.0 |
| Alberta | 260.7 | 301.0 | 347.9 | 307.7 | 239.8 | −2.1 | 21.7 |
| British Colombia | 88.0 | 120.4 | 126.5 | 139.2 | 158.6 | 15.9 | 14.3 |
| Québec | 68.3 | 69.8 | 99.7 | 116.3 | 108.4 | 12.3 | 9.8 |
| Saskatchewan | 107.4 | 99.8 | 102.4 | 118.3 | 102.5 | −1.2 | 9.3 |
| New Brunswick | 1.2 | 2.9 | 2.6 | 3.9 | 5.5 | 45.1 | 0.5 |
| Manitoba | 3.9 | 5.3 | 3.5 | 4.5 | 5.3 | 8.1 | 0.5 |
| Nova Scotia | 0.137 | 0.101 | 0.060 | 0.084 | 0.171 | 5.8 | 0.02 |
| Prince Edward Island | 0.0 | 0.0 | 0.0 | 0.0 | 0.069 | 0.01 | |
| Newfoundland and Labrador | 0.034 | 0.010 | 0.006 | 0.0 | 0.0 | −72.4 | 0.0 |
|
Source: Global Trade Tracker, 2024 *CAGR: Compound Annual Growth Rate |
|||||||
| Province/territory | 2019 | 2020 | 2021 | 2022 | 2023 | CAGR* % 2019-2023 | Market share % in 2023 |
|---|---|---|---|---|---|---|---|
| Total - exports from Canada | 414,635 | 456,052 | 466,613 | 401,002 | 342,676 | −4.7 | 100.0 |
| Ontario | 127,814 | 169,166 | 159,635 | 130,382 | 106,850 | −4.4 | 31.2 |
| Saskatchewan | 154,099 | 127,239 | 106,803 | 94,024 | 89,381 | −12.7 | 26.1 |
| Alberta | 77,070 | 93,591 | 109,577 | 94,363 | 73,002 | −1.3 | 21.3 |
| Québec | 26,308 | 30,673 | 49,866 | 51,706 | 41,579 | 12.1 | 12.1 |
| British Colombia | 24,333 | 28,495 | 36,296 | 25,615 | 26,306 | 2.0 | 7.7 |
| Manitoba | 4,509 | 5,795 | 3,398 | 3,352 | 3,365 | −7.1 | 1.0 |
| New Brunswick | 453 | 1,058 | 1,016 | 1,532 | 2,122 | 47.1 | 0.6 |
| Nova Scotia | 36 | 31 | 18 | 28 | 52 | 9.6 | 0.0 |
| Prince Edward Island | 19 | 0.0 | |||||
| Newfoundland and Labrador | 13 | 4 | 4 | −100.0 | 0.0 | ||
|
Source: Global Trade Tracker, 2024 *CAGR: Compound Annual Growth Rate |
|||||||
Pet food retail sales Canada
In 2024, retail sales of pet food in the Canadian markets totalled Can$6.7 billion growing at a CAGR of 10.0% for sales of dog and cat food (Can$6.6 billion, share: 98.2%) and at a CAGR of 8.1% for sales of other pet food (Can$122.0 million, share: 1.8%) between 2019 and 2024. Dog food sales accounted for 66.4% of the total market share within the pet food sector, followed by cat food (31.8%), fish food (0.8%), bird food (0.7%), and small mammal/reptile food (0.4%) in 2024.
Despite economic difficulties, pet food companies in Canada have adapted their products to match key trends to best cater to an increasingly demanding and sophisticated consumer base. In recognizing the growing focus on premiumization and natural ingredients, players like Nestlé Purina PetCare and Hill's Pet Nutrition Canada has expanded their brand/product lines to include free from grain, human-grade and other health-oriented (value added) ingredients. New entrants like PetPlate Canada tailoring around delivering fresh, pre-portioned meal pet offerings are also gaining traction.Footnote 2
Total pet food sales between 2024 and 2029 are expected to slightly slow down at a CAGR of 7.1% to reach a value of Can$9.5 billion in 2029. Over this period, other pet food sales (including fish, bird, small mammal/reptile food) are set to decline the most in growth at a CAGR of 4.4% to reach sales of Can$151.4 million in 2029.
Description of above image
- Cat food (Can$2.1 billion): 31.8%
- Dog food (Can$4.5 billion): 66.4%
- Bird food (Can$44.7 million): 0.7%
- Fish food (Can$53.5 million): 0.8%
- Small mammal/reptile food (Can$23.8 million): 0.4%
Total pet food sales: Can$6.7 billion
Source: Euromonitor International, 2024
| Categorization type | 2019 | 2024 | CAGR* % 2019-2024 | 2025 | 2029 | CAGR* % 2024-2029 |
|---|---|---|---|---|---|---|
| Total - Pet food | 4,188.7 | 6,723.9 | 9.9 | 7,240.6 | 9,474.2 | 7.1 |
| Dog and cat food | 4,105.9 | 6,601.9 | 10.0 | 7,111.5 | 9,322.8 | 7.1 |
| Other pet food | 82.8 | 122.0 | 8.1 | 129.1 | 151.4 | 4.4 |
|
Source: Euromonitor International, 2024 *CAGR: Compound Annual Growth Rate |
||||||
Dog food trends
Retail sales of dog food in Canada totalled Can$4.5 billion in 2024, with sales of dry dog food consisting of 71.5%, dog treat and mixers (19.3%), and wet dog food (9.2%). Overall, wet dog food was the best performing category in 2024, with retail value sales rising by 9% in current terms. Catering to a more sophisticated demand, dehydrated and raw food options are gaining traction by offering dogs a fresh, minimally processed alternative to traditional kibble.Footnote 3
In 2024, in the dry dog food category (Can$3.2 billion), premium dry (Can$2.1 billion) registered the largest sales, followed by mid-priced dry (Can$980.7 million) and economy dry (Can$78.6 million). Dog treat and mixers totalled Can$860.1 million in Canada, while in the wet dog food category (Can$411.0 million), premium wet (Can$194.3 million) was the most popular over mid-priced wet (Can$190.8 million) and economy wet food (Can$25.9 million).
Canadian pet owners chose to buy a share of 87.2% in prepared dog food for consumption, compared to 12.8% of non-prepared dog food in 2024. Adult dry dog food was purchased the most often (26.7%) of the time in its category, followed by senior dry (20.8%), and pup dry (12.3%) in 2024 - with other regular dog dry (40.2%). Meanwhile, in the wet dog food category over the life-cycle of dogs, dog food products were distributed amongst adults wet (24.8%), seniors wet (20.9%), pups wet (12.3%), with 42% remaining in sales of other regular dog wet food over the year.
In 2029, total retail sales of dog food is expected to reach Can$6.4 billion growing at a CAGR of 7.6% (2024-2029). Dry dog food sales is expected to account for 72.4%, followed by sales of dog treats and mixers (18.0%), and wet dog food (9.6%) in 2029. Sales of all types of dog food, treats and mixers are expected to slow down in growth between the forecast period, at the exception of the economy dry dog food category moving from a 6-yr historical CAGR of 5.5% in 2024 to 7.2% by 2029. Pet owners are expected to continue to more frequently buy premium dry food (CAGR: 9.3%) versus economy (7.2%) and mid-priced (4.5%) dry food over the next review period; while premium wet (+10.3%) dog food is also forecast to remain the largest in its wet dog food category.
| Category | 2019 | 2020 | 2021 | 2022 | 2023 | 2024 |
|---|---|---|---|---|---|---|
| Total - dog food | 2,660.2 | 2,951.4 | 3,181.4 | 3,732.5 | 4,116.9 | 4,465.1 |
| Dog treats and mixers | 470.8 | 522.4 | 569.5 | 706.1 | 801.3 | 860.1 |
| Subtotal - dry dog food | 1,968.5 | 2,169.3 | 2,325.6 | 2,686.1 | 2,938.6 | 3,194.0 |
| Economy dry | 60.2 | 65.1 | 67.4 | 71.1 | 73.4 | 78.6 |
| Mid-priced dry | 681.7 | 749.5 | 795.4 | 878.9 | 936.0 | 980.7 |
| Premium dry | 1,226.6 | 1,354.7 | 1,462.8 | 1,736.0 | 1,929.1 | 2,134.7 |
| Subtotal - wet dog food | 220.8 | 259.7 | 286.3 | 340.3 | 377.0 | 411.0 |
| Economy wet | 16.6 | 19.0 | 20.3 | 23.0 | 24.8 | 25.9 |
| Mid-priced wet | 104.2 | 122.3 | 134.6 | 159.5 | 176.1 | 190.8 |
| Premium wet | 100.0 | 118.4 | 131.4 | 157.8 | 176.2 | 194.3 |
| Source: Euromonitor International, 2024 | ||||||
| Category | Annual growth % 2024/2023 | CAGR* % 2019-2024 | Total growth % 2019-2024 |
|---|---|---|---|
| Total - dog food | 8.5 | 10.9 | 67.8 |
| Dog treats and mixers | 7.3 | 12.8 | 82.7 |
| Subtotal - dry dog food | 8.7 | 10.2 | 62.3 |
| Economy dry | 7.1 | 5.5 | 30.6 |
| Mid-priced dry | 4.8 | 7.5 | 43.9 |
| Premium dry | 10.7 | 11.7 | 74.0 |
| Subtotal - wet dog food | 9.0 | 13.2 | 86.1 |
| Economy wet | 4.4 | 9.3 | 56.0 |
| Mid-priced wet | 8.3 | 12.9 | 83.1 |
| Premium wet | 10.3 | 14.2 | 94.3 |
|
Source: Euromonitor International, 2024 *CAGR: Compound Annual Growth |
|||
| Category | 2024 | 2025 | 2026 | 2027 | 2028 | 2029 |
|---|---|---|---|---|---|---|
| Total - dog food | 4,465.1 | 4,832.4 | 5,209.0 | 5,601.8 | 6,014.8 | 6,432.5 |
| Dog treats and mixers | 860.1 | 918.6 | 975.6 | 1,034.8 | 1,096.8 | 1,156.7 |
| Subtotal - dry dog food | 3,194.0 | 3,466.0 | 3,748.6 | 4,041.9 | 4,349.2 | 4,659.9 |
| Economy dry | 78.6 | 83.9 | 89.5 | 95.9 | 103.7 | 111.3 |
| Mid-priced dry | 980.7 | 1,028.0 | 1,076.9 | 1,123.6 | 1,173.5 | 1,219.4 |
| Premium dry | 2,134.7 | 2,354.1 | 2,582.3 | 2,822.4 | 3,071.9 | 3,329.2 |
| Subtotal - wet dog food | 411.0 | 447.8 | 484.9 |
525.1 |
568.8 | 615.9 |
| Economy wet | 25.9 | 27.0 | 28.1 | 29.2 | 30.4 | 31.6 |
| Mid-priced wet | 190.8 | 206.3 | 220.3 | 235.0 | 250.6 | 267.1 |
| Premium wet | 194.3 | 214.4 | 236.5 | 260.9 | 287.8 | 317.2 |
| Source: Euromonitor International, 2024 | ||||||
| Category | Annual growth % 2025/2024 | CAGR* % 2024-2029 | Total growth % 2024-2029 |
|---|---|---|---|
| Total - dog food | 8.2 | 7.6 | 44.1 |
| Dog treats and mixers | 6.8 | 6.1 | 34.5 |
| Subtotal - dry dog food | 8.5 | 7.8 | 45.9 |
| Economy dry | 6.7 | 7.2 | 41.6 |
| Mid-priced dry | 4.8 | 4.5 | 24.3 |
| Premium dry | 10.3 | 9.3 | 56.0 |
| Subtotal - wet dog food | 9.0 | 8.4 | 49.9 |
| Economy wet | 4.2 | 4.1 | 22.0 |
| Mid-priced wet | 8.1 | 7.0 | 40.0 |
| Premium wet | 10.3 | 10.3 | 63.3 |
|
Source: Euromonitor International, 2024 *CAGR: Compound Annual Growth |
|||
| Categorization type | 2019 | 2020 | 2021 | 2022 | 2023 | 2024 |
|---|---|---|---|---|---|---|
| Prepared dog food | 87.1 | 87.1 | 87.2 | 87.2 | 87.1 | 87.2 |
| Non-prepared dog food | 12.9 | 12.9 | 12.8 | 12.8 | 12.9 | 12.8 |
| Source: Euromonitor International, 2024 | ||||||
| Category | Category type | 2019 | 2020 | 2021 | 2022 | 2023 | 2024 |
|---|---|---|---|---|---|---|---|
| Dry dog food | Pup | 12.2 | 12.4 | 12.4 | 12.4 | 12.4 | 12.3 |
| Adult | 26.4 | 26.5 | 26.5 | 26.6 | 26.6 | 26.7 | |
| Senior | 21.0 | 20.6 | 20.7 | 20.7 | 20.7 | 20.8 | |
| Other - regular | 40.4 | 40.4 | 40.4 | 40.3 | 40.3 | 40.2 | |
| Total - dry | 100.0 | 100.0 | 100.0 | 100.0 | 100.0 | 100.0 | |
| Wet dog food | Pup | 12.2 | 12.5 | 12.4 | 12.4 | 12.3 | 12.3 |
| Adult | 24.3 | 24.4 | 24.4 | 24.5 | 24.5 | 24.8 | |
| Senior | 21.2 | 20.8 | 20.8 | 20.8 | 20.9 | 20.9 | |
| Other - regular | 42.3 | 42.3 | 42.4 | 42.3 | 42.3 | 42.0 | |
| Total - wet | 100.0 | 100.0 | 100.0 | 100.0 | 100.0 | 100.0 | |
| Source: Euromonitor International, 2024 | |||||||
Cat food trends
Retail sales of cat food in Canada totalled Can$2.1 billion in 2024, with sales of dry cat food consisting of 52.8%, wet cat food (35.4%), and cat treat and mixers (11.3%). Overall, cat treats and mixers was the best performing category in 2024, with retail value sales rising by 9% in current terms. As in dog food, the trend towards premium (high-quality), natural (whole-food ingredients), and specialized diet offerings continued in cat food in Canada at the end of the review period. Moreover, Canadian sourced, freeze-dried and raw cat food, which focus on high meat content and limited processed ingredients are especially winning over local consumers.Footnote 4
Over this year in the dry cat food category (Can$1.1 billion), premium dry (Can$601.5 million) registered the largest sales, followed by mid-priced dry (Can$473.0 million) and economy dry cat food (Can$53.8 million). Cat treat and mixers totalled Can$252.3 million in Canada, while in the wet cat food category (Can$756.2 million), premium wet (Can$397.8 million) was the most popular over mid-priced wet (Can$322.8 million) and economy wet (Can$35.7 million) in 2024.
Canadian pet owners chose to buy a share of 95.7% in prepared cat food for consumption, compared to 4.3% of non-prepared cat food in 2024. In the dry cat food category over the life-cycle of cats, pet food products were purchased most amongst adults dry (25.8%), followed by senior dry (15.2%), and kittens dry (7.7%) in 2024 - with other regular cat dry (51.2%). Meanwhile, adult wet cat food was purchased the most often (26.4%) of the time, then senior wet (15.5%) and kitten wet (10.1%) in 2024 - with other regular wet cat food (48.0%).
In 2029, total retail sales of cat food is expected to reach Can$2.9 billion growing at a CAGR of 6.2% (2024-2029). Dry cat food sales are expected to account for 49.6%, followed by wet cat food (37.5%) and cat treats and mixers (13.0%) in 2029. Sales of all types of cat food, treats and mixers are expected to slow down in growth between the forecast period. Both premium wet (CAGR: 8.8%) and premium dry (5.7%) cat food during the forecast period is expected to remain as the most popular format types bought by Canadian cat owners.
| Category | 2019 | 2020 | 2021 | 2022 | 2023 | 2024 |
|---|---|---|---|---|---|---|
| Total - cat food | 1,445.7 | 1,584.4 | 1,664.1 | 1,848.8 | 1,994.9 | 2,136.9 |
| Cat treats and mixers | 157.6 | 172.7 | 183.0 | 20.5 | 231.0 | 252.3 |
| Subtotal - dry cat food | 831.3 | 888.9 | 915.3 | 1,000.4 | 1,064.4 | 1,128.3 |
| Economy dry | 44.9 | 46.2 | 46.7 | 48.9 | 52.1 | 53.8 |
| Mid-priced dry | 359.1 | 382.4 | 391.7 | 419.9 | 446.8 | 473.0 |
| Premium dry | 427.3 | 460.3 | 476.9 | 531.5 | 565.6 | 601.5 |
| Subtotal - wet cat food | 456.8 | 522.9 | 565.8 | 639.9 | 699.4 | 756.2 |
| Economy wet | 25.1 | 28.0 | 29.5 | 32.2 | 34.3 | 35.7 |
| Mid-priced wet | 204.2 | 232.1 | 250.1 | 279.9 | 303.5 | 322.8 |
| Premium wet | 227.5 | 262.7 | 286.2 | 327.9 | 361.6 | 397.8 |
| Source: Euromonitor International, 2024 | ||||||
| Category | Annual growth % 2024/2023 | CAGR* % 2019-2024 | Total growth % 2019-2024 |
|---|---|---|---|
| Total - cat food | 7.1 | 8.1 | 47.8 |
| Cat treats and mixers | 9.2 | 9.9 | 60.1 |
| Subtotal - dry cat food | 6.0 | 6.3 | 35.7 |
| Economy dry | 3.3 | 3.7 | 19.8 |
| Mid-priced dry | 5.9 | 5.7 | 31.7 |
| Premium dry | 6.3 | 7.1 | 40.8 |
| Subtotal - wet cat food | 8.1 | 10.6 | 65.5 |
| Economy wet | 4.1 | 7.3 | 42.2 |
| Mid-priced wet | 6.4 | 9.6 | 58.1 |
| Premium wet | 10.0 | 11.8 | 74.9 |
|
Source: Euromonitor International, 2024 *CAGR: Compound Annual Growth |
|||
| Category | 2024 | 2025 | 2026 | 2027 | 2028 | 2029 |
|---|---|---|---|---|---|---|
| Total - cat food | 2,136.9 | 2,279.1 | 2,424.3 | 2,575.0 | 2,730.9 | 2,890.3 |
| Cat treats and mixers | 252.3 | 275.5 | 298.6 | 322.8 | 348.3 | 374.7 |
| Subtotal - dry cat food | 1,128.3 | 1,189.6 | 1,250.7 | 1,311.7 | 1,373.0 | 1,433.0 |
| Economy dry | 53.8 | 55.2 | 56.4 | 57.6 | 58.5 | 59.1 |
| Mid-priced dry | 473.0 | 494.9 | 516.8 | 538.7 | 560.6 | 581.7 |
| Premium dry | 601.5 | 639.5 | 677.5 | 715.5 | 754.0 | 792.1 |
| Subtotal - wet cat food | 756.2 | 814.0 | 875.0 | 940.4 | 1,009.6 | 1,082.6 |
| Economy wet | 35.7 | 37.0 | 38.4 | 39.8 | 41.2 | 42.6 |
| Mid-priced wet | 322.8 | 343.0 | 363.8 | 385.6 | 408.7 | 432.2 |
| Premium wet | 397.8 | 434.0 | 472.8 | 515.0 | 559.7 | 607.8 |
| Source: Euromonitor International, 2024 | ||||||
| Category | Annual growth % 2025/2024 | CAGR* % 2024-2029 | Total growth % 2024-2029 |
|---|---|---|---|
| Total - cat food | 6.7 | 6.2 | 35.3 |
| Cat treats and mixers | 9.2 | 8.2 | 48.5 |
| Subtotal - dry cat food | 5.4 | 4.9 | 27.0 |
| Economy dry | 2.6 | 1.9 | 9.9 |
| Mid-priced dry | 4.6 | 4.2 | 23.0 |
| Premium dry | 6.3 | 5.7 | 31.7 |
| Subtotal - wet cat food | 7.6 | 7.4 | 43.2 |
| Economy wet | 3.6 | 3.6 | 19.3 |
| Mid-priced wet | 6.3 | 6.0 | 33.9 |
| Premium wet | 9.1 | 8.8 | 52.8 |
|
Source: Euromonitor International, 2024 *CAGR: Compound Annual Growth |
|||
| Categorization type | 2019 | 2020 | 2021 | 2022 | 2023 | 2024 |
|---|---|---|---|---|---|---|
| Prepared cat food | 96.1 | 96.2 | 96.2 | 96.0 | 95.7 | 95.7 |
| Non-prepared cat food | 3.9 | 3.8 | 3.8 | 4.0 | 4.3 | 4.3 |
| Source: Euromonitor International, 2024 | ||||||
| Category | Category type | 2019 | 2020 | 2021 | 2022 | 2023 | 2024 |
|---|---|---|---|---|---|---|---|
| Dry cat food | Kitten | 7.7 | 7.8 | 7.8 | 7.8 | 7.8 | 7.7 |
| Adult | 25.6 | 25.7 | 25.7 | 25.8 | 25.8 | 25.8 | |
| Senior | 15.6 | 15.4 | 15.3 | 15.3 | 15.3 | 15.2 | |
| Other - regular | 51.1 | 51.1 | 51.1 | 51.2 | 51.2 | 51.2 | |
| Total - dry | 100.0 | 100.0 | 100.0 | 100.0 | 100.0 | 100.0 | |
| Wet cat food | Kitten | 9.9 | 10.2 | 10.2 | 10.1 | 10.1 | 10.1 |
| Adult | 26.3 | 26.2 | 26.3 | 26.3 | 26.3 | 26.4 | |
| Senior | 15.3 | 15.1 | 15.1 | 15.1 | 15.3 | 15.5 | |
| Other - regular | 48.5 | 48.4 | 48.4 | 48.5 | 48.3 | 48.0 | |
| Total - wet | 100.0 | 100.0 | 100.0 | 100.0 | 100.0 | 100.0 | |
| Source: Euromonitor International, 2024 | |||||||
Other pet food trends: bird, fish, small mammal / reptile
In Canada in 2024, retail sales of other pet food products such as bird, fish, and small mammal/reptile food totalled Can$122.0 million growing at a CAGR of 8.1% (2019-2024). Value sales of fish food consisted of Can$53.5 million (43.9%), bird food at Can$44.7 million (36.6%), and small mammal/reptile food at Can$23.8 million (19.5%) in the category in 2024.
Fish dominates the other pet population in Canada, with an aquarium hobby driving an increase in the demand for fish food. Overall, however, with a rise in more people keeping reptiles as pets (and a strong commitment and willingness to invest more in larger, more elaborate set-ups), small mammal/reptile food was the best performing category in 2024 - with retail value sales rising by 9% in current terms. Premium and natural trends mirror dog and cat food developments, which has translated into a rise in demand for pet food (particularly frozen and freeze-dried) that is free from artificial colours, flavours and preservatives. Manufacturers of brands like Mazuri (bird food) and Omega One (fish food) are capitalizing on this demand trend by offering food made with whole grains, vegetables and high-quality proteins.Footnote 5
In 2029, total retail sales in other pet food products in Canada are forecast to reach Can$151.4 million growing at a CAGR of 4.4% (2024-2029). Forecast value sales of fish food will reach Can$62.5 million (41.3%), bird food at Can$59.0 million (39%), and small mammal/reptile food at Can$29.9 million (19.7%) in 2029.
| Category | 2019 | 2020 | 2021 | 2022 | 2023 | 2024 |
|---|---|---|---|---|---|---|
| Total - other pet food | 82.8 | 89.4 | 93.6 | 104.4 | 114.0 | 122.0 |
| Bird food | 30.9 | 33.4 | 35.0 | 38.5 | 41.5 | 44.7 |
| Fish food | 36.7 | 39.6 | 41.4 | 46.2 | 50.5 | 53.5 |
| Small mammal/reptile food | 15.2 | 16.4 | 17.2 | 19.7 | 22.0 | 23.8 |
| Source: Euromonitor International, 2024 | ||||||
| Category | Annual growth % 2024/2023 | CAGR* % 2019-2024 | Total growth % 2019-2024 |
|---|---|---|---|
| Total - other pet food | 7.0 | 8.1 | 47.3 |
| Bird food | 7.7 | 7.7 | 44.7 |
| Fish food | 5.9 | 7.8 | 45.8 |
| Small mammal/reptile food | 8.2 | 9.4 | 56.6 |
|
Source: Euromonitor International, 2024 *CAGR: Compound Annual Growth |
|||
| Category | 2024 | 2025 | 2026 | 2027 | 2028 | 2029 |
|---|---|---|---|---|---|---|
| Total - other pet food | 122.0 | 129.1 | 135.6 | 141.3 | 146.6 | 151.4 |
| Bird food | 44.7 | 47.8 | 50.8 | 53.7 | 56.5 | 59.0 |
| Fish food | 53.5 | 56.1 | 58.1 | 59.7 | 61.2 | 62.5 |
| Small mammal/reptile food | 23.8 | 25.3 | 26.7 | 27.9 | 29.0 | 29.9 |
| Source: Euromonitor International, 2024 | ||||||
| Category | Annual growth % 2025/2024 | CAGR* % 2024-2029 | Total growth % 2024-2029 |
|---|---|---|---|
| Total - other pet food | 5.8 | 4.4 | 24.1 |
| Bird food | 6.9 | 5.7 | 32.0 |
| Fish food | 4.9 | 3.2 | 16.8 |
| Small mammal/reptile food | 6.3 | 4.7 | 25.6 |
|
Source: Euromonitor International, 2024 *CAGR: Compound Annual Growth |
|||
Pet products: pet healthcare, cat litter, other beauty and accessories
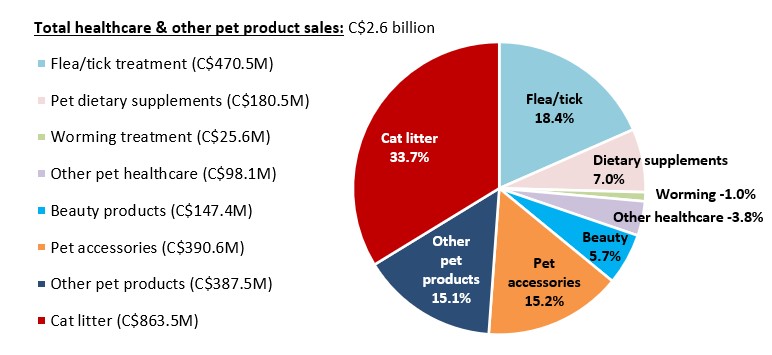
In 2024, in Canada retail sales of pet products such as pet healthcare, cat litter, and other beauty and accessories totalled Can$2.6 billion growing at a CAGR of 8.6% (2019-2024). Value sales of healthcare products (Can$774.5 million) consisted of flea/tick treatment at Can$470.5 million (18.4%) of total sales, pet dietary supplements at Can$180.5 million (7.0%), worming treatment at Can$25.6 million (1.0%), and other pet healthcare sales of Can$98.1 million (3.8%) in 2024. Other tracked pet products in the total sales value included cat litter at a sales value of Can$863.5 million (33.7%), pet accessories at Can$390.6 million (15.2%), beauty products at Can$147.4 million (5.7%), and other pet products at Can$387.5 million (15.1%) over the year.
In 2029, total retail sales in the aforementioned pet products in Canada are forecast to reach Can$3.5 billion growing at a CAGR of 6.4% (2024-2029). Forecast value sales over this period for pet healthcare products, will grow the most by a CAGR of 9.6%, followed by beauty products and accessories (+5.8%), and cat litter (+3.9%).
Description of above image
- Flea/tick treatment (Can$470.5 million): 18.4%
- Pet dietary supplements (Can$180.5 million): 7.0%
- Worming treatment (Can$25.6 million): 1.0%
- Other pet healthcare (Can$98.1 million): 3.8%
- Beauty products (Can$147.4 million): 5.7%
- Pet accessories (Can$390.6 million): 15.2%
- Other pet products (Can$387.5 million): 15.1%
- Cat litter (Can$863.5 million): 33.7%
Total healthcare and other pet product sales: Can$2.6 billion
Source: Euromonitor International, 2024
| Category | 2019 | 2020 | 2021 | 2022 | 2023 | 2024 |
|---|---|---|---|---|---|---|
| Total - pet products | 1,694.5 | 1,963.8 | 2,117.3 | 2,324.1 | 2,439.5 | 2,563.6 |
| Cat litter | 595.1 | 701.1 | 766.5 | 810.9 | 835.1 | 863.5 |
| Pet healthcare | 462.6 | 528.3 | 573.8 | 669.0 | 717.8 | 774.5 |
| Other - beauty and accessories | 636.8 | 734.4 | 777.1 | 844.2 | 886.5 | 925.5 |
| Source: Euromonitor International, 2024 | ||||||
| Category | Annual growth % 2024/2023 | CAGR* % 2019-2024 | Total growth % 2019-2024 |
|---|---|---|---|
| Total - pet products | 5.1 | 8.6 | 51.3 |
| Cat litter | 3.4 | 7.7 | 45.1 |
| Pet healthcare | 7.9 | 10.9 | 67.4 |
| Other - beauty and accessories | 4.4 | 7.8 | 45.3 |
|
Source: Euromonitor International, 2024 *CAGR: Compound Annual Growth |
|||
| Category | 2024 | 2025 | 2026 | 2027 | 2028 | 2029 |
|---|---|---|---|---|---|---|
| Total - pet products | 2,563.6 | 2,706.9 | 2,873.6 | 3,062.1 | 3,271.1 | 3,500.8 |
| Cat litter | 863.5 | 895.4 | 929.6 | 968.6 | 1,008.4 | 1,047.7 |
| Pet healthcare | 774.5 | 839.6 | 918.7 | 1,009.6 | 1,111.6 | 1,226.1 |
| Other - beauty and accessories | 925.5 | 971.8 | 1,025.4 | 1,083.8 | 1,151.1 | 1,227.0 |
| Source: Euromonitor International, 2024 | ||||||
| Category | Annual growth % 2025/2024 | CAGR* % 2024-2029 | Total growth % 2024-2029 |
|---|---|---|---|
| Total - pet products | 5.6 | 6.4 | 36.6 |
| Cat litter | 3.7 | 3.9 | 21.3 |
| Pet healthcare | 8.4 | 9.6 | 58.3 |
| Other - beauty and accessories | 5.0 | 5.8 | 32.6 |
|
Source: Euromonitor International, 2024 *CAGR: Compound Annual Growth |
|||
Competitive landscape in the Canadian pet food sector
In 2023, leading companies (top brands) in the pet food sector in Canada included both dog / cat food company Mars Inc. (Pedigree, Acana, Iams) at a total of Can$1.5 billion (value share: 24.7%); followed by Nestlé SA with a 16.7% share - dog / cat food company at Can$1.0 billion (Friskies, Dog Chow, ONE), and The JM Smucker Company - dog food and treats/mixers with a share of 5.2% at sales of Can$321.7 million (Milk-Bone, Pup-Peroni, Snausages).
Over the last year, leading dog food companies (top brand) specifically in the dog food sector in the Canadian market included Mars Inc. (Pedigree) at a total of Can$999.5 million or 24.3% value share in its category, Nestlé SA (Dog Chow) at Can$566.3 million (13.8%), and the JM Smucker Company (Milk-Bone) at Can$302.3 million (7.3%). Private labels in the dog food sector held a 5.1% market share at a value of Can$208.4 million in 2023. Top companies (top brand) for sales of dog treat and mixers included the JM Smucker Company (Milk-Bone) at Can$302.3 million (37.7%) in its category, followed by Mars Inc. (Pedigree) at Can$173.0 million (21.6%), and Petcurean Pet Foods Ltd. (Go!) at Can$54.5 million (8.8%) in 2023. Private labels in the dog treat and mixers category over the year, held a 7.1% market share at a value of Can$57 million.
In 2023, leading cat food companies (top brand) specifically in the cat food sector in the Canadian market included Mars Inc. (Whiskas) at a total of Can$536.3 million or 26.9% value share in its category, Nestlé SA (Friskies) at Can$473.7 million (23.7%), and the Colgate-Palmolive Company (Hill's Science Diet) at Can$119.6 million (6.0%). Private labels in the cat food sector held a 7.9% market share at a value of Can$157.9 million in 2023. Top companies (top brands) for sales of cat treat and mixers included Mars Inc. (Royal Canin, Tempatations, Orijen) at Can$105.9 million (45.9%) and Nestlé SA (Friskies, Inaba Churu) at Can$4.4 million (1.9%) in its category in 2023. Private labels in the cat treat and mixers category over the year, held a 1.8% market share at a value of Can$4.1 million - with several unreported other companies of cat treat and mixers holding a 50.5% share at Can$116.6 million.
Reporting fish food companies (brand) in Canada included Spectrum Brands Holdings Inc. (Tetra) at total sales of Can$25.2 million a 50% value share in its category, Rolf C Hagen Inc. (Nutrafin) at Can$8.9 million (17.7%), and Unicharm Corporation (Wardley) at Can$4.2 million (8.3%) in 2023. Private labels in the fish food category over the year, held a 5.8% market share at a value of Can$2.9 million.
Bird food companies (brands) in Canada included Unicharm Corporation (Hartz) at a total of Can$9.9 million or 23.8% value share in its category, Rolf C Hagen Inc. (Living World) at Can$7.3 million (17.5%), Vitafraft Pet Care GmbH and Co KG (Vitakraft, Sun Seed) at Can$6.3 million (15.2%), and Central Garden and Pet Company (KayTee) at Can$6.3 million (15.1%) in 2023. Private labels in the bird food category over the year, held a 21.8% market share at a value of Can$9.0 million.
Small mammal/reptile food companies (brands) in Canada included Rolf C Hagen Inc. (Living World, Exo Terra) at a total of Can$7.9 million or 36% value share in its category, the Central Garden and Pet Company (KayTee) at Can$3.2 million (14.4%), Unicharm Corporation (Hartz) at Can$2.6 million (11.8%), Vitafraft Pet Care GmbH and Co KG (Vitakraft) at Can$1.3 million (5.7%), and Spectrum Brands Holdings Inc. (Tetra, 8in1) at Can$1.2 million (5.5%) in 2023. Private labels in the small mammal/reptile food category over the year, held a 10.2% market share at a value of Can$2.2 million.
In 2023, leading pet product companies (brand) in the sector in Canada included Unicharm Corporation (Hartz) at a total of Can$586.6 million (value share: 24%); followed by Nestlé SA with a 8.4% share at Can$205.8 million (Tidy Cats), and Rolf C Hagen Inc. with a share of 5.9% of sales at Can$143.5 million (Living World). Private labels in the pet products category over the year, held a 12.1% market share at a value of Can$294.8 million.
Reported, more specifically known for cat litter companies (brand) in Canada, included Nestlé SA (Tidy Cats) at a total of Can$205.8 million or 24.6% value share in its category, Oil-Dri Corporation of America (Saular) at Can$130.8 million (15.7%), Church & Dwight Company Inc. (Arm and Hammer) at Can$105.0 million (12.6%), and The Clorox Company (Scoop Away) at Can$51.8 million (6.2%) in 2023. Private labels in the cat litter category over the year, held a 34.7% market share at a value of Can$286.0 million.
Pet healthcare companies (brand) reported in Canada included Unicharm Corporation (Hartz) at a total of Can$193.9 million or 27% value share in its category, Spectrum Brands Holdings Inc. (8in1) at Can$28.4 million (4%), and Mars Inc. (Pedigree) at Can$5.5 million (0.8%) in 2023. Private labels in the pet healthcare category over the year, held a 1.2% market share at a value of Can$8.8 million.
Other beauty pet products and pet accessories companies (brand) in Canada included Unicharm Corporation (Hartz) at a total of Can$392.7 million or 44.3% value share in its category, Rolf C Hagen Inc. (Living World) at Can$143.5 million (16.2%), and Wahl Clipper Corporation (Wahl) at Can$116.1 million (13.1%) in 2023. Other companies in the beauty pet products and pet accessories category over the year, held a 26.4% market share at a value of Can$234.1 million.
| Category | Company | Top brand(s) | Retail sales (Can$M) | Market share % in 2023 |
|---|---|---|---|---|
| Dog food | Mars Inc. | Pedigree, Acana, Iams, Orijen, Royal Canin | 999.5 | 24.3 |
| Nestlé SA | Dog Chow, ONE, Beneful, Alpo, Pro Plan | 566.3 | 13.8 | |
| The JM Smucker Company | Milk-Bone, Pup-Peroni, Snausages | 302.3 | 7.3 | |
| Private label | Private label | 208.4 | 5.1 | |
| Others | Others | 1,416.1 | 34.4 | |
| Total - market share (dog food) | 4,116.9 | 100.0 | ||
| Dog treats and mixers | The JM Smucker Company | Milk-Bone, Pup-Peroni, Jerky Treats | 302.3 | 37.7 |
| Mars Inc. | Pedigree, Orijen, Acana | 173.0 | 21.6 | |
| Petcurean Pet Foods Ltd. | Go! | 70.4 | 8.8 | |
| Private label | Private label | 57.0 | 7.1 | |
| Others | Others | 144.3 | 18.0 | |
| Total - market share (dog treats and mixers) | 801.3 | 100.0 | ||
| Cat food | Mars Inc. | Whiskas, Iams, Royal Canin, Nutro, Acana | 536.3 | 26.9 |
| Nestlé SA | Friskies, Cat Chow, Fancy Feast, ONE | 473.7 | 23.7 | |
| Colgate-Palmolive Company | Hill's Science Diet | 119.6 | 6.0 | |
| Private label | Private label | 157.9 | 7.9 | |
| Others | Others | 506.7 | 25.4 | |
| Total - market share (cat food) | 1,994.9 | 100.0 | ||
| Cat treats and mixers | Mars Inc. | Royal Canin, Temptations, Orijen | 105.9 | 45.9 |
| Nestlé SA | Friskies, Inaba Churu | 4.4 | 1.9 | |
| Private label | Private label | 4.1 | 1.8 | |
| Others | Others | 116.6 | 50.5 | |
| Total - market share (cat treats and mixers) | 231.0 | 100.0 | ||
| Bird food | Unicharm Corp | Hartz | 9.9 | 23.8 |
| Rolf C Hagen Inc | Living World | 7.3 | 17.5 | |
| Vitakraft Pet Care GmbH and Co KG | Vitafraft, Sun Seed | 6.3 | 15.2 | |
| Private label | Private label | 9.0 | 21.8 | |
| Others | Others | 2.8 | 6.6 | |
| Total - market share (bird food) | 41.5 | 100.0 | ||
| Fish food | Spectrum Brands Holdings Inc. | Tetra | 25.2 | 50.0 |
| Rolf C Hagen Inc | Nutrafin | 8.9 | 17.7 | |
| Unicharm Corp | Wardley | 4.2 | 8.3 | |
| Private label | Private label | 2.9 | 5.8 | |
| Others | Others | 9.2 | 18.3 | |
| Total - market share (fish food) | 50.5 | 100.0 | ||
| Small mammal / reptile food | Rolf C Hagen Inc | Living World, Exo Terra | 7.9 | 36.0 |
| Central Garden and Pet Co | KayTee | 3.2 | 14.4 | |
| Unicharm Corp | Hartz | 2.6 | 11.8 | |
| Private label | Private label | 2.2 | 10.2 | |
| Others | Others | 3.6 | 16.4 | |
| Total - market share (small mammal/reptile food) | 22.0 | 100.0 | ||
| Pet products | Unicharm Corp | Hartz | 586.6 | 24.0 |
| Nestlé SA | Tidy Cats | 205.8 | 8.4 | |
| Rolf C Hagen Inc | Living World | 143.5 | 5.9 | |
| Oil-Dri Corp of America | Saular | 130.8 | 5.4 | |
| Wahl Clipper Corp | Wahl | 116.1 | 4.8 | |
| Private label | Private label | 294.8 | 12.1 | |
| Others | Others | 771.1 | 31.6 | |
| Total - market share (pet products) | 2,439.5 | 100.0 | ||
|
Source: Euromonitor, 2024 *CAGR: Compound Annual Growth Rate |
||||
Retail distribution channels of pet food (off-trade)
In Canada, distribution of pet food products within store-based retailer outlets had the largest sales with grocery retailers having registered a value of Can$5.8 billion in 2024 (share: down 2.4 percentage points) and non-grocery specialists at Can$1.8 billion (share: down 1.1 percentage points) since 2019. Non-grocery pet shops and superstores held the highest market share of 26.2%, followed by grocery retailer outlets such as supermarkets (24.8%), hypermarkets (23.2%), and small local grocers (5.4%) in 2024.
The distribution landscape of pet food is evolving, with the rise of e-commerce and the response from brick-and-mortar pet specialists. The COVID-19 pandemic helped to accelerate the shift towards online pet food purchases in Canada with E-commerce giants like Chewy Canada and Amazon.ca seeing a surge in sales by offering convenience and competitive prices to pet owners.Footnote 2 Grocery-based warehouse clubs at sales of Can$134.9 million (CAGR: 24.1%) and non-store e-commerce retail at Can$793.8 million (CAGR: 18.5%) showed the highest growth between 2019 and 2024. Non-retail veterinary clinics are also showing signs of moderate growth (+8.6%) as a popular distribution channel for pet food products, which had increased sales from Can$72.5 million in 2019 to Can$109.7 million in 2024.
| Outlet type | 2019 | 2024 | CAGR* % 2019-2024 | ||
|---|---|---|---|---|---|
| Actual | Share | Actual | Share | ||
| Total - retail channels | 4,188.7 | 100.0 | 6,724.2 | 100.0 | 9.9 |
| Store-based retail - offline | 3,775.8 | 90.1 | 5,820.7 | 86.6 | 9.0 |
| Grocery retailers | 2,593.6 | 61.9 | 4,000.8 | 59.5 | 9.1 |
| Convenience retail stores | 50.3 | 1.2 | 61.4 | 0.9 | 4.1 |
| Discounters | 155.4 | 3.7 | 217.8 | 3.2 | 7.0 |
| Hypermarkets | 982.4 | 23.5 | 1,560.0 | 23.2 | 9.7 |
| Supermarkets | 1,068.5 | 25.5 | 1,666.3 | 24.8 | 9.3 |
| Warehouse clubs | 45.9 | 1.1 | 134.9 | 2.0 | 24.1 |
| Small local grocers | 291.1 | 7.0 | 360.4 | 5.4 | 4.4 |
| Non-grocery specialists | 1,182.2 | 28.2 | 1,819.9 | 27.1 | 9.0 |
| General merchandise stores | 3.7 | 0.1 | 4.9 | 0.1 | 5.8 |
| Home improvement and gardening stores | 23.3 | 0.6 | 30.3 | 0.4 | 5.4 |
| Pet shops and superstores | 1,136.7 | 27.1 | 1,759.8 | 26.2 | 9.1 |
| Health and beauty specialists | 18.5 | 0.4 | 24.9 | 0.4 | 6.1 |
| Non-store retail - E-Commerce | 340.3 | 8.1 | 793.8 | 11.8 | 18.5 |
| Non-retail channels - veterinary clinics | 72.5 | 1.7 | 109.7 | 1.6 | 8.6 |
|
Source: Euromonitor International, 2023 *CAGR: Compound Annual Growth Rate |
|||||
Product launch and trends analysis: dog and cat food
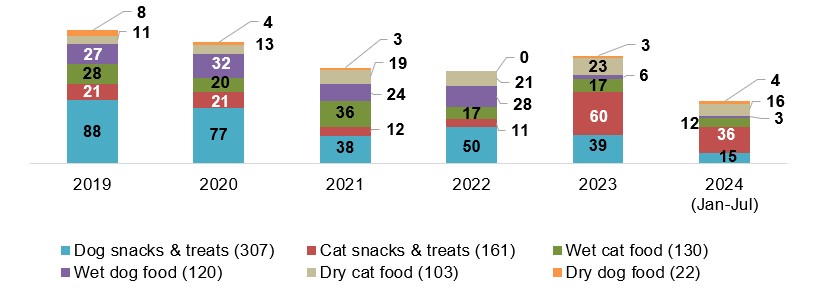
Mintel's Global New Products Database (GNPD) indicates that there were 843 new cat and dog food or treat products launched (including new variety/range extension, packaging, formulation or relaunched) in Canada between January 2019 and July 10, 2024.
Dog food/snacks and treats totalled 449 new products launched, while cat food/snacks and treats totalled the remaining 394 of new products launched between January 2019 and July 10, 2024. More specifically, dog snacks and treats (307) were the largest dog / cat food/treat category to launch new products at a market share of 36.4%, followed by 19.1% of cat snacks and treats (161), 15.4% of wet cat food (130), 14.2% of wet dog food (120), 12.2% of dry cat food (103), and 2.6% of dry dog food (22).
Description of above image
| Product | 2019 | 2020 | 2021 | 2022 | 2023 | 2024 (January-July) | Total |
|---|---|---|---|---|---|---|---|
| Dog snacks and treats | 88 | 77 | 38 | 50 | 39 | 15 | 307 |
| Cat snacks and treats | 21 | 21 | 12 | 11 | 60 | 36 | 161 |
| Wet cat food | 28 | 20 | 36 | 17 | 17 | 12 | 130 |
| Wet dog food | 27 | 32 | 24 | 28 | 6 | 3 | 120 |
| Dry cat food | 11 | 13 | 19 | 21 | 23 | 16 | 103 |
| Dry dog food | 8 | 4 | 3 | 0 | 3 | 4 | 22 |
Source: Mintel, 2024
Dog food, snacks and treats
Leading parent companies launching dog food products (including snacks and treats) in Canada between 2019 and 2024 (Jan.-Jul.) were Mars (55), Nestlé Purina PetCare (47), Rolf C. Hagen (23), The Crump Group (19), Smucker Foods (14), and Big Heart Pet Brands (13). More recently between Q3-2023 and Q3-2024, top companies launching a total of 39 new products were Nestlé (8), Mars Inc. (5), Hartz Mountain (3), The Crump Group (3), J.M. Smucker (3), and Canadian Jerky (2).
Leading dog food brands (Jan. 2017-Jul. 2024) in Canada included Caledon Farms (21), Cesar (15), Faim Museau (8), Dogit (8), CookiePal (8), and Milk-Bone (7). New brands appearing for the first time in the last six months into the Canadian market were Pet Treatery (G'Day Mate! Premium dehydrated kangaroo for dogs and cats), Canine Creamery Frozen Goat (Billyberry frozen yogurt for dogs), Purina Prime Meaty (natural dog treats tender sticks with real beef), and Zoë Better Than Rawhide (duck and cranberry flavor large twists for dogs).
Leading locations of manufacture for new dog food products over the last 5.7 year period (2019-2024) were the United States (95), Thailand (30), China (22), Mexico (8), Ireland (4), and Germany (4). There were 131 new dog products (29.2%) locally manufactured in Canada over this period.
Popular or top growing flavours (including blends) in Canada were cranberry, chicken and carrot [Q3-2022 and Q3-2024]. Declining flavours during this period (−50%), were beef, turkey, and duck. New ingredients within the last 12 months included microalgaes, beef gelatine, blueberry puree, goats milk, strawberry puree, goat milk powder, blackberry puree, and duck flavour.
Meanwhile, top claims on these dog food products in Canada used the most during the last three months were pet - adult (44.4%), high/added protein (33.3%), probiotic (22.2%), free from added/artificial preservatives or flavourings (22.2%), functional pet - slimming (22.2%), joint/bone/muscle pet (22.2%), and functional pet - digestion (22.2%). Trending claims were pet - adult (+300%), functional pet - joints, bones and muscles (+100%); with declining claims by 100% were GMO free, on-th-go, organic, high/added fibre, and low/no/reduced calorie between Q2-2023 and Q2-2024.
| Product attributes | Yearly launch counts | ||||||
|---|---|---|---|---|---|---|---|
| 2019 | 2020 | 2021 | 2022 | 2023 | 2024 | Total | |
| Yearly product launches | 123 | 113 | 65 | 78 | 48 | 22 | 449 |
| Top launch types | |||||||
| New variety / range extension | 47 | 44 | 28 | 35 | 19 | 10 | 183 |
| New product | 42 | 37 | 16 | 24 | 10 | 8 | 137 |
| New packaging | 26 | 30 | 19 | 16 | 18 | 2 | 111 |
| Relaunch | 6 | 1 | 2 | 3 | 1 | 2 | 15 |
| New formulation | 2 | 1 | 0 | 0 | 0 | 0 | 3 |
| Top sub-categories | |||||||
| Dog snacks and treats | 88 | 77 | 38 | 50 | 39 | 15 | 307 |
| Dog food wet | 27 | 32 | 24 | 28 | 6 | 3 | 120 |
| Dog food dry | 8 | 4 | 3 | 0 | 3 | 4 | 22 |
| Top six companies | |||||||
| Mars | 18 | 18 | 7 | 4 | 7 | 1 | 55 |
| Nestlé Purina PetCare | 11 | 14 | 6 | 8 | 2 | 6 | 47 |
| Rolf C. Hagen | 2 | 15 | 3 | 1 | 1 | 1 | 23 |
| Crump Group | 11 | 4 | 1 | 3 | 0 | 0 | 19 |
| Smucker Foods | 0 | 5 | 3 | 1 | 5 | 0 | 14 |
| Big Heart Pet Brands | 7 | 3 | 1 | 1 | 1 | 0 | 13 |
| Top six brands | |||||||
| Caledon Farms | 8 | 4 | 0 | 6 | 3 | 0 | 21 |
| Cesar | 10 | 4 | 0 | 1 | 0 | 0 | 15 |
| Faim Museau | 0 | 1 | 1 | 6 | 0 | 0 | 8 |
| Dogit | 0 | 8 | 0 | 0 | 0 | 0 | 8 |
| CookiePal | 0 | 3 | 0 | 2 | 2 | 1 | 8 |
| Milk-Bone | 1 | 1 | 3 | 0 | 2 | 0 | 7 |
| Import status (if reported) | |||||||
| Imported | 44 | 51 | 25 | 26 | 10 | 16 | 172 |
| Not imported | 33 | 28 | 14 | 30 | 22 | 4 | 131 |
| Top six claims | |||||||
| Free from additives / preservatives / artificial | 184 | 88 | 73 | 97 | 49 | 24 | 515 |
| Low / no / reduced allergen | 45 | 27 | 23 | 35 | 21 | 8 | 159 |
| Pet - adult | 32 | 35 | 20 | 16 | 7 | 7 | 117 |
| All natural product | 33 | 25 | 13 | 21 | 9 | 4 | 105 |
| Functional pet - teeth and tartar prevention | 25 | 31 | 13 | 12 | 4 | 6 | 91 |
| Vitamin / mineral fortified | 22 | 22 | 9 | 9 | 9 | 3 | 74 |
| Top six flavours (including blend) | |||||||
| Beef | 14 | 22 | 9 | 7 | 7 | 4 | 63 |
| Chicken | 16 | 8 | 10 | 9 | 4 | 2 | 49 |
| Unflavoured / plain | 17 | 17 | 4 | 4 | 5 | 0 | 47 |
| Bacon / lardon /Pancetta / speck | 3 | 6 | 1 | 4 | 2 | 0 | 16 |
| Turkey | 3 | 4 | 1 | 4 | 1 | 0 | 13 |
| Pork | 1 | 4 | 0 | 4 | 1 | 0 | 10 |
| Price group in US dollars | |||||||
| 0.58 - 5.57 | 43 | 62 | 36 | 27 | 10 | 8 | 186 |
| 5.58 - 10.57 | 45 | 29 | 15 | 19 | 26 | 6 | 140 |
| 10.58 - 15.57 | 22 | 11 | 6 | 14 | 8 | 4 | 65 |
| 15.58 - 20.57 | 3 | 10 | 5 | 7 | 3 | 2 | 30 |
| 20.58 - 29.00 | 4 | 1 | 3 | 11 | 1 | 2 | 22 |
| Source: Mintel; Global New Product Database, 2024 | |||||||
Cat food, snacks and treats
Leading parent companies launching cat food products (including snacks and treats) in Canada between 2019 and 2024 (Jan.-Jul.) were Nestlé Purina PetCare (92), Mars (67), Rolf C. Hagen (27), Blue Buffalo (22), Pure Treats (19), and Hartz Mountain (10). More recently between Q3-2023 and Q3-2024, top companies launching a total of 39 new products were Mars (38), Rolf C. Hagen (13), Nestlé (10), Pure Treats (9), Bio Biscuit (4), and Inaba Foods (4).
Leading cat food brands (January 2017 to July 2024) in Canada included Purina - Friskies and Beyond Grain Free (22), Whiskas - Perfect Portions and Temptations (14), Catit - Creamy/Nibbly (12), Iams Proactive Health (8), Caledon Farms (7), and Crave (7). New brands appearing for the first time in the last six months into the Canadian market were Feline Greenies Smartbites (chicken flavored healthy indoor treats for cats), Nutro Wholesome Essentials (chicken and brown rice recipe nautral cat food for indoor adult cats), Temptations Lickable Spoons (tasty chicken and savoury salmon treats for cats), and PureBites Broths (pure wild tuna topper/treat for cats in a nutritious broth).
Locations of manufacture (as reported) for new cat food products over the last 5.7 year period (2019-2024) were the United States (116), Thailand (84), Austria (5), and New Zealand (4). There were 50 new cat products (12.7%) locally manufactured in Canada over this period. More recently between Q3-2023 and Q3-2024, the cat snacks and treats category has grown the most in the number of new launched products (+118.2%), followed by dry cat food (+66.7%), while new launches for wet cat food have declined by −62.5%.
Popular or the fastest growing flavours in Canada were chicken, tuna, gravy by +100% and salmon by +16.7% [Q3-2022 and Q3-2024]. New ingredients within the last 12 months included maize protein, proteins, hemp seed extract and hemp oil, ferrous Fumarate, microalgaes, shrimp powder, DHA (Docosahexaeonoic Acid) from algae oil, green lipped mussel extract, and hemp seed.
Meanwhile, top claims in Canada on these cat food products used the most during the last three months were pet - adult (40.5%), low/no/reduced allergen (35.1%), no/free from added/artificial preservatives or flavourings (35.1%), functional pet - digestion (21.6%), vitamins/minerals plus (18.9%), low/no/reduced calorie (18.9%), and immune system support (16.2%). Trending claims were ease of use (+500%), GMO free (+300%), functional pet- immune system (+250%), low/no/reduced calorie (+250%), and pet - adult (+200%); with declining claims being free from added/artificial additives (−100%), organic (−100%), ethical - environmentally friendly product (−75%), ethical - sustainable habitat/resources (−75%), and wholegrain (−66.7%) between Q2-2023 and Q2-2024.
| Product attributes | Yearly launch counts | ||||||
|---|---|---|---|---|---|---|---|
| 2019 | 2020 | 2021 | 2022 | 2023 | 2024 | Total | |
| Yearly product launches | 60 | 54 | 67 | 49 | 100 | 64 | 394 |
| Top launch types | |||||||
| New product | 35 | 8 | 28 | 21 | 39 | 20 | 151 |
| New variety / range extension | 17 | 23 | 28 | 22 | 35 | 23 | 148 |
| New packaging | 6 | 19 | 11 | 4 | 25 | 18 | 83 |
| Relaunch | 2 | 4 | 0 | 1 | 1 | 3 | 11 |
| New formulation | 0 | 0 | 0 | 1 | 0 | 0 | 1 |
| Top sub-categories | |||||||
| Cat snacks and treats | 21 | 21 | 12 | 11 | 60 | 36 | 161 |
| Cat food wet | 28 | 20 | 36 | 17 | 17 | 12 | 130 |
| Cat food dry | 11 | 13 | 19 | 21 | 23 | 16 | 103 |
| Top six companies | |||||||
| Nestlé Purina PetCare | 16 | 25 | 24 | 10 | 12 | 5 | 92 |
| Mars | 7 | 5 | 7 | 5 | 25 | 18 | 67 |
| Rolf C. Hagen | 5 | 0 | 4 | 1 | 12 | 5 | 27 |
| Blue Buffalo | 1 | 1 | 8 | 7 | 5 | 0 | 22 |
| Pure Treats | 5 | 1 | 0 | 2 | 5 | 6 | 19 |
| Hartz Mountain | 0 | 5 | 1 | 2 | 1 | 1 | 10 |
| Top six brands | |||||||
| Purina - Friskies / Beyond Grain Free | 5 | 10 | 6 | 1 | 0 | 0 | 22 |
| Whiskas - Perfect Portions / Temptations | 2 | 2 | 1 | 1 | 6 | 2 | 14 |
| Catit - Creamy / Nibbly | 3 | 0 | 0 | 1 | 6 | 2 | 12 |
| Iams Proactive Health | 0 | 1 | 1 | 1 | 5 | 0 | 8 |
| Caledon Farms | 2 | 2 | 0 | 0 | 1 | 2 | 7 |
| Crave | 5 | 0 | 0 | 1 | 1 | 0 | 7 |
| Import status (if reported) | |||||||
| Imported | 31 | 32 | 32 | 28 | 50 | 33 | 206 |
| Not imported | 12 | 3 | 7 | 4 | 12 | 12 | 50 |
| Top six claims | |||||||
| Free from additives/preservatives/artificial | 25 | 50 | 71 | 53 | 91 | 44 | 334 |
| Pet - adult | 20 | 40 | 24 | 26 | 28 | 23 | 161 |
| Low / no / reduced allergen | 23 | 14 | 23 | 18 | 47 | 22 | 147 |
| Vitamin / mineral fortified | 15 | 20 | 24 | 26 | 28 | 13 | 126 |
| Functional pet - digestion | 11 | 8 | 14 | 13 | 16 | 13 | 75 |
| High / added protein | 11 | 6 | 11 | 10 | 19 | 9 | 66 |
| Top six flavours (including blend) | |||||||
| Chicken | 10 | 9 | 10 | 10 | 17 | 21 | 77 |
| Chicken combo (salmon, tuna, turkey, liver) | 6 | 10 | 4 | 5 | 10 | 5 | 40 |
| Salmon | 4 | 9 | 2 | 4 | 12 | 7 | 38 |
| Tuna combo (fish - white) | 6 | 7 | 2 | 5 | 10 | 3 | 33 |
| Turkey | 1 | 2 | 3 | 2 | 2 | 1 | 11 |
| Unflavoured/plain | 3 | 0 | 2 | 1 | 1 | 2 | 9 |
| Price group in US dollars | |||||||
| 0.34 - 4.33 | 40 | 33 | 41 | 22 | 56 | 30 | 222 |
| 4.34 - 8.33 | 7 | 9 | 4 | 4 | 17 | 17 | 58 |
| 12.34 - 16.33 | 6 | 4 | 5 | 4 | 7 | 7 | 33 |
| 8.34 - 12.33 | 3 | 5 | 4 | 5 | 6 | 5 | 28 |
| 16.34 - 25.00 | 0 | 1 | 4 | 7 | 9 | 0 | 21 |
| Source: Mintel; Global New Product Database, 2024 | |||||||
Product examples
Healthy Adult Food for Dogs
Source: Mintel, 2024
| Company / distributor | Rolf C. Hagen |
|---|---|
| Brand | Nutrience Infusion |
| Sub-category | Pet food, dog dry food |
| Market | Manufactured in Canada, not imported |
| Related claims | Low / no / reduced glycemic, wholegrain, high/added protein, functional pet – joints, bones and muscles, skin and coat, slimming, digestion, pro / prebiotic, pet – adult |
| Store name / type | Petsmart, specialist retailer |
| Store location | Edmonton, T6T 0B4 |
| Launch type | New product |
| Date published | April 2024 |
| Price in Canadian dollars | 21.99 |
This cat treat retails in a 2.27 kilograms pack. Made in Canada. Nourish the body, fuel the spirit. With Canadian Prairie beef, delivered fresh. Freeze dried infused kibble for superior flavour: Omega-3 0.3%, omega-6 2.7%, glucosamine 400 milligrams per kilogram, chondroitin 200 milligrams per kilogram. A Canadian made food, combining fresh never frozen beef, low-glycemic whole grains, vegetables, fruits and nutrient-rich botanicals. This protein-rich kibble is infused with freeze-dried beef liver. From domestic and imported ingredients. Featuring: salmon oil and coconut oil to help maintain a healthy skin and coat. Low-glycemic steel-cut oats and barley to help maintain a healthy body weight. nutrient-rich vegetables, fruits and botanicals; prebiotics and probiotics to support an healthy digestive system. glucosamine and chondroitin to support hip and joint health.
Dog Food in Gravy with Real Salmon
Source: Mintel, 2024
| Company | Nestlé Purina PetCare |
|---|---|
| Brand | Purina Beneful IncrediBites |
| Sub-category | Pet food, dog wet food |
| Country | Canada, manufactured in the United States |
| Related claims | Ethical – environmentally friendly package, pet – adult, ethical – recycling |
| Store name / type | Pharmaprix, drug store / pharmacy |
| Store location | Montreal, H2W 1Y1 |
| Launch type | New product |
| Date published | July 2024 |
| Price in Canadian dollars | 1.79 |
This wet cat food retails in an 85 gram pack. Just for small dogs: With tomatoes, carrots and wild rice. Recyclable pack. Formulated to meet the nutritional levels established by the AAFCO dog food nutrient profiles for the maintenance of adult dogs.
Billyberry Frozen Yogurt for Dogs

Source: Mintel, 2024
| Company | Big Country Raw |
|---|---|
| Brand | Canine Creamery Frozen Goat |
| Sub-category | Pet food, dog snacks and treats |
| Market | Canada |
| Related claims | All natural product, low / no / reduced sodium, sugar free, functional pet – digestion, probiotic |
| Store name / type | Fortinos, supermarket |
| Store location | Brampton, L6V 4K2 |
| Launch type | New product |
| Date published | May 2024 |
| Price in Canadian dollars | 8.49 |
This dog snack/treat retails in a 300 millilitre pack containing three 100 millilitre units. Contains strawberry, blueberry and blackberry puree. Proudly Canadian. No salt or sugar. Made with goat milk yogurt, fruit puree and agar for a thick and creamy treat that is 100% natural. Cold fermented and naturally full of probiotics that are great for little furry friend's gut. Serving suggestions. Supplemental feeding choice intended as an occasional treat. Looks good to eat, but is not intended for human consumption.
Natural Dog Treats Tender Sticks with Real Beef

Source: Mintel, 2024
| Company | Nestlé Purina PetCare |
|---|---|
| Brand | Purina Prime Meaty |
| Sub-category | Pet food, dog snacks and treats |
| Country | Canada, manufactured in the United States |
| Related claims | No additives / preservatives / artificial flavourings, low / no / reduced allergen |
| Store name / type | Fortinos, supermarket |
| Store location | Brampton, L6V 4K2 |
| Launch type | New product |
| Date published | May 2024 |
| Price in Canadian dollars | 5.79 |
These dog treats retails in a 113 gram pack. Made with bone broth with naturally occurring collagen, and real meat as a primary ingredient. Limited ingredients. Made to help satisfy the dog's love of real meat. With flavour dogs crave, and a tender, meaty texture they love to tear into. Feeding instructions. No artificial flavours, preservatives, corn, wheat and soy. Logos and certifications: Facebook
Indoor Cat Highest Protein Adult Cat Food with Free-Run Chicken, Salmon and Trout

Source: Mintel, 2024
| Company | Champion Petfoods |
|---|---|
| Brand | Acana |
| Sub-category | Pet food, cat dry food |
| Market | Manufactured in Canada, not imported |
| Related claims | Premium, ethical – animal, high / added protein, functional pet – eyesight, slimming, digestion, pet – adult, probiotic |
| Store name / type | Pet Valu, specialist retailer |
| Store location | Scarborough, M1T 3H1 |
| Launch type | New variety / range extension |
| Date published | March 2024 |
| Price in Canadian dollars | 34.99 |
This dry cat food retails in a 1.8 kilogram pack. Premium food with 75% animal ingredient. Proudly crafted in Canada. To help support: Weight management - balanced calories from protein and fat help support a healthy body weight; Hairball Control - helps control hairballs with fibre from miscanthus grass and pea fibres; Digestive health - probiotic blend and fibre to help support healthy digestion. Fresh or raw animal ingredients provide a burst of flavour cats crave. Fresh chicken, raw salmon and raw trout. Go Beyond the 1st ingredient: rich with animal ingredients like free-run chicken, salmon and trout, ACANA Indoor cat recipe. Fresh: fresh ingredients are refrigerated. Raw: raw ingredients are delivered frozen. Complete and balanced recipes are crafted with ingredients to match each pet's natural nutritional needs. The product features fresh or raw protein-rich meat, poultry, or whole fish, balanced with whole fruit and vegetables. Care at every step: The mission is to earn pet lovers' trust every day so pets thrive for a lifetime. That's why the healthy ingredients are delivered daily by suppliers the producer trusts and strives to lead the way when it comes to safety and quality standards. Producers are proud to help pets in need all around the world by donating millions of meals each year. Vets and pet nutrition experts carefully craft each recipe with the right ingredients to help support long-term health. Formulated to meet the nutritional levels established by FEDIAF for Adult Maintenance. Feeding Instructions.
Chicken Flavour Pill Covers
Source: Mintel, 2024
| Company | Vetdiet |
|---|---|
| Brand | Vetdiet |
| Sub-category | Pet food, cat snacks and treats |
| Country | Manufactured in Canada, not imported |
| Related claims | No additives / preservatives / artificial colourings, flavourings, low / no / reduced calorie / allergen, gluten free, ease of use |
| Store name / type | Mondou, specialist retailer |
| Store location | Montreal-Sherbrooke East, H1N 3P6 |
| Launch type | New product |
| Date published | February 2024 |
| Price in Canadian dollars | 9.99 |
This cat pill cover retails in a 75 gram pack containing 15 units. Natural cat treats. Free from wheat, corn, soy, artificial preservatives, flavours and colours. For care - Ideal for giving medication. Backed by science and developed by experts. Makes giving medication to cat easy and enjoyable. Helps treat cat responsibly by avoiding high-calorie human food for giving medication. Packaged to preserve moist texture and freshness. Natural. Feeding directions and recommendation. Logos and certifications: Made in Canada
Chicken Flavored Healthy Indoor Treats for Cats
Source: Mintel, 2024
| Company | Mar |
|---|---|
| Brand | Feline Greenies Smartbites |
| Sub-category | Pet food, cat snacks and treats |
| Market | Canada |
| Related claims | No additives / preservatives / artificial flavourings, low / no / reduced calorie, vitamin / mineral fortified, functional pet – joints, bones and muscles; slimming; digestion, pet – adult |
| Store name / type | Real Canadian Superstore, supermarket |
| Store location | Scarborough, M1P 0A3 |
| Launch type | New variety / range extension |
| Date published | June 2024 |
This cat snack/treat retails in a 60 gram pack. Made with natural ingredients. Plus vitamins, minerals and other nutrients. No artificial flavours, artificial preservatives or fillers. Less than two calories per treat. Nutritionally complete and balanced for adult cats. Trace amounts may be present due to potential cross-contact during manufacturing. Treats with a higher purpose. With greenies fiberblend formula to help support healthy digestion, high-quality protein to support muscles and less than two calories per treat to help maintain a healthy weight. Feeding guidelines are provided.
Heart & Eye Daily Healthy Support Topper in Water for Cats
Source: Mintel, 2024
| Company | Pure Treats |
|---|---|
| Brand | PureBites+ |
| Sub-category | Pet food, cat snacks and treats |
| Country | Canada, manufactured in Thailand |
| Related claims | Functional pet – eyesight, heart and cardiovascular system |
| Store name / type | Mondou, specialist retailer |
| Store location | Montréal-Sherbrooke, H1N 3P6 |
| Launch type | New variety / range extension |
| Date published | June 2024 |
| Price in Canadian dollars | 2.39 |
These dog treats retails in a 71 gram pack. Pure chicken formula with carrots and taurine. Five ingredients only. Creamy squeezable texture that cats love. 100% pure and natural chicken, water, carrots, tapioca starch and taurine: 276 milligrams of taurine in every squeezable pouch, to support heart and eye health. Feeding instructions and feeding guidelines. Logos and certifications: Facebook, Twitter, Instagram. Also, available in options said to provide various daily health support to aid in skin and coat or digestion.
Canadian export requirements for pet food
The Canadian Food Inspection Agency (CFIA), is responsible for regulating the safety and quality of food, animal and plant health in Canada. The CFIA regulates and provides verification and certification for import and export of pet food and related animal products and by-products to confirm that the sanitary requirements of the importing country have been met.
Export policies: animal products and by-products, Pet Food and Treats containing Animal Products and By-Products, outlines information regarding the related policies, recent updates on current issue notifications, and regulatory oversight requirements needed to be met, along with a list of other government parties and Associations involved with the regulation of pet food, treats and chews exiting from Canada. Pet foods exported from Canada may need to have an official zoosanitary health certificate, which is issued by the CFIA.
The CFIA negotiates import conditions with the importing country's veterinary officials, verifying that the exporting products meet the importing country's market access requirements, which may be done through inspections made to the Canadian manufacturing facilities and ensuring that best practices are being followed according to these food safety regulations. For more information on forms required to complete dependent on the importing country, please visit the Pet food: animal health certificates for export - by country page.
If you are planning on exporting any pet food and treats containing animal products and by-products, you can contact by telephone the Animal Health Offices in your area to better understand the certificate requirements that applies to your export. An officer can also, advise on any disease outbreaks or other events that my cause exports to be suspended.
In addition, CFIA's official Guidance Documents (Guidance Document Repository - GDR) provide the Agency's functional direction regarding their compliance verification activities and provide guidance to regulated parties regarding program requirements. Related documents may be searched for and filtered under the 'Find Repository Documents' section on the above noted GDR webpage. As part of their GDR the CFIA has created a 'Guideline for preparing export certificates for the Canadian pet food industry' outlining roles and responsibilities of exporters and the CFIA, as well as, supporting documents and a listing of requirements from importing countries.
For more information
The Canadian Trade Commissioner Service:
International Trade Commissioners can provide Canadian industry with on-the-ground expertise regarding market potential, current conditions and local business contacts, and are an excellent point of contact for export advice.
More agri-food market intelligence:
International agri-food market intelligence
Discover global agriculture and food opportunities, the complete library of Global Analysis reports, market trends and forecasts, and information on Canada's free trade agreements.
Agri-food market intelligence service
Canadian agri-food and seafood businesses can take advantage of a customized service of reports and analysis, and join our email subscription service to have the latest reports delivered directly to their inbox.
More on Canada's agriculture and agri-food sectors:
Canada's agriculture sectors
Information on the agriculture industry by sector. Data on international markets. Initiatives to support awareness of the industry in Canada. How the department engages with the industry.
Resources
- Euromonitor | April 2024. Country report: Cat Food in Canada
- Euromonitor | April 2024. Country report: Dog Food in Canada
- Euromonitor | April 2024. Country report: Pet Care in Canada
- Euromonitor | April 2024. Country report: Pet Products in Canada
- Euromonitor International, 2024. Data statistics (2019-2029)
- Global Trade Tracker, 2024
- Mintel Global New Products Database, 2024
Sector Trend Analysis – Pet food trends in Canada
Global Analysis Report
Prepared by: Erin-Ann Chauvin, Senior Market Analyst
© His Majesty the King in Right of Canada, represented by the Minister of Agriculture and Agri-Food (2024).
Photo credits
All photographs reproduced in this publication are used by permission of the rights holders.
All images, unless otherwise noted, are copyright His Majesty the King in Right of Canada.
To join our distribution list or to suggest additional report topics or markets, please contact:
Agriculture and Agri-Food Canada, Global Analysis1341 Baseline Rd, Tower 5, 3rd floor
Ottawa ON K1A 0C5
Canada
Email: aafc.mas-sam.aac@agr.gc.ca
The Government of Canada has prepared this report based on primary and secondary sources of information. Although every effort has been made to ensure that the information is accurate, Agriculture and Agri-Food Canada (AAFC) assumes no liability for any actions taken based on the information contained herein.
Reproduction or redistribution of this document, in whole or in part, must include acknowledgement of agriculture and agri-food Canada as the owner of the copyright in the document, through a reference citing AAFC, the title of the document and the year. Where the reproduction or redistribution includes data from this document, it must also include an acknowledgement of the specific data source(s), as noted in this document.
Agriculture and Agri-Food Canada provides this document and other report services to agriculture and food industry clients free of charge.