

Note: This report includes forecasting data that is based on baseline historical data.
Executive summary
The pet population in Hong Kong increased slightly from 2018 to 2022. Cats and small dog breeds gained in popularity, whereas large dog breeds became significantly less popular.
Hong Kong dog and cat food imports totalled US$156 million in 2022, with 2.0% compound annual growth rate (CAGR) from 2017. Hong Kong is a small import market for pet food, but imported products do feature on Hong Kong pet food store shelves.
Pet food retail sales outpaced the growth in the pet population, even as pet owners switch from medium and large dogs to smaller dogs and cats. Hong Kong pet food owners favour high-quality food and treats. Pet food sales totalled US$723.6 million in 2022, and are expected to exceed US$1 billion by 2028.
The Hong Kong dog and cat food market is highly segmented. The largest company, Mars Inc., had slightly less than a 10% market share of all pet food products in 2022, and market segmentation is increasing as the share of brands outside of the top 10 increases. This segmentation is not reflected in the market for small mammal, reptile, bird or fish food, however, where two brands represent 45.4% of the total market.
Most pet food in Hong Kong is sold through brick-and-mortar retail channels, primarily pet food stores and superstores. However, E-commerce outlets are becoming increasingly popular. 20.4% of pet food in Hong Kong was sold through E-commerce in 2022, as opposed to only 8.1% in 2017.
Pet population and ownership
According to Euromonitor, there were a total of 1.19 million pets in Hong Kong in 2022, up from 1.14 million in 2018, but below the 1.24 million reported in 2021. This included 367 thousand fish, 312 thousand dogs, 278 thousand cats, 145 thousand reptiles, 74 thousand small mammals, and 15 thousand birds. Hong Kong pet owners tend to favour smaller domestic animals: of the 312 thousand dogs, 231 were small breeds (less than 9 kilograms), 66 thousand were medium breeds (9 to 23 kilograms), and 16 thousand were large dogs (over 23 kilograms).
The pet population in Hong Kong grew by 1.1% CAGR from 2018 to 2022, and is forecasted to be mostly flat through 2028, at 0.2% forecasted CAGR from 2022 to 2028. Cats increased in popularity, with 4.0% CAGR growth from 2018 to 2022. The dog population was steady, at 0.1% CAGR from 2018 to 2022. Small dogs have increased in popularity since 2018, whereas large dogs are less common than in 2018. The populations of small, medium and large dogs are all expected to decrease through 2028, with growth being most pronounced for large dogs. Dogs remain more popular than cats, but this is not expected to be the case by 2028.
While the population of small mammals (such as hamsters and rabbits) increased by only 0.7% CAGR from 2018 to 2022, these are expected to be the fasted growing pet category in Hong Kong through 2028, with 1.7% CAGR. Fish and small reptiles are also expected to increase in popularity, and the population of birds is expected to be flat.
| Category | 2018 | 2022 | CAGR* % 2018-2022 | 2023 | 2028 | CAGR* % 2022-2028 |
|---|---|---|---|---|---|---|
| Pet Population | 1,139.3 | 1,190.9 | 1.1 | 1,187.3 | 1,207.0 | 0.2 |
| Birds | 15.8 | 14.7 | −1.7 | 14.7 | 14.8 | 0.2 |
| Cats | 237.6 | 278.1 | 4.0 | 280.4 | 298.4 | 1.2 |
| Dogs (total) | 311.6 | 312.4 | 0.1 | 304.0 | 277.0 | −2.0 |
| Small Dogs (up to 20 pounds or 9 kilograms) | 217.4 | 231.0 | 1.5 | 226.0 | 209.4 | −1.6 |
| Medium Dogs (20 to 50 pounds or 9 to 23 kilograms) | 70.6 | 65.6 | −1.8 | 63.4 | 56.7 | −2.4 |
| Large Dogs (Over 50 pounds or over 23 kilograms) | 23.5 | 15.8 | −9.5 | 14.6 | 10.9 | −6.0 |
| Fish | 361.4 | 367.3 | 0.4 | 368.4 | 386.0 | 0.8 |
| Small mammal/reptiles (total) | 213.0 | 218.5 | 0.6 | 219.9 | 230.7 | 0.9 |
| Small mammals | 71.8 | 73.9 | 0.7 | 74.8 | 81.7 | 1.7 |
| Small Reptiles | 141.2 | 144.6 | 0.6 | 145.1 | 149.0 | 0.5 |
|
Source: Euromonitor International Limited, 2023, all rights reserved *CAGR: Compound Annual Growth Rate Historical data: 2018-2023 Forecast data: 2024-2028 |
||||||
From 2018 to 2023, the percentage of households which owned a cat has risen from 4.6% to 5.5%, while the number of households that owned a cat grew at a CAGR of 3.0%. Meanwhile, the percentage of households that owned a dog rose from 7.3% TO 7.6% over the same period. About 50,000 more households own dogs than cats in Hong Kong, although there may be overlap between households as some may own both dogs and cats.
The percentage of pet-owning households in Hong Kong remains small, both relative to OECD countries and mainland China. In China, 15.4% of households owned cats and 16.7% of households owned dogs in 2023. Ownership levels are similar to Japan (where 8.6% of households had cats and 9.6% had dogs in 2023), and significantly lower than the United Kingdom (21.3% of households with cats, 28.8% with dogs in 2023) or Canada (39.9% of households with cats, 35.8% with dogs in 2023).
| Category | 2018 | 2019 | 2020 | 2021 | 2022 | 2023 | CAGR* % 2018-2023 |
|---|---|---|---|---|---|---|---|
| Cat | 119.4 | 125.8 | 140.7 | 142.0 | 145.3 | 149.5 | 3.8 |
| % share | 4.6 | 4.8 | 5.3 | 5.3 | 5.4 | 5.5 | 3.0 |
| Dog | 190.7 | 190.3 | 197.7 | 200.0 | 203.9 | 209.2 | 1.6 |
| % share | 7.3 | 7.2 | 7.4 | 7.5 | 7.5 | 7.6 | 0.7 |
|
Source: Euromonitor International Limited, 2023, all rights reserved *CAGR: Compound Annual Growth Rate |
|||||||
One likely explanation for the low percentage of pet owning households in Hong Kong is high urbanization and population density. Hong Kong had over 7,000 people per square kilometre in 2022 (Euromonitor International, 2023), and this figure understates the actual population density as much of Hong Kong's landmass consists of sparsely populated mountains.
Retail market size
Retail sales of pet food grew significantly from 2018 to 2022 (9.4% CAGR). All categories grew, but growth was strongest for dog food (9.1% CAGR) and especially cat food (11% CAGR). The growth rate in pet food is forecasted to stay steady, with CAGR staying at 9.4% from 2022 to 2028. The growth in retail sales for dog and cat food is outpacing population growth, which suggests that premiumization. This is especially the case for dog food. The dog population was flat from 2018 to 2022, and declined for medium and large dogs, such that all growth would have been driven by value.
Fish food and bird food are small markets, each being measured in the hundreds of thousands rather than millions. Both segments grew from 2018 to 2022. Bird food is expected to slightly decrease through 2028, while fish food will continue to grow. Food for small mammals and reptiles grew at 5% CAGR from 2018 to 2022 and are forecasted to continue growing at 3% CAGR through 2028.
By 2028, pet food in Hong Kong is forecasted to be a billion dollar market. It will have doubled from US$504 million in 2018. Cat food alone will represent 54% of the market.
| Category | 2018 | 2022 | CAGR* % 2018-2022 | 2023 | 2028 | CAGR* % 2022-2028 |
|---|---|---|---|---|---|---|
| Pet food total | 504.8 | 723.6 | 9.4 | 761.4 | 1,010.0 | 9.4 |
| Bird Food | 0.1 | 0.1 | 3.6 | 0.1 | 0.1 | −0.7 |
| Cat Food | 248.8 | 379.2 | 11.0 | 402.2 | 545.0 | 11.1 |
| Dog Food | 253.9 | 342.0 | 9.1 | 356.7 | 462.0 | 7.7 |
| Fish Food | 0.3 | 0.4 | 4.5 | 0.4 | 0.4 | 2.3 |
| Small Mammal/Reptile Food | 1.7 | 1.9 | 5.0 | 2.0 | 2.4 | 3.0 |
|
Source: Euromonitor International Limited, 2023, all rights reserved *CAGR: Compound Annual Growth Rate |
||||||
Company shares
In 2022, the largest players in the Hong Kong pet food market were Mars Inc, which had a 9.5% market share, Colgate-Palmolive, with 4.9% market share, and Nestlé SA, with 4.4% market share. The Hong Kong pet food market is fragmented: the top 10 companies accounted for just over 25% of the total market. This fragmentation is increasing: in 2017, Mars represented 14% of the market, and companies outside of the top 10 were less than 70% of the market. Private label products are negligible in Hong Kong, with less than 0.1% market share.
| Company | 2017 | 2018 | 2019 | 2020 | 2021 | 2022 | CAGR* % 2017-2022 |
|---|---|---|---|---|---|---|---|
| Total | 100 | 100 | 100 | 100 | 100 | 100 | 9.1 |
| Mars Inc | 14.0 | 11.4 | 10.7 | 9.8 | 9.4 | 9.5 | 1.0 |
| Colgate-Palmolive Co | 5.8 | 5.9 | 5.9 | 5.7 | 5.4 | 4.9 | 5.5 |
| Nestlé SA | 4.3 | 4.3 | 4.4 | 4.2 | 4.2 | 4.4 | 9.8 |
| MaxiPro (Asia) Ltd | 1.8 | 1.9 | 2.0 | 2.2 | 2.2 | 2.1 | 12.1 |
| Inaba Pet Food Co Ltd | 0.3 | 0.3 | 0.4 | 1.0 | 1.2 | 1.3 | 47.8 |
| DoggyMan HA Co Ltd | 1.2 | 1.2 | 1.1 | 1.0 | 1.0 | 1.0 | 3.8 |
| Almo Nature SpA | 0.8 | 0.8 | 0.8 | 0.8 | 0.8 | 0.7 | 6.8 |
| Marukan Co Ltd | 0.8 | 0.8 | 0.7 | 0.7 | 0.6 | 0.6 | 4.0 |
| Stella & Chewy's LLC | 0.3 | 0.3 | 0.4 | 0.4 | 0.4 | 0.4 | 16.5 |
| Fromm Family Pet Foods LLC | 0.3 | 0.3 | 0.3 | 0.3 | 0.3 | 0.3 | 5.1 |
| Others | 70.4 | 72.8 | 73.3 | 73.9 | 74.5 | 74.8 | 10.7 |
|
Source: Euromonitor International Limited, 2023, all rights reserved *CAGR: Compound Annual Growth Rate |
|||||||
Brand shares
In 2022, 4 of the top 10 pet food brands in Hong Kong were owned by Mars Inc, two were owned by the Colgate-Palmolive Co, and two were owned by Nestlé SA. Mars saw their brand shares decrease for their three largest brands. Colgate-Palmolive's largest brand was Hill's Science Diet. While it decreased from 2017 to 2022, 2018 saw the introduction of the Hill's Prescription Diet brand into Hong Kong, which may have absorbed some of Science Diet's market share. Inaba has significantly increased their presence, from 0.3% to 1.3% with their Ciao brand cat treats.
| Brand | 2017 | 2018 | 2019 | 2020 | 2021 | 2022 | CAGR* % 2017-2022 |
|---|---|---|---|---|---|---|---|
| Total | 100 | 100 | 100 | 100 | 100 | 100 | 9.1 |
| Royal Canin (Mars Inc) | 6.9 | 5.1 | 5.0 | 4.8 | 4.8 | 5.3 | 3.5 |
| Hill's Science Diet (Colgate-Palmolive Co) | 5.8 | 4.1 | 4.1 | 4.0 | 3.8 | 3.4 | −1.8 |
| Kakato (MaxiPro (Asia) Ltd) | 1.8 | 1.9 | 2.0 | 2.2 | 2.2 | 2.1 | 12.1 |
| Mon Petit (Nestlé SA) | 0.7 | 1.0 | 1.0 | 1.3 | 1.6 | 1.8 | 32.6 |
| Pedigree (Mars Inc) | 3.1 | 2.8 | 2.6 | 2.1 | 1.9 | 1.7 | −3.3 |
| Hill's Prescription Diet (Colgate-Palmolive Co) | 1.8 | 1.8 | 1.7 | 1.6 | 1.5 | N/C | |
| Ciao (Inaba Pet Food Co.) | 0.3 | 0.3 | 0.4 | 1.0 | 1.2 | 1.3 | 47.8 |
| Pro Plan (Nestlé SA) | 1.3 | 1.3 | 1.2 | 1.0 | 1.0 | 1.0 | 4.5 |
| Whiskas (Mars Inc) | 2.0 | 1.9 | 1.6 | 1.2 | 1.1 | 0.9 | −6.1 |
| Sheba (Mars Inc) | 0.5 | 0.6 | 0.8 | 0.9 | 1.0 | 0.9 | 25.9 |
| Others | 77.6 | 79.2 | 79.5 | 79.8 | 79.8 | 80.1 | 10.7 |
|
Source: Euromonitor International Limited, 2023, all rights reserved *CAGR: Compound Annual Growth Rate N/C: Not calculable |
|||||||
Market Segmentation
Dog food
Dog food sales in Hong Kong are driven by high-end sectors. Barely any economy dry food was sold in Hong Kong in 2022, and the amount of economy wet food sold was negligible at most. 92% of the dry dog food sold in Hong Kong was premium, as was 94% of the wet dog food. For both wet and dry food, premium sales have increased while mid-priced sales have decreased. To summarize trends in Hong Kong dog ownership, Hong Kong's dogs were smaller in 2022 than they were in 2018, and they eat more expensive food. Dog treats and mixers, for their part, grew 37.7% from 2018 to 2022 in Hong Kong.
As in other countries and jurisdictions, premiumization is driven by increased humanization of petsFootnote 1. Dog owners want to buy their dogs food and treats that are healthier, more nutritious, natural, and tastier. Some of the treats sold in Hong Kong are specially designed to resemble human food.
The dog population grew in Hong Kong during the early pandemic, but has since fallen slightly due to outmigration of Hong Kong residents (who would then have taken their dogs with them). This outmigration trend is expected to reverse somewhat with the easing of pandemic restrictions. Nonetheless, the shift in consumer preferences from dogs to cats and small mammals, and from large and medium dog breeds towards smaller dogs.
Wet dog food is growing faster than dry dog food in Hong Kong. Wet dog food grew at 13.3% CAGR from 2017 to 2022, compared to 6.2% for dry dog food over the same period. Wet dog food is expected to growth 6.1% from 2022 to 2028, while dry dog food will grow 4.1% over the same period.
| Category | 2017 | 2018 | 2019 | 2020 | 2021 | 2022 |
|---|---|---|---|---|---|---|
| Dog Food Total | 234.7 | 253.9 | 270.1 | 302.4 | 330.1 | 342.0 |
| Dry Dog Food | 132.5 | 144.4 | 153.6 | 169.3 | 179.5 | 179.2 |
| Economy Dry Dog Food | 0.1 | 0.1 | 0.1 | 0.1 | 0.1 | 0.1 |
| Mid-Priced Dry Dog Food | 16.1 | 15.8 | 15.4 | 14.4 | 14.2 | 13.7 |
| Premium Dry Dog Food | 116.3 | 128.4 | 138.1 | 154.8 | 165.1 | 165.3 |
| Wet Dog Food | 26.4 | 28.8 | 31.1 | 36.2 | 43.9 | 49.3 |
| Economy Wet Dog Food | 0.0 | 0.0 | 0.0 | 0.0 | 0.0 | 0.0 |
| Mid-Priced Wet Dog Food | 3.1 | 3.0 | 2.9 | 3.1 | 3.0 | 2.8 |
| Premium Wet Dog Food | 23.2 | 25.8 | 28.2 | 33.1 | 40.9 | 46.5 |
| Dog Treats and Mixers | 75.8 | 80.7 | 85.4 | 96.8 | 106.7 | 113.5 |
| Source: Euromonitor International Limited, 2023, all rights reserved | ||||||
| Category | Annual growth % 2021-2022 | CAGR* % 2017-2022 | Total growth % 2017-2022 |
|---|---|---|---|
| Dog Food Total | 3.6 | 7.8 | 45.7 |
| Dry Dog Food | −0.2 | 6.2 | 35.2 |
| Economy Dry Dog Food | −1.5 | −1.5 | −7.2 |
| Mid-Priced Dry Dog Food | −3.5 | −3.2 | −14.9 |
| Premium Dry Dog Food | 0.1 | 7.3 | 42.2 |
| Wet Dog Food | 12.3 | 13.3 | 87.0 |
| Economy Wet Dog Food | −8.4 | −22.7 | −72.5 |
| Mid-Priced Wet Dog Food | −5.9 | −1.8 | −8.9 |
| Premium Wet Dog Food | 13.6 | 14.9 | 100.2 |
| Dog Treats and Mixers | 6.4 | 8.4 | 49.8 |
|
Source: Euromonitor International Limited, 2023, all rights reserved CAGR: Compound Annual Growth Rate |
|||
| Category | 2023 | 2024 | 2025 | 2026 | 2027 | 2028 |
|---|---|---|---|---|---|---|
| Dog Food Total | 356.7 | 376.0 | 396.3 | 417.3 | 439.8 | 462.0 |
| Dry Dog Food | 188.8 | 196.6 | 204.0 | 211.7 | 220.0 | 227.7 |
| Economy Dry Dog Food | 0.1 | 0.1 | 0.1 | 0.1 | 0.1 | 0.1 |
| Mid-Priced Dry Dog Food | 13.0 | 12.9 | 12.8 | 12.8 | 12.9 | 12.9 |
| Premium Dry Dog Food | 175.6 | 183.6 | 191.1 | 198.8 | 207.0 | 214.7 |
| Wet Dog Food | 51.7 | 55.6 | 59.2 | 62.8 | 66.7 | 70.5 |
| Economy Wet Dog Food | 0.0 | 0.0 | 0.0 | 0.0 | 0.0 | 0.0 |
| Mid-Priced Wet Dog Food | 2.6 | 2.5 | 2.4 | 2.3 | 2.2 | 2.1 |
| Premium Wet Dog Food | 49.1 | 53.1 | 56.7 | 60.5 | 64.5 | 68.4 |
| Dog Treats and Mixers | 116.2 | 123.8 | 133.1 | 142.8 | 153.2 | 163.8 |
| Source: Euromonitor International Limited, 2023, all rights reserved | ||||||
| Category | Annual growth % 2022-2023 | CAGR* % 2022-2028 | Total growth % 2022-2028 |
|---|---|---|---|
| Dog Food Total | 4.3 | 5.1 | 35.1 |
| Dry Dog Food | 5.4 | 4.1 | 44.3 |
| Economy Dry Dog Food | −3.9 | −1.6 | 27.1 |
| Mid-Priced Dry Dog Food | −5.0 | −1.0 | −9.1 |
| Premium Dry Dog Food | 6.2 | 4.5 | −6.0 |
| Wet Dog Food | 4.9 | 6.1 | 29.9 |
| Economy Wet Dog Food | −3.9 | −13.9 | 42.9 |
| Mid-Priced Wet Dog Food | −8.1 | −5.1 | −59.1 |
| Premium Wet Dog Food | 5.7 | 6.7 | −27.0 |
| Dog Treats and Mixers | 2.4 | 6.3 | 47.2 |
|
Source: Euromonitor International Limited, 2023, all rights reserved *CAGR: Compound Annual Growth Rate |
|||
| Company | 2017 | 2018 | 2019 | 2020 | 2021 | 2022 | CAGR* % 2017-2022 |
|---|---|---|---|---|---|---|---|
| Total | 100 | 100 | 100 | 100 | 100 | 100 | −1.5 |
| Mars Inc | 15.5 | 12.0 | 11.0 | 10.0 | 9.6 | 9.9 | 11.3 |
| Colgate-Palmolive Co | 4.7 | 6.9 | 6.7 | 6.7 | 6.0 | 5.5 | −6.5 |
| Nestlé SA | 4.7 | 3.1 | 3.0 | 2.6 | 2.3 | 2.3 | 5.1 |
| DoggyMan HA Co Ltd | 1.5 | 1.5 | 1.4 | 1.4 | 1.3 | 1.3 | 4.0 |
| Marukan Co Ltd | 1.6 | 1.5 | 1.5 | 1.4 | 1.3 | 1.3 | 16.5 |
| Stella & Chewy's LLC | 0.6 | 0.7 | 0.7 | 0.8 | 0.9 | 0.9 | 5.1 |
| Fromm Family Pet Foods LLC | 0.6 | 0.6 | 0.6 | 0.6 | 0.6 | 0.6 | 8.0 |
| Almo Nature SpA | 0.5 | 0.5 | 0.5 | 0.5 | 0.5 | 0.5 | 15.8 |
| MaxiPro (Asia) Ltd | 0.3 | 0.3 | 0.4 | 0.4 | 0.5 | 0.5 | −1.5 |
| H&H Group | 0.6 | 0.6 | 0.2 | N/C | |||
| Others | 70.0 | 72.9 | 74.2 | 75.0 | 76.4 | 77.0 | 10.4 |
|
Source: Euromonitor International Limited, 2023, all rights reserved *CAGR: Compound Annual Growth Rate N/C: Not calculable |
|||||||
In 2022, the dog food market in Hong Kong was segmented, as was the case for the cat food market. The market share of the largest company, Mars, has fallen relative to 2017. Companies outside of the top 10 amounted to 77.0% of the market, as opposed to 70% of the market in 2017.
Cat food
Over the last five years, growth in the cat food sector has been driven by premiumization and a growing cat population. As such, cat food sales growth outpaced dog food sales growth from 2018 to 2022, and this trend will continue through 2028. In 2018, dog food sales exceeded cat food sales in retail value. By 2022, cat food sales were more significant than dog food sales, despite the fact that the cat population is still currently smaller than the dog population. Growth in cat food is thus characterized by strong underlying structural trends.
Inflation has led to part of the increase in the value of cat food sales in Hong KongFootnote 1, especially for wet food. While volume sales are up from 2018, they have been flat since 2020. Recent growth in the retail value of cat food is thus explained by increases in the prices of food, both due to inflation and premiumization. Nonetheless, the projected increase in the cat population through 2028 should lead to growth in volume sales, in addition to value sales growth.
Hong Kong cat owners tend to extensively research the food they give to their cats, and they value high-quality products with natural ingredients. Imported products are popular, and owners are willing to absorb price increases. As Euromonitor International (2023) notes, and as most cat owners would know, cats are particular eaters who form habits. Switching food is a gradual process, and if a cat dislikes her new food, the remainder of the bag may go to waste. As such, cat owners are price-inelastic, especially with regards to dry food.
Treats are increasing in popularity. Sales of treats have more than doubled between 2018 and 2022, and treats outpaced both wet and dry food in terms of growth. Contrary to dry food, cat owners are willing to switch between treats, as these are not essential to a cat's continued health and cats are more tolerant of changes to routine when it comes to treats. As such, the cat treats and mixers sector is characterized by high competition.
Economy cat food sales in Hong Kong are negligible. Mid-priced cat food is marginal and declining. All growth in both wet and dry food has occurred in the premium sector. Wet food is expected to outpace dry food, growing at a forecasted 7.6% CAGR as opposed to 3.6% CAGR for dry food from 2022 to 2028.
| Category | 2017 | 2018 | 2019 | 2020 | 2021 | 2022 |
|---|---|---|---|---|---|---|
| Cat Food Total | 231.0 | 248.8 | 269.8 | 317.1 | 350.6 | 379.2 |
| Dry Cat Food | 109.1 | 115.8 | 124.0 | 140.2 | 146.5 | 155.0 |
| Economy Dry Cat Food | 0.0 | 0.0 | 0.0 | 0.0 | 0.0 | 0.0 |
| Mid-Priced Dry Cat Food | 3.1 | 3.2 | 3.1 | 2.9 | 2.6 | 2.6 |
| Premium Dry Cat Food | 106.0 | 112.7 | 121.0 | 137.4 | 143.9 | 152.4 |
| Wet Cat Food | 102.2 | 111.2 | 122.1 | 144.0 | 161.7 | 177.3 |
| Economy Wet Cat Food | 0.0 | 0.0 | 0.0 | 0.0 | 0.0 | 0.0 |
| Mid-Priced Wet Cat Food | 7.3 | 7.9 | 7.6 | 6.6 | 6.2 | 5.0 |
| Premium Wet Cat Food | 94.8 | 103.3 | 114.5 | 137.4 | 155.5 | 172.4 |
| Cat Treats and Mixers | 19.7 | 21.7 | 23.6 | 32.9 | 42.3 | 46.9 |
| Source: Euromonitor International Limited, 2023, all rights reserved
|
||||||
| Category | Annual growth % 2021-2022 | CAGR* % 2017-2022 | Total growth % 2017-2022 |
|---|---|---|---|
| Cat Food Total | 8.2 | 10.4 | 64.2 |
| Dry Cat Food | 5.8 | 7.3 | 42.1 |
| Economy Dry Cat Food | −9.7 | −16.3 | −58.8 |
| Mid-Priced Dry Cat Food | −2.1 | −3.7 | −17.1 |
| Premium Dry Cat Food | 5.9 | 7.5 | 43.8 |
| Wet Cat Food | 9.7 | 11.7 | 73.6 |
| Economy Wet Cat Food | −8.0 | −28.7 | −81.6 |
| Mid-Priced Wet Cat Food | −19.4 | −7.4 | −31.9 |
| Premium Wet Cat Food | 10.8 | 12.7 | 81.7 |
| Cat Treats and Mixers | 10.8 | 18.9 | 137.9 |
|
Source: Euromonitor International Limited, 2023, all rights reserved *CAGR: Compound Annual Growth Rate |
|||
| Category | 2023 | 2024 | 2025 | 2026 | 2027 | 2028 |
|---|---|---|---|---|---|---|
| Cat Food Total | 402.2 | 430.9 | 459.6 | 488.0 | 515.9 | 545.0 |
| Dry Cat Food | 157.8 | 166.8 | 172.9 | 179.7 | 185.5 | 191.8 |
| Economy Dry Cat Food | 0.0 | 0.0 | 0.0 | 0.0 | 0.0 | 0.0 |
| Mid-Priced Dry Cat Food | 2.2 | 2.1 | 1.9 | 1.7 | 1.6 | 1.5 |
| Premium Dry Cat Food | 155.6 | 164.7 | 171.0 | 177.9 | 183.9 | 190.3 |
| Wet Cat Food | 194.2 | 209.4 | 226.5 | 243.4 | 260.2 | 278.0 |
| Economy Wet Cat Food | 0.0 | 0.0 | 0.0 | 0.0 | 0.0 | 0.0 |
| Mid-Priced Wet Cat Food | 5.2 | 4.8 | 4.7 | 4.2 | 3.5 | 2.9 |
| Premium Wet Cat Food | 188.9 | 204.6 | 221.8 | 239.2 | 256.7 | 275.1 |
| Cat Treats and Mixers | 50.3 | 54.7 | 60.2 | 64.9 | 70.2 | 75.2 |
| Source: Euromonitor International Limited, 2023, all rights reserved | ||||||
| Category | Annual growth % 2022-2023 | CAGR* % 2022-2028 | Total growth % 2022-2028 |
|---|---|---|---|
| Cat Food Total | 6.1 | 6.2 | 43.7 |
| Dry Cat Food | 1.8 | 3.6 | 23.7 |
| Economy Dry Cat Food | −9.1 | −6.5 | −33.1 |
| Mid-Priced Dry Cat Food | −14.0 | −9.0 | −43.0 |
| Premium Dry Cat Food | 2.1 | 3.8 | 24.9 |
| Wet Cat Food | 9.5 | 7.8 | 56.8 |
| Economy Wet Cat Food | −35.4 | −23.0 | −79.2 |
| Mid-Priced Wet Cat Food | 5.5 | −8.7 | −41.9 |
| Premium Wet Cat Food | 9.6 | 8.1 | 59.6 |
| Cat Treats and Mixers | 7.2 | 8.2 | 60.3 |
|
Source: Euromonitor International Limited, 2023, all rights reserved *CAGR: Compound Annual Growth Rate |
|||
In 2022, Hong Kong cat food sales were segmented. The largest player, Mars Hong Kong Ltd, had only a 9.2% market share, down from 12.5% in 2017. Companies outside of the top 10 accounted for 72.3% of the market in 2022, as opposed to 70% in 2017. Private label cat food and treats are marginal at most in Hong Kong.
| Company | 2017 | 2018 | 2019 | 2020 | 2021 | 2022 | CAGR* % 2017-2022 |
|---|---|---|---|---|---|---|---|
| Total | 100 | 100 | 100 | 100 | 100 | 100 | 10.4 |
| Mars Hong Kong Ltd | 12.5 | 10.9 | 10.5 | 9.6 | 9.2 | 9.2 | 3.8 |
| Nestlé Hong Kong Ltd | 3.9 | 5.7 | 5.8 | 5.7 | 6.1 | 6.3 | 21.8 |
| Hill's Pet Nutrition Inc | 6.9 | 4.8 | 5.0 | 4.9 | 4.7 | 4.3 | 0.5 |
| MaxiPro (Asia) Ltd | 3.4 | 3.5 | 3.8 | 3.9 | 3.8 | 3.6 | 11.7 |
| Inaba Pet Food Co Ltd | 0.6 | 0.7 | 0.7 | 1.9 | 2.4 | 2.5 | 47.8 |
| Almo Nature SpA | 1.1 | 1.1 | 1.0 | 1.0 | 1.0 | 0.9 | 6.2 |
| DoggyMan HA Co Ltd | 1.0 | 0.8 | 0.7 | 0.7 | 0.7 | 0.7 | 1.9 |
| AIXIA Corp | 0.3 | 0.3 | 0.2 | 0.3 | 0.2 | 0.2 | 6.4 |
| Kingfisher Holdings Ltd | 0.2 | 0.1 | 0.1 | 0.1 | 0.0 | 0.0 | −24.2 |
| Nippon Pet Food Ltd | 0.1 | 0.1 | 0.0 | 0.0 | 0.0 | 0.0 | −25.8 |
| Others | 70.0 | 72.0 | 72.2 | 71.9 | 71.9 | 72.3 | 11.1 |
|
Source: Euromonitor International Limited, 2023, all rights reserved *CAGR: Compound Annual Growth Rate |
|||||||
Other pet food
Hong Kong's fish, small mammal and small reptile populations grew slightly from 2018 to 2022, while the pet bird population shrank. As such, the increase in retail sales for other pet food was small in absolute number, and growth as measured by CAGR was less than for dogs and cats.
In January 2022, Hong Kong's hamster population was culled due to a COVID-19 outbreak among hamsters. In total, 2000 hamsters were euthanizedFootnote 2. Small mammals remain restricted in Hong Kong, and out-migration of Hong Kong residents led to small mammal abandonment due to these animals not being allowed to leave Hong Kong with their owners. As restrictions ease, small mammals are expected to become more popular, with forecasted CAGR population growth of 1.7% as opposed to 0.2% for birds, 0.8% for fish, and 0.5% for reptiles. It is possible, however, that the experience of the pandemic will permanently alter consumer preferences in Hong Kong, such that small mammals will not regain popularity.
The availability of birds, reptiles and fish remain low, and they are seen more as ornamental pets than as companionsFootnote 1. Turtles are the most popular reptiles, with snakes and lizards having low popularity. Exotic reptiles are rare, and likely to become even more rare due to stricter customs enforcement. Animal Trader Licenses are required to sell reptiles and birds, although there are no such restrictions on amphibians, fish or invertebrates.
Food for small mammals tends to be undifferentiated, except for treats. Small mammal food consists of Timothy hay and enriched vitamin pellets. Inflation has not had a significant impact on this kind of food, and thus the value of these sales have barely risen, from US$1.7 million in 2017 to US$ 1.9 million in 2022. Treats are increasing in popularity, especially dental treats that prevent overgrowthFootnote 1.
As of 2022, the Hong Kong other pet food market is small, at only US$2.4 million, which represents a mere 0.3% of the total pet food market in Hong Kong. Growth from 2017 to 2022 was 2.7% CAGR, and is forecasted at 3.5% CAGR from 2022 to 2028. Bird food sales shrank from 2017 to 2022, while food for all other pets grew. Growth is forecasted for all categories of other pet food, including birds, from 2022 through 2028.
| Category | 2017 | 2018 | 2019 | 2020 | 2021 | 2022 |
|---|---|---|---|---|---|---|
| Other Pet Food | 2.1 | 2.2 | 2.2 | 2.4 | 2.5 | 2.4 |
| Bird Food | 0.1 | 0.1 | 0.1 | 0.1 | 0.1 | 0.1 |
| Fish Food | 0.3 | 0.3 | 0.3 | 0.4 | 0.4 | 0.4 |
| Small Mammal/Reptile Food | 1.7 | 1.7 | 1.8 | 1.9 | 2.0 | 1.9 |
| Source: Euromonitor International Limited, 2023, all rights reserved | ||||||
| Category | Annual growth % 2021-2022 | CAGR* % 2017-2022 | Total growth % 2017-2022 |
|---|---|---|---|
| Other Pet Food | −2.4 | 2.7 | 14.5 |
| Bird Food | −0.6 | −1.4 | −6.7 |
| Fish Food | −2.3 | 2.4 | 12.3 |
| Small Mammal/Reptile Food | −2.5 | 3.0 | 16.1 |
|
Source: Euromonitor International Limited, 2023, all rights reserved CAGR: Compound Annual Growth Rate |
|||
| Category | 2023 | 2024 | 2025 | 2026 | 2027 | 2028 |
|---|---|---|---|---|---|---|
| Other Pet Food | 2.4 | 2.5 | 2.6 | 2.7 | 2.8 | 3.0 |
| Bird Food | 0.1 | 0.1 | 0.1 | 0.1 | 0.1 | 0.1 |
| Fish Food | 0.4 | 0.4 | 0.4 | 0.4 | 0.4 | 0.4 |
| Small Mammal/Reptile Food | 2.0 | 2.0 | 2.1 | 2.2 | 2.3 | 2.4 |
| Source: Euromonitor International Limited, 2023, all rights reserved | ||||||
| Category | Annual growth % 2022-2023 | CAGR* % 2022-2028 | Total growth % 2022-2028 |
|---|---|---|---|
| Other Pet Food | 0.8 | 3.5 | 23.0 |
| Bird Food | 0.2 | 2.1 | 13.4 |
| Fish Food | 0.4 | 2.9 | 18.7 |
| Small Mammal/Reptile Food | 1.0 | 3.7 | 24.2 |
|
Source: Euromonitor International Limited, 2023, all rights reserved *CAGR: Compound Annual Growth Rate |
|||
Contrary to dog and cat food, the market for other pet food in Hong Kong is highly concentrated. The top two companies have 23.4% and 22% market shares, respectively.
| Company | 2017 | 2018 | 2019 | 2020 | 2021 | 2022 | CAGR* % 2017-2022 |
|---|---|---|---|---|---|---|---|
| Total | 100 | 100 | 100 | 100 | 100 | 100 | 2.7 |
| Central Garden & Pet Co | 24.9 | 24.9 | 24.8 | 23.8 | 23.4 | 23.4 | 1.5 |
| Vitakraft Pet Care GmbH & Co kilograms | 22.7 | 22.7 | 23.0 | 22.5 | 22.2 | 22.0 | 2.1 |
| Kamihata Fish Ind Ltd | 1.8 | 1.8 | 1.7 | 1.7 | 1.7 | 1.8 | 2.7 |
| Others | 50.6 | 50.6 | 50.5 | 52.0 | 52.7 | 52.8 | 3.6 |
|
Source: Euromonitor International Limited, 2023, all rights reserved *CAGR: Compound Annual Growth Rate |
|||||||
Central Garden & Pet Co is the leader for bird food, while Kamihata Fish Ind Ltd is the leading company for fish food sales. Vitakraft Pet Care rivals Central Garden for small mammal and reptile food sales, with Central Garden having a market-leading 27.8% market share and Vitakraft having a 27.1% market share in 2022.
Distribution channels
In 2022, two thirds of pet food sales in Hong Kong took place through pet shops and pet superstores. Overall, store-based retailing accounted for 74.1% of total pet food sales, with supermarkets accounting for much of the balance. While store-based retailing grew by 5.8% CAGR from 2017 to 2022 in retail value, the market share of stores fell over this period, as stores represented 85.4% of sales in 2017.
The decline in store-based retail's market share is due to the rise in e-commerce. In 2017, 8.7% of pet food sold in Hong Kong was sold online. By 2022, this share had risen to a full 20%. E-commerce experienced 31.3% CAGR growth from 2017 to 2022. The share of food sold through veterinarians was stable, representing 5.9% in both 2017 and 2022, and fluctuating only slightly in the interim years.
Retail channels are similar for dog and cat food. For example, 65.7% of cat food was sold in pet shops and superstores in 2022, compared to 62.8% of dog food. Other pet food deviates from this trend: 88.1% of other pet food was sold in pet stores in 2022, and only 7.1% was sold through e-commerce. Veterinary clinics are not popular sales outlets for other pet food, representing only 1% of the market.
| Channel | 2017 | 2018 | 2019 | 2020 | 2021 | 2022 | CAGR* % 2017-2022 |
|---|---|---|---|---|---|---|---|
| Distribution channel (total) | 100 | 100 | 100 | 100 | 100 | 100 | 9.1 |
| Store-Based Retailing | 86.2 | 85.4 | 83.1 | 77.9 | 77.8 | 74.0 | 5.8 |
| Grocery Retailers | 13.9 | 13.4 | 12.9 | 12.0 | 11.3 | 9.4 | 0.9 |
| Supermarkets | 13.9 | 13.4 | 12.9 | 12.0 | 11.3 | 9.4 | 0.9 |
| Non-Grocery Retailers | 72.3 | 72.1 | 70.2 | 66.0 | 66.5 | 64.6 | 6.7 |
| General Merchandise Stores | 0.1 | 0.2 | 0.4 | 0.3 | N/C | ||
| Pet shops and superstores | 72.3 | 72.1 | 70.2 | 65.7 | 66.1 | 64.3 | 6.6 |
| Other non-grocery retailers | 0.0 | 0.0 | 0.0 | 0.0 | N/C | ||
| Non-Store Retailing | 8.1 | 8.7 | 10.9 | 15.8 | 16.1 | 20.4 | 31.3 |
| E-Commerce | 8.1 | 8.7 | 10.9 | 15.8 | 16.1 | 20.4 | 31.3 |
| Non-retail channels | 5.7 | 5.9 | 6.0 | 6.3 | 6.1 | 5.6 | 8.8 |
| Veterinary clinics | 5.7 | 5.9 | 6.0 | 6.3 | 6.1 | 5.6 | 8.8 |
|
Source: Euromonitor International Limited, 2023, all rights reserved *CAGR: Compound Annual Growth Rate N/C: Not calculable |
|||||||
Trade overview
Global imports
Globally, the market for dog and cat food increased a 12.0% CAGR between 2017 and 2022, with total imports reaching a value of 22.5 billion in 2022. The largest markets were the United States, with imports of US$2.2 billion (9.6% market share), Germany, with imports of US$2.1 billion (9.2% market share), and the United Kingdom, with imports of US$1.4 billion (6.1% market share). Canada was fourth, with US$1.3 billion (5.6% market share).
Hong Kong is a relatively small pet food market, which is to be expected given its small pet population. It is only the 37th largest import market in the world, and these numbers may be inflated by pet food products passing through Hong Kong on their way to China or other destinations in Asia. It grew at 2.2% CAGR from 2017 to 2022, well below the world growth rate over the same period, and was worth US$156 million in 2022.
| Country | 2017 | 2018 | 2019 | 2020 | 2021 | 2022 | CAGR* % 2017-2022 | Market share % 2022 |
|---|---|---|---|---|---|---|---|---|
| World (total) | 12,774 | 14,057 | 14,973 | 17,555 | 20,674 | 22,497 | 12.0 | 100 |
| United States | 847 | 986 | 1,032 | 1,237 | 1,540 | 2,169 | 20.7 | 9.6 |
| Germany | 1,350 | 1,467 | 1,515 | 1,685 | 1,995 | 2,080 | 9.0 | 9.2 |
| United Kingdom | 807 | 843 | 892 | 977 | 1,123 | 1,365 | 11.1 | 6.1 |
| Canada (4) | 669 | 683 | 800 | 898 | 1,064 | 1,259 | 13.5 | 5.6 |
| Poland | 440 | 571 | 696 | 989 | 1,150 | 1,141 | 21.0 | 5.1 |
| Italy | 617 | 634 | 682 | 709 | 853 | 938 | 8.7 | 4.2 |
| France | 684 | 702 | 721 | 903 | 1055 | 920 | 6.1 | 4.1 |
| Belgium | 598 | 518 | 528 | 678 | 748 | 793 | 5.8 | 3.5 |
| Netherlands | 537 | 638 | 611 | 700 | 784 | 786 | 7.9 | 3.5 |
| Japan | 619 | 644 | 647 | 674 | 703 | 754 | 4.0 | 3.4 |
| Hong Kong (37) | 140 | 134 | 139 | 171 | 152 | 156 | 2.2 | 0.7 |
|
Source: Global Trade Tracker, 2023 *CAGR: Compound Annual Growth Rate |
||||||||
Hong Kong imports
Hong Kong does not report imported canary seed, such that all pet food imports tracked in GTT are dog or cat food. In 2022, two-thirds of Hong Kong food import came from just five countries. The United States is the single largest supplier, providing about a fifth of imports. Canada is Hong Kong's third largest import partner. Canada has lost market share to other countries. Imports from Canada shrank from US$ 22 million in 2017 to US$ 19 million in 2022. Asian import partners such as Thailand, Japan and Taiwan have increased their market share over the last six years. Between 2020 and 2021, the United States saw its market share of Hong Kong imports fall significantly. In 2020, the United States represented 47% of Hong Kong pet food imports. In 2022, that number had fallen to 23.5%.
| Country | 2017 | 2018 | 2019 | 2020 | 2021 | 2022 | CAGR* % 2017-2022 | Market share % 2022 |
|---|---|---|---|---|---|---|---|---|
| World (total) | 141 | 132 | 138 | 170 | 150 | 153 | 1.7 | 100 |
| United States | 66 | 65 | 69 | 80 | 44 | 36 | −11.4 | 23.5 |
| Thailand | 15 | 17 | 17 | 18 | 22 | 23 | 8.9 | 15.0 |
| Canada (3) | 22 | 9 | 12 | 16 | 10 | 19 | −2.9 | 12.4 |
| Japan | 6 | 6 | 6 | 11 | 14 | 13 | 16.7 | 8.5 |
| Taiwan | 1 | 2 | 1 | 2 | 8 | 12 | 64.4 | 7.8 |
| Germany | 2 | 4 | 6 | 6 | 7 | 12 | 43.1 | 7.8 |
| New Zealand | 3 | 3 | 4 | 4 | 6 | 6 | 14.9 | 3.9 |
| South Korea | 1 | 0 | 1 | 5 | 5 | 6 | 43.1 | 3.9 |
| Netherlands | 1 | 2 | 2 | 3 | 5 | 4 | 32.0 | 2.6 |
| China PRC | 2 | 3 | 3 | 4 | 6 | 4 | 14.9 | 2.6 |
|
Source: Global Trade Tracker, 2023 *CAGR: Compound Annual Growth Rate |
||||||||
Canada's performance
In 2022, Canada was Hong Kong's third largest supplier of pet food, with a 12.4% market share, according to Hong Kong import data. Canada exported US$18.5 million worth of dog and cat food to Hong Kong in 2022, totalling 4.8 million kilograms.
| HS code | Description | Import value (US$) | Import volume (kilograms) | Market share % |
|---|---|---|---|---|
| Pet food total | 18,509,833 | 4,774,262 | 100 | |
| 230910 | Dog or cat food | 18,509,833 | 4,774,262 | 100 |
| Source: Global Trade Tracker, 2023 | ||||
British Columbia accounted for more than half of the volume of pet food exports to Hong Kong in 2022, according to Canadian export data. Alberta, Ontario and Quebec made up most of the rest of the total, with New Brunswick accounting for the remaining 0.3%. By value, British Columbia's share represented slightly less than half of the total, at 46.3%.
| Province | Export value (US$) | Export volume (kilograms) | Share among provinces, % of value |
|---|---|---|---|
| Canada total | 17,271,113 | 7,291,287 | 100 |
| British Columbia | 7,993,737 | 3,651,494 | 46.3 |
| Alberta | 3,748,593 | 1,803,914 | 21.7 |
| Ontario | 2,852,442 | 944,391 | 16.5 |
| Quebec | 2,621,097 | 869,977 | 15.2 |
| New Brunswick | 55,244 | 21,511 | 0.3 |
| Source: Global Trade Tracker, 2023 | |||
Product launch analysis
According to Mintel's Global New Products Database (GNPD), a total of 318 new pet food products were launched in Hong Kong between 2018 and 2022.
More than half (52.5%) of these products were dog snacks and treats, with 167 total launches. Cat snacks and treats accounted for 24.2% of total launches, with 77 total launches. Wet cat food and dry cat food featured 30 and 25 total launches, respectively, while dry dog food and wet dog food featured 12 and 7 launches, with no new dog food launches in 2022.
The leading claim was No Additives. 59.4% of new products had such a claim, for a total of 167. Claims of low or no allergens were present on 39.9% of products (112 total). 101 products claimed to be free of added or artificial colouring, and 87 products claimed to be free of added or artificial preservatives.
New products in Hong Kong tend to be moderately priced. Over half (57.2%, 182 total) of the products launched in Hong Kong cost US$ 8.78 or less, and a third (33.0%, 105 total) cost less than US$ 4.78. Flexible stand-up pouches were the most popular package type, with 42.8% of total new products (136 total). Flexible packages of any type accounted for 81.4% of new products (259 total). Over half of new products were new launches (51.6%, 164 products total).
New flavour data is sparse. Mintel only recorded flavour data on 131 of its 318 new products between 2018 and 2022. Chicken, tuna and salmon were the most popular new flavours, followed by kangaroo.
| Product attributes | Yearly launch counts | Total | ||||
|---|---|---|---|---|---|---|
| 2018 | 2019 | 2020 | 2021 | 2022 | ||
| Yearly product launches | 71 | 54 | 69 | 65 | 59 | 318 |
| Top sub-categories | ||||||
| Dog Snacks and Treats | 37 | 21 | 34 | 34 | 41 | 167 |
| Cat Snacks and Treats | 9 | 18 | 23 | 15 | 12 | 77 |
| Cat Food Wet | 10 | 7 | 8 | 3 | 2 | 30 |
| Cat Food Dry | 8 | 3 | 1 | 9 | 4 | 25 |
| Dog Food Dry | 3 | 4 | 3 | 2 | 0 | 12 |
| Dog Food Wet | 4 | 1 | 0 | 2 | 0 | 7 |
| Top claims | ||||||
| No Additives / Preservatives | 36 | 28 | 35 | 26 | 42 | 167 |
| Low / No / Reduced Allergen | 32 | 17 | 20 | 24 | 19 | 112 |
| Social Media | 21 | 18 | 23 | 20 | 22 | 104 |
| Free from Added / Artificial Colourings | 20 | 17 | 23 | 12 | 29 | 101 |
| Free from Added / Artificial Preservatives | 12 | 11 | 24 | 13 | 27 | 87 |
| Top price groupings (US$) | ||||||
| 0.79 - 4.78 | 29 | 27 | 11 | 13 | 25 | 105 |
| 4.79 - 8.78 | 21 | 11 | 19 | 18 | 8 | 77 |
| 8.79 - 12.78 | 11 | 8 | 21 | 10 | 11 | 61 |
| 12.79 - 16.78 | 5 | 2 | 11 | 15 | 10 | 43 |
| 16.79 - 24.00 | 1 | 3 | 5 | 5 | 3 | 17 |
| Imported status | ||||||
| Imported | 35 | 34 | 35 | 28 | 38 | 170 |
| Not imported | 0 | 2 | 9 | 1 | 2 | 14 |
| Top packaged types | ||||||
| Flexible stand-up pouch | 36 | 13 | 21 | 44 | 22 | 136 |
| Flexible | 9 | 21 | 12 | 9 | 11 | 62 |
| Flexible stick-pack | 1 | 5 | 5 | 5 | 15 | 31 |
| Flexible sachet | 4 | 8 | 12 | 6 | 0 | 30 |
| Skinpack | 11 | 0 | 6 | 0 | 3 | 20 |
| Top launch types | ||||||
| New Product | 33 | 23 | 39 | 33 | 36 | 164 |
| New Variety / Range Extension | 21 | 24 | 22 | 23 | 11 | 101 |
| New Packaging | 14 | 7 | 5 | 9 | 8 | 43 |
| Relaunch | 2 | 0 | 0 | 0 | 4 | 6 |
| New Formulation | 1 | 0 | 3 | 0 | 0 | 4 |
| Top flavours (including blend) | ||||||
| Chicken | 13 | 6 | 7 | 4 | 7 | 37 |
| Tuna | 5 | 6 | 5 | 5 | 6 | 27 |
| Salmon | 3 | 4 | 4 | 4 | 2 | 17 |
| Kangaroo | 2 | 0 | 3 | 0 | 5 | 10 |
| Beef | 2 | 2 | 3 | 2 | 1 | 10 |
| Top ingredients | ||||||
| Food Acids | 24 | 20 | 16 | 17 | 11 | 88 |
| Vitamin E (Food) | 22 | 21 | 18 | 18 | 7 | 86 |
| Chicken Meat (Food) | 21 | 14 | 16 | 15 | 16 | 82 |
| Minerals (Food) | 13 | 10 | 14 | 21 | 10 | 68 |
| Food Colours | 20 | 9 | 12 | 8 | 7 | 56 |
| Source: Mintel GNPD, 2023, all rights reserved | ||||||
Examples of new products
Freeze Dried Slow Cooked Big Prawns Natural Treats for Cats and Dogs

Source: Mintel GNPD, 2023, all rights reserved.
| Company | Kwok Nung Trading |
|---|---|
| Brand | Favour Mao Hai Zhen Pin |
| Category | Pet Food |
| Sub-category | Cat snacks and treats |
| Import status | Not imported |
| Store type | Supermarket |
| Date published | January 2023 |
| Launch type | New product |
| Price in US dollars | 22.81 |
Favour Mao Hai Zhen Pin Freeze Dried Slow Cooked Argentinian Big Prawns Treat is now available, and retails in a 50 gram pack. Advertised as a 100% real meat snack that has been cooked and freeze dried. This product describes itself as being free from flavourings, preservatives and MSG and suitable for cats and dogs of all breeds aged over two months and onwards.
Kangaroo Jerky Cube Dog Treats
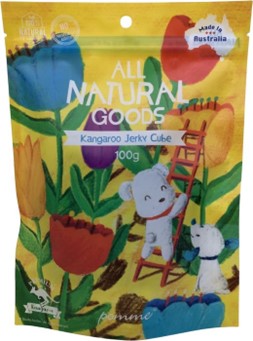
Source: Mintel GNPD, 2023, all rights reserved.
| Company | Pomme Collection |
|---|---|
| Brand | Pomme All Natural Goods |
| Category | Pet Food |
| Sub-category | Dog snacks and treats |
| Location of manufacture | Australia |
| Store type | Supermarket |
| Date published | November 2022 |
| Launch type | New product |
| Price in US dollars | 12.61 |
Pomme All Natural Goods Kangaroo Jerky Cube Dog Treats are now available, and retail in a 100 gram pack. Advertised as being made with 100% natural ingredients, premium quality, no preservatives, additives, colours, or allergens, and being made from 100% all-Australian only kangaroo leg meat.
Tuna Flavour Paste Snack
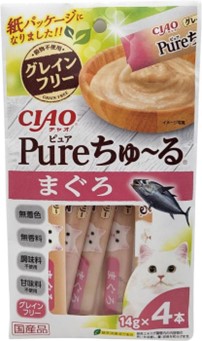
Source: Mintel GNPD, 2023, all rights reserved.
| Company | Inaba Foods |
|---|---|
| Brand | Ciao Pure Tulle |
| Category | Pet Food |
| Sub-category | Cat snacks and treats |
| Location of manufacture | Japan |
| Store type | Supermarket |
| Date published | June 2022 |
| Price in US dollars | 4.46 |
Ciao Pure Tulle Tuna Flavour Paste Snack has been repackaged in a paper pack. Advertised as free from grains and artificial additives including colourings, flavourings, added seasonings and sweeteners. It contains green tea extract to absorb bad digestive odours and reduce the odour of stools and urine. It retails in a pack containing four 14 gram sachets.
Cat Food with Mackerel
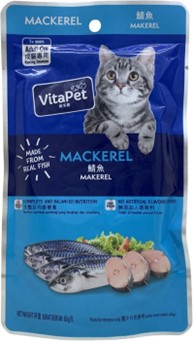
Source: Mintel GNPD, 2023, all rights reserved.
| Company | The Dairy Farm |
|---|---|
| Brand | VitaPet |
| Category | Pet Food |
| Sub-category | Cat food wet |
| Store type | Supermarket |
| Date published | June 2023 |
| Launch type | New variety / range extension |
| Price in US dollars | 0.77 |
VitaPet Cat Food with Mackerel is now available, and retails in an 85 gram pack. Marketed as being for adult cat (age one and up). Advertised as being made from real fish, having complete and balanced nutrition, no artificial flavours added, and featuring Omega 3 (DHA and EPA), Omega 6 unsaturated fatty acids, Vitamin E, Vitamin A and selenium. Formulated to meet the nutritional levels established by US AAFCO (Association Of American Feed Control Officials) cat food nutrient profiles for adult cat maintenance.
For more information
The Canadian Trade Commissioner Service:
International Trade Commissioners can provide Canadian industry with on-the-ground expertise regarding market potential, current conditions and local business contacts, and are an excellent point of contact for export advice.
More agri-food market intelligence:
International agri-food market intelligence
Discover global agriculture and food opportunities, the complete library of Global Analysis reports, market trends and forecasts, and information on Canada's free trade agreements.
Agri-food market intelligence service
Canadian agri-food and seafood businesses can take advantage of a customized service of reports and analysis, and join our email subscription service to have the latest reports delivered directly to their inbox.
More on Canada's agriculture and agri-food sectors:
Canada's agriculture sectors
Information on the agriculture industry by sector. Data on international markets. Initiatives to support awareness of the industry in Canada. How the department engages with the industry.
Resources
- Euromonitor International, 2023
- Global Trade Tracker, 2023
- Mintel Global New Products Database, 2023
- Dog Food in Hong Kong, China, Euromonitor International, April 2023
- Cat Food in Hong Kong, China, Euromonitor International, April 2023
- Other Pet Food in Hong Kong, China, Euromonitor International, April 2023
- Hong Kong to cull 2,000 hamsters after COVID-19 outbreak – Pang, J. and Siu, T., Reuters, January 2022
Sector Trend Analysis – Pet food trends in Hong Kong
Global Analysis Report
Prepared by: Alexandre Holm Perrault, Market Analyst
© His Majesty the King in Right of Canada, represented by the Minister of Agriculture and Agri-Food (2023).
Photo credits
All photographs reproduced in this publication are used by permission of the rights holders.
All images, unless otherwise noted, are copyright His Majesty the King in Right of Canada.
To join our distribution list or to suggest additional report topics or markets, please contact:
Agriculture and Agri-Food Canada, Global Analysis1341 Baseline Rd, Tower 5, 3rd floor
Ottawa ON K1A 0C5
Canada
Email: aafc.mas-sam.aac@agr.gc.ca
The Government of Canada has prepared this report based on primary and secondary sources of information. Although every effort has been made to ensure that the information is accurate, Agriculture and Agri-Food Canada (AAFC) assumes no liability for any actions taken based on the information contained herein.
Reproduction or redistribution of this document, in whole or in part, must include acknowledgement of agriculture and agri-food Canada as the owner of the copyright in the document, through a reference citing AAFC, the title of the document and the year. Where the reproduction or redistribution includes data from this document, it must also include an acknowledgement of the specific data source(s), as noted in this document.
Agriculture and Agri-Food Canada provides this document and other report services to agriculture and food industry clients free of charge.