

Note: This report includes forecasting data that is based on baseline historical data.
Executive summary
The pet population in Mexico has increased by a compound annual growth rate (CAGR) of 5.5% from 2016 to 2021, rising from 24.7 million to 32.2 million over the historic period. Dog ownership was significantly more common than cat ownership.
Mexican imports of petfood totalled US$204.5 million in 2021, making Mexico the fifteenth largest import market in the world. Mexican pet food imports grew at a CAGR of 13.0% from 2016 to 2021. Canada was Mexico's second largest supplier of pet food in 2021, and was responsible for US$47.3 million in Mexican imports, representing a 23.1% market share.
Retail sales of pet food in Mexico increased by a CAGR of 9.4% from 2016-2021, reaching a total value of US$2.6 billion in 2021. From 2021 to 2026, growth is forecast to occur at a CAGR of 9.7%, with total sales reaching US$4.2 billion in 2026. In 2021, the largest categories of pet food were dog and cat food, which had retail sales of US$2.1 billion (80.1% market share) and US$0.5 billion (18.6% market share) respectively.
The largest company in 2021 was Mars Inc, which controlled 33.4% of the market in 2021. Together the five largest companies held 71.2% of the market in 2021.
Pet food sales in Thailand were distributed primarily through store-based retailing, which accounted for 91.6% of the market. Veterinary clinics had a 4.7% market share, while e-commerce accounted for the remaining 3.8% of pet food sales.
According to Mintel's Global New Products Database (GNPD) there were 898 pet food product launches in Thailand from January 2016 to December of 2021. Top sub-categories were dog snacks and treats, dog food dry and cat food wet.
Pet population and ownership
There were a total of 32.2 million pets in Mexico in the year 2021, up from 24.7 million in 2016. The pet population grew at a robust CAGR of 5.5% from 2016-2021, and is expected to grow at a more modest CAGR of 3.9% from 2021-2026. In 2026, the total pet population is forecast to reach 39.1 million. In 2021, Dogs were by far the most popular pet, with small dogs having enjoyed particular popularity. 70.0% of all pets in 2021 were dogs. There were 22.6 million dogs in Mexico in 2021, of which 14.7 million (65.5%) weighed less than 9 kilograms, 6.6 million (29.2%) weighed between 9 and 23 kilograms, and 1.3 million (5.9%) weighed over 23 kilograms. Cats were the second largest category in 2021. With 6.4 million individuals, they accounted for 19.7% of the pet population.
From 2016-2021, the cat population enjoyed the fastest growth, rising at a CAGR of 9.7%, compared with a rate of 5.0% for dogs, which were the second fastest growing category. Small dogs saw the fastest growth rate of any type of dogs, while large dogs saw their numbers decline. From 2021-2026, cats are expected to see population growth at a CAGR of 7.4%, compared with a rate of 3.3% for dogs.
| Category | 2016 | 2021 | CAGR* % 2016-2021 | 2022 | 2026 | CAGR* % 2021-2026 |
|---|---|---|---|---|---|---|
| Pet Population | 24,725.9 | 32,243.8 | 5.5 | 33,709.3 | 39,087.1 | 3.9 |
| Birds | 1,402.3 | 1,520.5 | 1.6 | 1,540.4 | 1,598.5 | 1.0 |
| Cats | 4,013.5 | 6,362.1 | 9.7 | 6,909.9 | 9,094.9 | 7.4 |
| Dogs (total) | 17,653.2 | 22,582.9 | 5.0 | 23,458.2 | 26,528.9 | 3.3 |
| Small Dogs (up to 20 pounds or 9 kilograms) | 10,906.0 | 14,670.0 | 6.1 | 15,331.6 | 17,673.1 | 3.8 |
| Medium Dogs (20 to 50 pounds or 9 to 23 kilograms) | 5,234.5 | 6,584.6 | 4.7 | 6,815.0 | 7,587.9 | 2.9 |
| Large Dogs (Over 50 pounds or over 23 kilograms) | 1,512.7 | 1,328.3 | −2.6 | 1,311.6 | 1,267.9 | −0.9 |
| Fish | 1,321.3 | 1,404.0 | 1.2 | 1,418.6 | 1,455.3 | 0.7 |
| Small mammal/reptiles (total) | 335.6 | 374.2 | 2.2 | 382.1 | 409.4 | 1.8 |
| Small mammals | 268.5 | 300.0 | 2.2 | 306.5 | 329.5 | 1.9 |
| Small Reptiles | 67.1 | 74.1 | 2.0 | 75.6 | 80.0 | 1.5 |
|
Source: Euromonitor International, 2022 *CAGR: Compound Annual Growth Rate Historical data: 2016 to 2021 Forecast data: 2022 to 2026 |
||||||
From 2016-2021 the percentage of households which owned a cat has risen from 10.4% to 12.7%, while the number of households that owned a cat grew at a CAGR of 6.0%. Meanwhile, the percentage of households that owned a dog rose from 41.2% TO 42.5% over the same period, with the number of households that owned a dog growing at a CAGR of 2.5%. Overall, there were significantly more households which owned dogs than cats, although the number of households which owned cats experienced much faster growth.
| Category | 2016 | 2017 | 2018 | 2019 | 2020 | 2021 | CAGR* % 2016-2021 |
|---|---|---|---|---|---|---|---|
| Cat | 3,448.5 | 3,551.8 | 3,884.3 | 4,063.6 | 4,345.1 | 4,615.3 | 6.0 |
| Cat % share | 10.4 | 10.5 | 11.3 | 11.6 | 12.1 | 12.7 | 4.1 |
| Dog | 13,641.9 | 14,051.6 | 14,661.8 | 14,949.2 | 15,218.6 | 15,449.8 | 2.5 |
| Dog % share | 41.2 | 41.5 | 42.5 | 42.5 | 42.5 | 42.5 | 0.6 |
|
Source: Euromonitor International, 2022 *CAGR: Compound Annual Growth Rate |
|||||||
Retail market size
Retail sales of pet food saw strong growth from 2016-2021, with key drivers of sales being rising pet populations and premiumization of pet food. Growth in sales of cat food have been driven mostly by population growth, with sales having growth at a CAGR of 11.0%, modestly above the population growth rate of 9.7% over the same period. Dog food has seen sales growth more driven by premiumization., Retail sales of dog food saw a growth in food sales at a CAGR 9.1% compared to a population growth rate of 5.0%. This trend occurred despite declining numbers of larger dogs with larger dietary needs.
Total sales of pet food in 2021 were US$2.6 billion, having grown at a CAGR of 9.4% from 2016-2021. Growth is expected to accelerate slightly from 2021-2026, and total sales are forecast to reach US$4.2 billion in 2026. Dog food made up the vast majority of pet food sales in 2021, with total retail volume of US$2.1 billion, accounting for 80.1% of the market. Cat food was the second largest category, accounting for 18.6% of the market, while all other sales of pet food collectively accounted for 1.3%. Cat food saw the fastest growth from 2016-2021 at a CAGR of 11.0%, with sales of dog food somewhat behind at a CAGR of 9.1%. Sales of small mammal/reptile food grew at a CAGR of 5.0%, fish food grew at 4.5%, and bird food grew at 3.6%.
From 2021-2022, growth sales of cat food are expected to decelerate slightly to a CAGR of 10.8%, as the growth in the cat population drops significantly. Sales of dog food are expected to see sales growth jump to a CAGR of 9.5%, even as growth in the dog population also slows significantly. Small mammal/reptile food is forecast to see sales growth at a CAGR of 6.8%, fish food is expected to grow at a CAGR of 6.1%, and bird food is expected to grow at a CAGR of 3.2%. By 2026, retail sales of dog food are expected to reach US$3.3 billion, while cat food sales reach US$0.8 billion.
| Category | 2016 | 2021 | CAGR* % 2016-2021 | 2022 | 2026 | CAGR* % 2021-2026 |
|---|---|---|---|---|---|---|
| Pet food total | 1,679.3 | 2,629.9 | 9.4 | 2,904.6 | 4,176.1 | 9.7 |
| Bird Food | 11.0 | 13.1 | 3.6 | 13.7 | 15.3 | 3.2 |
| Cat Food | 289.5 | 488.9 | 11.0 | 545.4 | 814.9 | 10.8 |
| Dog Food | 1,362.3 | 2,107.4 | 9.1 | 2,323.4 | 3,318.1 | 9.5 |
| Fish Food | 14.7 | 18.3 | 4.5 | 19.6 | 24.6 | 6.1 |
| Small Mammal/Reptile Food | 1.8 | 2.3 | 5.0 | 2.5 | 3.2 | 6.8 |
|
Source: Euromonitor International, 2022 *CAGR: Compound Annual Growth Rate |
||||||
Company shares
In 2021, the largest players in the pet food market were Mars Inc which held 33.4% of the market, Nestlé SA which held 23.2% of the market, and Archer Daniels Midland Co, which held 8.4%. Collectively, these three companies controlled 65.0% of the pet food market. Mars Inc has seen its market share decline significantly from 2016-2021, although sales have seen steady growth in absolute terms. Nestlé SA has seen its market share grow. Private label products accounted for 8.4% of the market in 2021, down slightly from 8.6% in 2016.
| Company | 2016 | 2017 | 2018 | 2019 | 2020 | 2021 | CAGR* % 2016-2021 |
|---|---|---|---|---|---|---|---|
| Total | 100.0 | 100.0 | 100.0 | 100.0 | 100.0 | 100.0 | 0.0 |
| Mars Inc | 38.9 | 36.3 | 34.4 | 33.6 | 33.4 | 33.4 | −3.0 |
| Nestlé SA | 21.7 | 22.0 | 22.9 | 23.3 | 23.2 | 23.2 | 1.3 |
| Archer Daniels Midland Co | 8.2 | 8.3 | 8.4 | N/C | |||
| Nueva Tecnología en Alimentación SA de CV | 3.5 | 3.8 | 3.9 | 3.9 | 3.9 | 3.9 | 2.2 |
| Colgate-Palmolive Co | 2.1 | 2.2 | 2.3 | 2.3 | 2.3 | 2.3 | 1.8 |
| Industrias Bachoco SAB de CV Actions | 1.1 | 1.2 | 1.2 | 1.2 | 1.2 | N/C | |
| Cargill Inc | 0.6 | 0.5 | 0.5 | 0.5 | 0.5 | 0.5 | −3.6 |
| Diamond Feeds Inc | 0.3 | 0.4 | 0.4 | 0.4 | 0.4 | 0.4 | 5.9 |
| Bukeye Feed Mills | 0.3 | 0.3 | 0.3 | 0.3 | 0.3 | 0.3 | 0.0 |
| Nature's Variety Inc | 0.2 | 0.2 | 0.3 | 0.3 | N/C | ||
| Private Label | 8.6 | 8.3 | 8.3 | 8.3 | 8.4 | 8.4 | −0.5 |
| Others | 24.0 | 25.1 | 25.6 | 17.8 | 17.8 | 17.7 | −5.9 |
|
Source: Euromonitor International, 2022 *CAGR: Compound Annual Growth Rate N/C: Not calculable |
|||||||
Brand shares
In 2021, 3 of the top 5 pet food brands in Mexico were owned by Mars Inc, one was owned by Nestlé SA, and the remaining one was owned by Archer Daniels Midland Co. The largest brand, Pedigree (Mars Inc), saw its value share decline substantially from 19.6% in 2016 to 16.7% in 2021. The second largest brand, Dog Chow (Nestlé SA), saw its market share rise from 7.5% in 2016 to 9.1% in 2021. The third largest brand, Whiskas (Mars Inc), maintained a relatively steady market share which was 7.7% of the market in 2021.
| Brand | 2016 | 2017 | 2018 | 2019 | 2020 | 2021 | CAGR* % 2016-2021 |
|---|---|---|---|---|---|---|---|
| Total | 100.0 | 100.0 | 100.0 | 100.0 | 100.0 | 100.0 | 0.0 |
| Pedigree (Mars Inc) | 19.6 | 18.5 | 17.4 | 16.8 | 16.7 | 16.7 | −3.2 |
| Dog Chow (Nestlé SA) | 7.5 | 8.3 | 9.0 | 9.2 | 9.1 | 9.1 | 3.9 |
| Whiskas (Mars Inc) | 7.5 | 7.6 | 7.6 | 7.6 | 7.6 | 7.7 | 0.5 |
| Ganador (Archer Daniels Midland Co) | 4.5 | 4.5 | 4.5 | N/C | |||
| Royal Canin (Mars Inc) | 4.1 | 4.1 | 4.2 | 4.3 | 4.4 | 4.4 | 1.4 |
| Campeón (Nestlé SA) | 3.3 | 3.2 | 3.6 | 3.9 | 4.0 | 4.0 | 3.9 |
| NUPEC (Nueva Tecnología en Alimentación SA de CV) | 3.5 | 3.8 | 3.9 | 3.9 | 3.9 | 3.9 | 2.2 |
| Pro Plan (Nestlé SA) | 3.3 | 3.3 | 3.3 | 3.4 | 3.4 | 3.4 | 0.6 |
| Mainstay (Nestlé SA) | 2.8 | 2.8 | 2.8 | 2.8 | 2.8 | 2.8 | 0.0 |
| Pal (Mars Inc) | 4.0 | 3.0 | 2.4 | 2.2 | 2.1 | 2.0 | −12.9 |
| Private Label | 8.6 | 8.3 | 8.3 | 8.3 | 8.4 | 8.4 | −0.5 |
| Others | 35.8 | 37.1 | 37.5 | 33.1 | 33.1 | 33.1 | −1.6 |
|
Source: Euromonitor International, 2022 *CAGR: Compound Annual Growth Rate N/C: Not calculable |
|||||||
Market segmentation
Dog food
Growth in the sales of dog food in recent years have been driven by rising pet populations, rising prices of dog food, and increased consumer concern for the wellbeing of their pets. During the pandemic, growth in the sales of dog food spiked significantly, despite growth in the pet population slowing noticeably. Growth in the pet population has been driven by rising urbanization and dropping fertility rates, as families have fewer kids and are more open to purchasing a dog. The financial insecurity of the pandemic has caused many Mexicans to hold off on expensive purchases like dogs, especially families that have never owned a dog before. Families that are accustomed to having at least one dog around are more resilient in their purchasing habits. Meanwhile, the pandemic has significantly increased the time spent at home, causing some people to buy dogs for this reason.
Consumers are increasingly attentive to the well-being and health of their pets, and some are willing to pay more for better quality food. Younger Mexicans in particular are more likely to pay a premium for products that are perceived as healthier. Consumers are increasingly willing to pay for products that contain higher protein content, grain free content, while raw protein food also gains popularity. Time spent at home bonding with pets and trends toward their humanization have also resulted in a rise in popularity of dog treats.
However, ongoing economic insecurity means many others are also increasingly cash strapped and interested in cheaper brands. In spite of this, many consumers have been forced to pay more by rising prices. During the pandemic supply shortages have pushed prices up, fuelling spending growth.
In 2021, retails sales of dog food totalled US$2.1 billion, the vast majority of which were sales of dry dog food. Dry dog food sales totalled US$ 1.9 billion, or 89.2% of the dog food market. Mid-priced dry dog food was the category which saw the highest retail sales, at US$0.8 billion, followed by economy dry dog food at US$0.7 billion, while premium dry dog food trailed with US$0.4 billion. The wet dog food category saw US$0.1 billion in sales, 82.1% of which were mid-priced wet dog food. Dog treats and mixes also saw total retail sales of US$0.1 billion.
From 2021-2026, wet dog food is expected to see the fastest growth rate Growing at a CAGR of 10.8% over the forecast period. Growth is forecast to be particularly mid priced wet dog food at a CAGR of 10.9%, followed closely by premium wet dog food at 10.7%. Dog treats and mixes is expected to enjoy a strong growth rate of 10.6%. Among the dry dog food categories that make up the majority of the market, premium dry dog food is expected to grow the fastest, at a CAGR of 10.3%, while economy food grows at 9.6% and mid-priced dog food lags behind. Over the 2021-2022 year, dog treats and mixes are set to enjoy the fastest year-over-year growth, followed by premium wet and dry dog food.
| Category | 2016 | 2017 | 2018 | 2019 | 2020 | 2021 |
|---|---|---|---|---|---|---|
| Dog Food Total | 1362.3 | 1460.4 | 1572.9 | 1688.7 | 1887.2 | 2107.4 |
| Dry Dog Food | 1222.7 | 1308.1 | 1407.5 | 1509.3 | 1687.3 | 1880.5 |
| Economy Dry Dog Food | 424 | 446.7 | 487.6 | 521.9 | 586.4 | 654.7 |
| Mid-Priced Dry Dog Food | 560 | 594.9 | 624.0 | 662.7 | 736.3 | 815.8 |
| Premium Dry Dog Food | 238.7 | 266.6 | 296 | 324.8 | 364.7 | 410.0 |
| Wet Dog Food | 89.2 | 97.1 | 105.7 | 115.6 | 127.5 | 143.5 |
| Economy Wet Dog Food | 1.6 | 1.7 | 1.8 | 1.9 | 2 | 2.1 |
| Mid-Priced Wet Dog Food | 73.4 | 79.9 | 86.9 | 95.1 | 104.7 | 117.8 |
| Premium Wet Dog Food | 14.1 | 15.6 | 16.9 | 18.6 | 20.8 | 23.6 |
| Dog Treats and Mixers | 50.4 | 55.1 | 59.7 | 63.7 | 72.4 | 83.4 |
| Source: Euromonitor International, 2022 | ||||||
| Category | Annual growth % 2020-2021 | CAGR* % 2016-2021 | Total growth % 2016-2021 |
|---|---|---|---|
| Dog Food Total | 11.7 | 9.1 | 54.7 |
| Dry Dog Food | 11.5 | 9.0 | 53.8 |
| Economy Dry Dog Food | 11.6 | 9.1 | 54.4 |
| Mid-Priced Dry Dog Food | 10.8 | 7.8 | 45.7 |
| Premium Dry Dog Food | 12.4 | 11.4 | 71.8 |
| Wet Dog Food | 12.5 | 10.0 | 60.9 |
| Economy Wet Dog Food | 5.0 | 5.6 | 31.3 |
| Mid-Priced Wet Dog Food | 12.5 | 9.9 | 60.5 |
| Premium Wet Dog Food | 13.5 | 10.9 | 67.4 |
| Dog Treats and Mixers | 15.2 | 10.6 | 65.5 |
|
Source: Euromonitor International, 2022 *CAGR: Compound Annual Growth Rate |
|||
| Category | 2022 | 2023 | 2024 | 2025 | 2026 |
|---|---|---|---|---|---|
| Dog Food Total | 2323.4 | 2564.8 | 2805.4 | 3056 | 3318.1 |
| Dry Dog Food | 2071 | 2284 | 2494.9 | 2713.3 | 2940.2 |
| Economy Dry Dog Food | 722.6 | 798.3 | 873.8 | 952.0 | 1033.9 |
| Mid-Priced Dry Dog Food | 891.9 | 978.4 | 1061.9 | 1148.4 | 1237.1 |
| Premium Dry Dog Food | 456.5 | 507.2 | 559.3 | 612.8 | 669.1 |
| Wet Dog Food | 158.9 | 176.7 | 195.7 | 216.6 | 239.9 |
| Economy Wet Dog Food | 2.2 | 2.4 | 2.5 | 2.7 | 2.9 |
| Mid-Priced Wet Dog Food | 130.4 | 145.1 | 160.8 | 178.3 | 197.8 |
| Premium Wet Dog Food | 26.3 | 29.3 | 32.3 | 35.6 | 39.2 |
| Dog Treats and Mixers | 93.5 | 104.1 | 114.8 | 126.2 | 138.1 |
| Source: Euromonitor International, 2022 | |||||
| Category | Annual growth % 2021-2022 | CAGR* % 2021-2026 | Total growth % 2021-2026 |
|---|---|---|---|
| Dog Food Total | 10.2 | 9.5 | 57.4 |
| Dry Dog Food | 10.1 | 9.4 | 56.4 |
| Economy Dry Dog Food | 10.4 | 9.6 | 57.9 |
| Mid-Priced Dry Dog Food | 9.3 | 8.7 | 51.6 |
| Premium Dry Dog Food | 11.3 | 10.3 | 63.2 |
| Wet Dog Food | 10.7 | 10.8 | 67.2 |
| Economy Wet Dog Food | 4.8 | 6.7 | 38.1 |
| Mid-Priced Wet Dog Food | 10.7 | 10.9 | 67.9 |
| Premium Wet Dog Food | 11.4 | 10.7 | 66.1 |
| Dog Treats and Mixers | 12.1 | 10.6 | 65.6 |
|
Source: Euromonitor International, 2022 *CAGR: Compound Annual Growth Rate |
|||
In 2021 the Mexican dog food market was notably more fragmented than the cat food market. Mars Inc had a 31.0% market share in 2021, down from 37.4% in 2016. The second largest player, Nestlé SA, saw its market share rise from 23.4% in 2016-2021. The third largest player, Archer Daniels Midland Co, did not have retail value recorded prior to 2019, however by 2021 its sales accounted for 8.2% of the market.
| Company | 2016 | 2017 | 2018 | 2019 | 2020 | 2021 | CAGR* % 2016-2021 |
|---|---|---|---|---|---|---|---|
| Total | 100.0 | 100.0 | 100.0 | 100.0 | 100.0 | 100.0 | 0.0 |
| Mars Inc | 37.4 | 34.4 | 32.3 | 31.4 | 31.1 | 31.0 | −3.7 |
| Nestlé SA | 23.4 | 23.7 | 24.9 | 25.3 | 25.2 | 25.2 | 1.5 |
| Archer Daniels Midland Co | 8.0 | 8.2 | 8.2 | N/C | |||
| Nueva Tecnología en Alimentación SA de CV | 4.3 | 4.7 | 4.8 | 4.8 | 4.9 | 4.9 | 2.6 |
| Colgate-Palmolive Co | 1.9 | 2.0 | 2.0 | 2.0 | 2.1 | 2.1 | 2.0 |
| Industrias Bachoco SAB de CV Actions | 1.4 | 1.5 | 1.6 | 1.6 | 1.5 | N/C | |
| Cargill Inc | 0.7 | 0.7 | 0.6 | 0.6 | 0.6 | 0.6 | −3.0 |
| Diamond Feeds Inc | 0.4 | 0.4 | 0.4 | 0.4 | 0.4 | 0.4 | 0.0 |
| Bukeye Feed Mills | 0.4 | 0.4 | 0.4 | 0.4 | 0.4 | 0.3 | −5.6 |
| Nature's Variety Inc | 0.2 | 0.3 | 0.3 | 0.3 | N/C | ||
| Private Label | 10.2 | 9.8 | 9.9 | 9.9 | 10.0 | 10.0 | −0.4 |
| Others | 21.3 | 22.5 | 23.0 | 15.3 | 15.2 | 15.5 | −6.2 |
|
Source: Euromonitor International, 2022 *CAGR: Compound Annual Growth Rate N/C: Not calculable |
|||||||
Cat food
Growth in the cat food sector has been driven mostly by the growth in the cat population. Sales growth of cat food did spike noticeably during the pandemic, but not as much as dog food. Increasing urbanization is driving demand for cats, as cats require less space than most dogs. Meanwhile, cats can accommodate busier lifestyles of their owners, as they do not need to be walked regularly and can forage for food on their own. Cats are also less expensive to maintain, making them an appealing time during economic uncertainty.
Prices are increasing across all categories of cat food due to supply shortages and inflation. Meanwhile, cat owners are being increasingly driven by trends towards humanization and increasing attention to health and wellbeing. Products that have rich or diverse flavors are gaining popularity, along with wet cat food where meat and vegetable ingredients are visible to the naked eye, as this comes with the perception of being less processed. Cat treats are gaining popularity, especially products that contain nutrients and vitamins. Meanwhile, products containing functional ingredients are also popular. Dry cat food continues to dominate the market, with key selling points being its benefits for oral health, as well as convenience and lack of mess. Cat owners are becoming more interested in being able to choose from a variety of options, as well as specialized products perceived as being beneficial for their pet's individual needs.
In 2021 total retail sales of cat food in Mexico were US$0.5 billion, including US$0.4 billion in sales of dry cat food, or 79.5% of the cat food market. Mid-priced dry cat food saw the greatest retail sales, accounting for 63.0% of the dry market and exactly 50.0% of the total cat food market. Economy dry cat food was the next largest category, followed closely by premium dry cat food. Wet cat food accounted for 16.4% of the cat food market and was led by mid-priced wet cat food. Premium wet cat food trailed behind, while the presence of economy wet cat food was negligible.
From 2016-2021, economy dry cat food saw by far the fastest growth rate and is forecast to eclipse the entire wet cat food market in value by 2023. From 2016-2021, economy dry cat food grew at a CAGR of 14.2% and is forecast to grow at a CAGR of 13.1% from 2021-2026. Wet cat food grew slightly faster than dry cat food from 2016-2021, however from 2021-2026 dry cat food is expected to maintain its current growth rate, while wet food decelerates.
| Category | 2016 | 2017 | 2018 | 2019 | 2020 | 2021 |
|---|---|---|---|---|---|---|
| Cat Food Total | 289.5 | 317.7 | 351.2 | 385.1 | 431.3 | 488.9 |
| Dry Cat Food | 229.6 | 249.7 | 275.4 | 303.2 | 341.3 | 388.6 |
| Economy Dry Cat Food | 39.7 | 42.8 | 50.1 | 58.0 | 66.3 | 77.0 |
| Mid-Priced Dry Cat Food | 151.2 | 163.6 | 176.0 | 191.3 | 215.1 | 244.5 |
| Premium Dry Cat Food | 38.7 | 43.2 | 49.3 | 53.9 | 59.8 | 67.1 |
| Wet Cat Food | 47.1 | 53.7 | 60.2 | 65.2 | 71.9 | 80.2 |
| Economy Wet Cat Food | ||||||
| Mid-Priced Wet Cat Food | 30.7 | 34.7 | 38.9 | 42.3 | 46.8 | 52.5 |
| Premium Wet Cat Food | 16.4 | 18.9 | 21.3 | 22.9 | 25.1 | 27.7 |
| Cat Treats and Mixers | 12.8 | 14.4 | 15.6 | 16.7 | 18.2 | 20.1 |
| Source: Euromonitor International, 2022 | ||||||
| Category | Annual growth % 2020-2021 | CAGR* % 2016-2021 | Total growth % 2016-2021 |
|---|---|---|---|
| Cat Food Total | 13.4 | 11.0 | 68.9 |
| Dry Cat Food | 13.9 | 11.1 | 69.3 |
| Economy Dry Cat Food | 16.1 | 14.2 | 94.0 |
| Mid-Priced Dry Cat Food | 13.7 | 10.1 | 61.7 |
| Premium Dry Cat Food | 12.2 | 11.6 | 73.4 |
| Wet Cat Food | 11.5 | 11.2 | 70.3 |
| Economy Wet Cat Food | |||
| Mid-Priced Wet Cat Food | 12.2 | 11.3 | 71.0 |
| Premium Wet Cat Food | 10.4 | 11.1 | 68.9 |
| Cat Treats and Mixers | 10.4 | 9.4 | 57.0 |
|
Source: Euromonitor International, 2022 *CAGR: Compound Annual Growth Rate |
|||
| Category | 2022 | 2023 | 2024 | 2025 | 2026 |
|---|---|---|---|---|---|
| Cat Food Total | 545.4 | 607.7 | 672.2 | 740.9 | 814.9 |
| Dry Cat Food | 435.0 | 485.7 | 538.2 | 593.9 | 653.8 |
| Economy Dry Cat Food | 87.4 | 99.7 | 112.7 | 126.9 | 142.5 |
| Mid-Priced Dry Cat Food | 273.5 | 304.2 | 335.7 | 369.2 | 405.1 |
| Premium Dry Cat Food | 74.1 | 81.8 | 89.7 | 97.8 | 106.3 |
| Wet Cat Food | 88.3 | 97.3 | 106.5 | 116.2 | 126.6 |
| Economy Wet Cat Food | |||||
| Mid-Priced Wet Cat Food | 58.0 | 63.9 | 69.9 | 76.0 | 82.4 |
| Premium Wet Cat Food | 30.3 | 33.3 | 36.6 | 40.2 | 44.1 |
| Cat Treats and Mixers | 22.1 | 24.7 | 27.6 | 30.9 | 34.5 |
| Source: Euromonitor International, 2022 | |||||
| Category | Annual growth % 2021-2022 | CAGR* % 2021-2026 | Total growth % 2021-2026 |
|---|---|---|---|
| Cat Food Total | 11.6 | 10.8 | 66.7 |
| Dry Cat Food | 11.9 | 11.0 | 68.2 |
| Economy Dry Cat Food | 13.5 | 13.1 | 85.1 |
| Mid-Priced Dry Cat Food | 11.9 | 10.6 | 65.7 |
| Premium Dry Cat Food | 10.4 | 9.6 | 58.4 |
| Wet Cat Food | 10.1 | 9.6 | 57.9 |
| Economy Wet Cat Food | |||
| Mid-Priced Wet Cat Food | 10.5 | 9.4 | 57.0 |
| Premium Wet Cat Food | 9.4 | 9.7 | 59.2 |
| Cat Treats and Mixers | 10.0 | 11.4 | 71.6 |
|
Source: Euromonitor International, 2022 *CAGR: Compound Annual Growth Rate |
|||
In 2021 the cat food was relatively consolidated, with the largest player, Mars Inc, holding a 45.7% market share. This share was down notably from 49.3% in 2016. Nestlé SA meanwhile saw its value share rise slightly from 15.8% in 2016 to 16.3%. Archer Daniels Midland Co had a 9.8% value share in 2021, slightly above its value share for dog food. Notably, the share of the market which is held by private labels has been rising from 1.5% in 2016 to 1.9% in 2021. Although the private label segment remains relatively small, competition in this sector is intensifying as consumers turn to private labels for affordable prices.
| Company | 2016 | 2017 | 2018 | 2019 | 2020 | 2021 | CAGR* % 2016-2021 |
|---|---|---|---|---|---|---|---|
| Total | 100.0 | 100.0 | 100.0 | 100.0 | 100.0 | 100.0 | 0.0 |
| Mars Inc | 49.3 | 47.9 | 46.5 | 45.8 | 45.7 | 45.7 | −1.5 |
| Nestlé SA | 15.8 | 16.1 | 16.0 | 16.2 | 16.3 | 16.3 | 0.6 |
| Archer Daniels Midland Co | 9.4 | 9.6 | 9.8 | N/C | |||
| Colgate-Palmolive Co | 3.5 | 3.7 | 3.7 | 3.6 | 3.5 | 3.4 | −0.6 |
| Diamond Feeds Inc | 0.2 | 0.2 | 0.2 | 0.2 | 0.2 | 0.2 | 0.0 |
| Grupo Conocido SA de CV | 0.0 | 0.1 | 0.1 | 0.2 | N/C | ||
| Midwestern Pet Foods Inc | 0.1 | 0.0 | 0.0 | 0.0 | 0.0 | 0.0 | −100.0 |
| Neovia | 8.0 | 8.3 | 8.8 | N/C | |||
| Private Label | 1.5 | 1.6 | 1.7 | 1.7 | 1.9 | 1.9 | 4.8 |
| Others | 21.7 | 22.3 | 23.2 | 23.0 | 22.7 | 22.6 | 0.8 |
|
Source: Euromonitor International, 2022 *CAGR: Compound Annual Growth Rate N/C: Not calculable |
|||||||
Other pet food
As other pet categories experience relatively sluggish population growth, retails sales of other pet food are set to experience more modest growth rates than dog and cat food. However, as with dog and cat food, other pet food is seeing sales benefit from increasing consumer attention to health and wellness. Specialized products are becoming increasingly mainstream, while products with functional ingredients gain traction. For small mammals more emphasis is being placed on food that is natural and grain free, as well as products that are fortified with vitamins, probiotics, or omega-3. The interest in more specialized products has been supported by the pandemic-induced explosion in e-commerce, which allows consumers to shop online for a greater selection of products than would be available in most stores or shops.
In addition, the relatively modest expenses associated with other pets make them popular for those with strained finances. Overall, the other pet food category saw year-over-year sales growth nearly double with the advent of the pandemic and has remained elevated into 2022. Small mammals are gaining popularity due to their budget friendliness, while being perceived as more interactive and interesting than fish and reptiles. Despite this, sales of small mammal food remains an extremely small portion of the overall market.
In 2021, the other pet food market remained small, with total retail sales of US$33.7 million. 54.3% of total other pet food retail sales were of fish food, while 38.9% were bird food and 6.8% were small mammal/reptile food. This category is also set to grow relatively slowly compared to dog and cat food in the coming years, however unlike dog and cat food its growth rate is accelerating.
Small mammal/reptile food is the category which enjoyed the fastest growth from 2016-2021 and is expected to see the fastest growth from 2021-2026. The category grew at a CAGR of 5.0% from 2016-2021, and is expected to grow at a CAGR of 6.8% from 2021-2026. Fish food grew at a CAGR of 4.5% from 2016-2021, a rate that is forecast to accelerate to 6.1% from 2016-2021. Bird food, meanwhile, grew the slowest from 2016-2021 at a CAGR of 3.6%, and is also the only other pet food category forecast to see its growth slow in the coming years. The category is forecast to see growth drop to a CAGR of 3.2% from 2021-2026.
| Category | 2016 | 2017 | 2018 | 2019 | 2020 | 2021 |
|---|---|---|---|---|---|---|
| Other Pet Food | 27.5 | 28.5 | 29.4 | 30.2 | 31.8 | 33.7 |
| Bird Food | 11.0 | 11.4 | 11.8 | 12.1 | 12.5 | 13.1 |
| Fish Food | 14.7 | 15.2 | 15.6 | 16.1 | 17.1 | 18.3 |
| Small Mammal/Reptile Food | 1.8 | 1.9 | 2.0 | 2.0 | 2.2 | 2.3 |
| Source: Euromonitor International, 2022 | ||||||
| Category | Annual growth % 2020-2021 | CAGR* % 2016-2021 | Total growth % 2016-2021 |
|---|---|---|---|
| Other Pet Food | 6.0 | 4.2 | 22.5 |
| Bird Food | 4.8 | 3.6 | 19.1 |
| Fish Food | 7.0 | 4.5 | 24.5 |
| Small Mammal/Reptile Food | 4.5 | 5.0 | 27.8 |
|
Source: Euromonitor International, 202 *CAGR: Compound Annual Growth Rate |
|||
| Category | 2022 | 2023 | 2024 | 2025 | 2026 |
|---|---|---|---|---|---|
| Other Pet Food | 35.8 | 37.7 | 39.5 | 41.2 | 43.1 |
| Bird Food | 13.7 | 14.1 | 14.5 | 14.9 | 15.3 |
| Fish Food | 19.6 | 20.9 | 22.1 | 23.3 | 24.6 |
| Small Mammal/Reptile Food | 2.5 | 2.7 | 2.9 | 3.0 | 3.2 |
| Source: Euromonitor International, 2022 | |||||
| Category | Annual growth % 2021-2022 | CAGR* % 2021-2026 | Total growth % 2021-2026 |
|---|---|---|---|
| Other Pet Food | 6.2 | 5.0 | 27.9 |
| Bird Food | 4.6 | 3.2 | 16.8 |
| Fish Food | 7.1 | 6.1 | 34.4 |
| Small Mammal/Reptile Food | 8.7 | 6.8 | 39.1 |
|
Source: Euromonitor International, 2022 *CAGR: Compound Annual Growth Rate |
|||
The market for other pet food was lead by Unicharm Corp, which held a 12.7% value share in 2021. This was very narrowly ahead of Tetra Perez SA de CV, which also had a 12.7% market share in 2021, up significantly from only 4.7% in 2016. The company saw its value share almost triple from 2016-2017, and since then has maintained a relatively constant value share since. The rest of the market is held by smaller players. The multinational giant Mars Inc which is the clear leader in sales of dog and cat food does have a presence in sales of other pet food, however it is relatively modes at only a 4.2% value share in 2021.
| Company | 2016 | 2017 | 2018 | 2019 | 2020 | 2021 | CAGR* % 2016-2021 |
|---|---|---|---|---|---|---|---|
| Total | 100.0 | 100.0 | 100.0 |
100.0 |
100.0 | 100.0 | 0.0 |
| Unicharm Corp | 12.3 | 12.1 | 12.3 | 12.4 | 12.6 | 12.7 | 0.6 |
| Tetra Perez SA de CV | 4.7 | 12.7 | 12.5 | 12.5 | 12.6 | 12.7 | 22.0 |
| Central Garden & Pet Co | 7.5 | 7.7 | 7.9% | 8.0 | 7.9 | 7.8 | 0.8 |
| Empacadora La Merced SA de CV | 8.1 | 8.1 | 8.1 | 8.0 | 7.9 | 7.8 | −0.8 |
| Spectrum Brands Holdings Inc | 11.2 | 6.4 | 6.5 | 6.6 | 6.7 | 6.8 | −9.5 |
| Digrans SA de CV | 4.6 | 4.6 | 4.6 | 4.7 | 4.6 | 4.5 | −0.4 |
| Mars Inc | 4.2 | 4.2 | 4.3 | 4.3 | 4.2 | 4.2 | 0.0 |
| Private Label | 3.6 | 3.6 | 3.6 | 3.6 | 3.5 | 3.5 | −0.6 |
| Others | 43.9 | 40.4 | 40.2 | 40.0 | 40.0 | 40.0 | −1.8 |
|
Source: Euromonitor International, 2022 *CAGR: Compound Annual Growth Rate N/C: Not calculable |
|||||||
Distribution channels
In 2021, the vast majority of pet food sales took place through store-based retailing, which accounted for 91.6% of pet food sales, while grocery retailers specifically accounted for 70.5% of the pet food market. Grocery retailers were even more popular among cat owners, with the category accounting for 75.7% of total sales. Traditional grocery retailers were the most popular subcategory, accounting for 39.2% of the market in 2021, and 45.4% of the cat food market.
Hypermarkets were the modern grocery retailer outlet with the most sales, accounting for 13.1% of pet food sales, and 18.1% of cat food sales. Supermarkets were also popular among cat owners than dog owners. Discounters meanwhile were relatively popular among dog owners, where it accounted for 9.1% of the dog food market, while for sales of cat food they had only a 3.8% market share. Convenience stores, which accounted for 5.7% of pet food sales, also saw lower demand among cat owners, accounting for only 2.5% of cat food sales. Mixed retailers accounted for 7.2% of the pet food market in 2021, as well as 8.1% of dog food sales and 3.4% of cat food sales. Pet shops accounted for 12.5% of the total pet food market, and 70.0% of retail sales of other pet food.
Traditional grocery retailers saw their overall market share decline among both dog and cat owners from 2016-2021, while modern grocery retailers grew slightly, driven by supermarkets and hypermarkets. Mixed retailers and non-grocery specialists both saw declines, while e-commerce saw fast growth. However, e-commerce remains a relatively small proportion of the overall market, at 3.8% in 2021. More remarkably, its market share actually fell slightly year-over-ear from 2020-2021, dropping from 3.9% to 3.8%.
| Channel | 2016 | 2017 | 2018 | 2019 | 2020 | 2021 | CAGR* % 2016-2021 |
|---|---|---|---|---|---|---|---|
| Distribution channel (total) | 100.0 | 100.0 | 100.0 | 100.0 | 100.0 | 100.0 | 0.0 |
| Store-Based Retailing | 92.9 | 92.4 | 92.5 | 92.5 | 91.7 | 91.6 | −0.3 |
| Grocery Retailers | 71.4 | 70.9 | 71.0 | 70.9 | 70.7 | 70.5 | −0.3 |
| Modern Grocery Retailers | 30.1 | 29.9 | 30.0 | 30.0 | 32.2 | 31.3 | 0.8 |
| Convenience Stores | 5.9 | 5.8 | 5.8 | 5.8 | 5.7 | 5.7 | −0.7 |
| Discounters | 7.9 | 7.8 | 7.8 | 7.7 | 8.2 | 8.0 | 0.3 |
| Hypermarkets | 12.4 | 12.4 | 12.5 | 12.6 | 13.5 | 13.1 | 1.1 |
| Supermarkets | 3.9 | 3.9 | 3.9 | 3.9 | 4.8 | 4.4 | 2.4 |
| Traditional Grocery Retailers | 41.3 | 41.0 | 40.9 | 40.9 | 38.5 | 39.2 | −1.0 |
| Mixed Retailers | 7.3 | 7.2 | 7.2 | 7.2 | 7.2 | 7.2 | −0.3 |
| Department Stores | 0.5 | 0.5 | 0.5 | 0.5 | 0.3 | 0.4 | −4.4 |
| Warehouse Clubs | 6.8 | 6.7 | 6.7 | 6.8 | 6.8 | 6.8 | 0.0 |
| Non-Grocery Specialists | 14.3 | 14.3 | 14.4 | 14.4 | 13.9 | 13.9 | −0.6 |
| Pet superstores | 1.4 | 1.4 | 1.5 | 1.5 | 1.4 | 1.5 | 1.4 |
| Pet shops | 12.9 | 12.9 | 12.9 | 12.9 | 12.4 | 12.5 | −0.6 |
| Other non-grocery specialists | 0.0 | 0.0 | N/C | ||||
| Non-Store Retailing | 1.0 | 1.3 | 1.7 | 2.1 | 3.9 | 3.8 | 30.6 |
| E-Commerce | 1.0 | 1.3 | 1.7 | 2.1 | 3.9 | 3.8 | 30.6 |
| Non-retail channels | 6.1 | 6.3 | 5.7 | 5.4 | 4.4 | 4.7 | −5.1 |
| Veterinary clinics | 6.1 | 6.3 | 5.7 | 5.4 | 4.4 | 4.7 | −5.1 |
|
Source: Euromonitor International, 2022 *CAGR: Compound Annual Growth Rate N/C: Not calculable |
|||||||
Trade overview
Global imports
Globally, the market for pet food increased at a CAGR if 12.8% from 2016-2021, with total imports reaching a value of US$20.6 billion in 2021. The largest markets were Germany with imports of US$2.0 billion (9.6% market share), the United States with imports of US$1.5 billion (7.5% market share) and Poland with imports of US$1.1 billion (5.6% market share).
Mexico was a relatively small pet food market, ranking twenty-seventh for total pet food imports in 2021. Total imports were US$204.5 million, representing 1.0% of the global market. Total pet food imports grew at a CAGR of 13.0% from 2016-2021, slightly above the global average. Total imports grew slowly from 2016-2020, and then spiked in 2020. Growth from 2016-2020 occurred at a CAGR of 7.6%, and year-over-year growth from 2020-2021 was 37.3%.
| Country | 2016 | 2017 | 2018 | 2019 | 2020 | 2021 | CAGR* % 2016-2021 | Market share % 2021 |
|---|---|---|---|---|---|---|---|---|
| World (total) | 11,288.4 | 12,826.7 | 14,093.0 | 14,999.7 | 17,578.6 | 20,569.4 | 12.8 | 100.0 |
| Germany | 1,079.0 | 1,349.7 | 1,466.6 | 1,515.4 | 1,685.3 | 1,975.1 | 12.9 | 9.6 |
| United States | 783.6 | 847.0 | 986.4 | 1,032.0 | 1,236.7 | 1,540.4 | 14.5 | 7.5 |
| Poland | 214.3 | 440.4 | 570.6 | 695.8 | 989.3 | 1,149.7 | 39.9 | 5.6 |
| United Kingdom | 741.2 | 845.8 | 880.8 | 928.9 | 1,007.2 | 1,122.9 | 8.7 | 5.5 |
| Canada (5) | 621.4 | 668.7 | 683.2 | 799.9 | 898.2 | 1,064.1 | 11.4 | 5.2 |
| France | 653.8 | 684.4 | 702.4 | 720.9 | 903.2 | 1,054.8 | 10.0 | 5.1 |
| Italy | 572.3 | 617.2 | 633.9 | 681.7 | 708.8 | 852.7 | 8.3 | 4.1 |
| Netherlands | 480.4 | 537.2 | 638.3 | 611.0 | 700.1 | 782.1 | 10.2 | 3.8 |
| Belgium | 558.0 | 598.0 | 518.0 | 528.6 | 675.8 | 748.3 | 6.0 | 3.6 |
| Japan | 641.6 | 619.4 | 644.0 | 646.8 | 674.4 | 702.7 | 1.8 | 3.4 |
| Mexico (27) | 110.9 | 124.9 | 121.3 | 141.6 | 148.9 | 204.5 | 13.0 | 1.0 |
|
Source: Global Trade Tracker, 2022 *CAGR: Compound Annual Growth Rate |
||||||||
Mexican imports
The Mexican market for imports of pet food is very consolidated, with the United States and Canada dominating the market. According to Global Trade Tracker, in 2021, the three largest suppliers of pet food to Mexico were The United States, which hold a 67.4% market share, Canada with a 23.1% market share, and France with a 5.4% market share. Together these three countries held a 95.9% market share, while Canada and the United States alone had a 90.5% market share. The majority of remaining Mexican imports of the year came from sources which were unspecified by Global Trade tracker. Canadian exports of pet food to Mexico dropped from 2016-2018, partially recovered in 2019, and then grew quickly from 2019-2021.
In 2021 Canada was Mexico's primary supplier of canary seed with a 93.0% market share, with the remainder of Mexico's imports originating from the United States. Canada was Mexico's second largest supplier of dog and cat food, far behind the United States and slightly ahead of France. The United States accounted for 89.6% of Mexico's dog and cat food imports, followed by Canada at 4.9% and France at 4.6%.
| Country | 2016 | 2017 | 2018 | 2019 | 2020 | 2021 | CAGR* % 2016-2021 | Market share % 2021 |
|---|---|---|---|---|---|---|---|---|
| World (total) | 110.9 | 125.0 | 121.2 | 141.6 | 148.9 | 204.5 | 13.0 | 100.0 |
| United States | 75.1 | 89.3 | 90.3 | 104.0 | 101.5 | 137.9 | 12.9 | 67.4 |
| Canada (2) | 34.0 | 34.0 | 29.1 | 32.4 | 41.2 | 47.3 | 6.8 | 23.1 |
| France | 0.7 | 0.9 | 1.3 | 4.4 | 5.5 | 11.1 | 73.8 | 5.4 |
| Netherlands | 0.6 | 0.7 | 0.5 | 0.7 | 0.5 | 1.1 | 12.9 | 0.5 |
| Viet-Nam | 0.0 | 0.0 | 0.0 | 0.0 | 0.1 | 0.1 | N/C | 0.1 |
| Chile | 0.0 | 0.0 | 0.0 | 0.1 | 0.1 | 0.1 | N/C | 0.1 |
| Countries and territories not specified | 0.0 | 0.0 | 0.0 | 0.0 | 0.0 | 6.9 | N/C | 3.4 |
|
Source: Global Trade Tracker, 2022 *CAGR: Compound Annual Growth Rate N/C: Not calculable |
||||||||
Mexican import requirements
Mexico requires that all pet food products imported into Mexico be registered with the Mexican animal health authorities (SENASICA) before import. Canary seed is required to be free of weed seeds and is inspected upon arrival. If no weed seeds are found, the shipment can proceed. If found to have fewer than 15 weed seeds per kilogram, the shipment will be re-cleaned at a facility approved by the Mexican animal health authorities. If more than 15 weed seeds are found per kilogram, the shipment is rejected.
Canada's performance
In 2021, Canada was Mexico's second largest supplier of pet food, with a 23.1% market share, according to Mexican import data. Canada exported US$47.3 million worth of pet food to Mexico in 2021, totalling 45.5 million kilograms. Canada was Mexico's primary supplier of canary seed and canary seed was Canada's primary pet food export to Mexico, accounting for 60.2% of Canada's pet food exports to Mexico. Dog and cat food accounted for the remaining 39.8% of Canada's exports to Mexico.
| HS code | Description | Import value (US$) | Import volume (kg) | Market share % |
|---|---|---|---|---|
| Pet food total | 47,317,237 | 45,486,126 | 100.0 | |
| 100830 | Canary seed | 28,496,071 | 37,741,996 | 60.2 |
| 230910 | Dog or cat food | 18,821,166 | 7,744,130 | 39.8 |
| Source: Global Trade Tracker, 2022 | ||||
According to Canadian export data, in 2021 Saskatchewan was the leading exporter of pet food to Mexico, followed by Ontario. Saskatchewan was responsible for nearly all of Canada's canary seed exports to Mexico, while Ontario was responsible for nearly all of Canada's dog and cat food exports to Mexico.
| HS code | Description | Import value (US$) | Import volume (kg) | Top provincial suppliers and market value share % | ||
|---|---|---|---|---|---|---|
| Pet food total | 40,275,540 | 49,092,360 | Saskatchewan (76.5%) | Ontario (21.9%) | Manitoba (0.6%) | |
| 100830 | Canary seed | 31,214,905 | 44,843,764 | Saskatchewan (98.8%) | Ontario (0.8%) | Alberta (0.4%) |
| 230910 | Dog or cat food | 9,060,634 | 4,248,596 | Ontario (97.4%) | New Brunswick (2.6%) | N/A |
|
Source: Global Trade Tracker, 2022 N/A: Not applicable |
||||||
Product launch analysis
According to Mintel's Global New Products Database (GNPD), the total number of new pet food product launches in Mexico from January of 2016 to December of 2021 was 898. The top subcategory was Dog snacks and treats, with 337 total launches (37.5% of total launches). Dry dog food accounted for 191 launches (21.3% of the total) followed by wet cat food with 152 launches (16.9% of total launches). The top claims were food for adult pets with 431 claims (48.0% of total launches), fortified by vitamins or minerals with 279 total claims (31.1% of total launches), and other functional pet claims with 254 total launches (with 28.3% of the total.)
69.8% of product launches were below $4.04 in price, and 88.6% of product launches were below US$8.04. 70.4% of products were imported, 24.4% were imported and 5.2% were unspecified. Flexible packaging was the most popular type, accounting for 41.4% of launches, followed by flexible stand up ouch with 39.6%. Top launch types were new variety or range extension, which accounted for 34.3% of the total, new packaging which accounted for 26.8%, and new product which accounted for 25.4%.
The most common flavour was unflavoured/plain, however this category has seen its number of annual product launches drop steadily over the last 5 years at a CAGR of 9.1%. The next most common flavours were chicken and beef. The majority of new product launches had food acids, vitamin E, and salt as a flavour, at 64.1%, 61.2% and 57.9% respectively.
| Product attributes | Yearly launch counts | Total | |||||
|---|---|---|---|---|---|---|---|
| 2016 | 2017 | 2018 | 2019 | 2020 | 2021 | ||
| Yearly product launches | 146 | 158 | 118 | 150 | 163 | 163 | 898 |
| Top subcategories | |||||||
| Dog Snacks and Treats | 62 | 50 | 52 | 47 | 73 | 53 | 337 |
| Dog Food Dry | 24 | 47 | 37 | 38 | 28 | 17 | 191 |
| Cat Food Wet | 39 | 27 | 3 | 28 | 20 | 35 | 152 |
| Dog Food Wet | 8 | 21 | 15 | 27 | 30 | 35 | 136 |
| Cat Food Dry | 9 | 9 | 9 | 9 | 10 | 17 | 63 |
| Top claims | |||||||
| Pet - Adult | 77 | 86 | 48 | 62 | 69 | 89 | 431 |
| Vitamin/Mineral Fortified | 12 | 35 | 40 | 78 | 56 | 58 | 279 |
| Other (Functional Pet) | 31 | 45 | 49 | 53 | 49 | 27 | 254 |
| Teeth and Tartar Prevention (Functional Pet) | 37 | 42 | 45 | 49 | 50 | 28 | 251 |
| No Additives/Preservatives | 19 | 36 | 18 | 40 | 45 | 74 | 232 |
| Top price groupings (US dollars) | |||||||
| 0.05 - 4.04 | 121 | 102 | 76 | 97 | 115 | 116 | 627 |
| 4.05 - 8.04 | 19 | 26 | 17 | 36 | 35 | 36 | 169 |
| 8.05 - 12.04 | 5 | 7 | 8 | 7 | 9 | 7 | 43 |
| 12.05 - 16.04 | 1 | 5 | 13 | 8 | 3 | 3 | 33 |
| 16.05 - 24.00 | 0 | 15 | 4 | 1 | 0 | 1 | 21 |
| Imported status | |||||||
| Not imported | 87 | 83 | 84 | 115 | 131 | 132 | 632 |
| Imported | 50 | 63 | 26 | 28 | 27 | 25 | 219 |
| Top packaged types | |||||||
| Flexible | 53 | 82 | 64 | 65 | 53 | 55 | 372 |
| Flexible stand-up pouch | 59 | 38 | 28 | 60 | 81 | 90 | 356 |
| Can | 23 | 28 | 8 | 6 | 15 | 8 | 88 |
| Flexible sachet | 5 | 2 | 6 | 7 | 3 | 0 | 23 |
| Skinpack | 0 | 2 | 2 | 4 | 7 | 0 | 15 |
| Top launch types | |||||||
| New Variety/Range Extension | 54 | 53 | 44 | 54 | 55 | 48 | 308 |
| New Packaging | 47 | 43 | 21 | 30 | 40 | 60 | 241 |
| New Product | 29 | 41 | 38 | 45 | 38 | 37 | 228 |
| Relaunch | 15 | 18 | 11 | 17 | 24 | 18 | 103 |
| New Formulation | 1 | 3 | 4 | 4 | 6 | 0 | 18 |
| Top flavours (including blend) | |||||||
| Unflavoured / Plain | 42 | 51 | 39 | 39 | 28 | 26 | 225 |
| Chicken | 14 | 24 | 11 | 18 | 31 | 24 | 122 |
| Beef | 9 | 12 | 14 | 8 | 17 | 21 | 81 |
| Meat | 2 | 5 | 8 | 7 | 10 | 7 | 39 |
| Salmon | 10 | 7 | 4 | 4 | 1 | 8 | 34 |
| Top ingredients | |||||||
| Food Acids | 96 | 110 | 69 | 74 | 104 | 123 | 576 |
| Vitamin E (Food) | 85 | 98 | 61 | 105 | 98 | 103 | 550 |
| Salt (Food) | 81 | 86 | 61 | 100 | 103 | 89 | 520 |
| Vitamin A (Food) | 71 | 81 | 54 | 83 | 72 | 71 | 432 |
| Vitamins (Food) | 48 | 57 | 46 | 87 | 83 | 79 | 400 |
Examples of new products
Chicken and Fish Cat Food
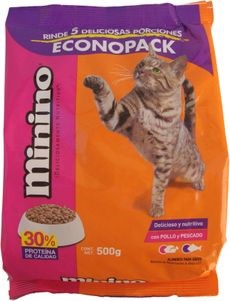
Source: Mintel, 2022
| Company | Malta Texo de Mexico |
|---|---|
| Brand | Mino |
| Category | Pet food |
| Sub-category | Cat food dry |
| Market | Mexico |
| Import status | Not imported |
| Store type | Supermarket |
| Date published | November 2022 |
| Launch type | Relaunch |
| Price in US dollars | 2.15 ($0.43 per 100 grams) |
This economy product retails in a new 500 gram pack containing 5 servings, and advertises itself as 30% protein and containing taurine, and various vitamins and minerals. This products describes itself as suitable for all cat breeds and ages.
Adult Dog Food

Source: Mintel, 2022
| Company | Nueva Tecnologia en Alimentación |
|---|---|
| Brand | Nucan by Nupec |
| Category | Pet food |
| Sub-category | Dog food dry |
| Market | Mexico |
| Import status | Not imported |
| Store type | Supermarket |
| Date published | November 2022 |
| Launch type | New packaging |
| Price in US dollars | 3.33 ($0.19 per 100 grams) |
This is intended for adult dogs with little exercise, and claims to be nutritional, tasty, and affordable. The product was repackaged for the 2022 FIFA world cup, and the pack has a competition to travel to the World Cup.
Adult Small Breeds Dogs Beef Flavor Fillets
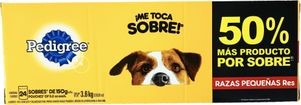
Source: Mintel, 2022
| Company | Effem |
|---|---|
| Brand | Pedigree |
| Category | Pet food |
| Sub-category | Dog food dry |
| Market | Mexico |
| Import status | Not imported |
| Store type | Club store |
| Date published | October 2022 |
| Launch type | New packaging |
| Price in US dollars | 14.03 ($0.39 per 100 grams) |
This product intended for adult dogs from small breeds now retails in a 3.6 kilogram package containing 24 150 gram servings. The product claims to be complete, balanced, have natural ingredients, as well as being fortified with immune supporting vitamin E. The product also claims the absence of any artificial flavours or preservatives, in addition to being a source of protein, omega 6 and zinc.
Dehydrated Beef Liver Treats

Source: Mintel, 2022
| Company | Felipe Romo Morales |
|---|---|
| Brand | Mitz Meals |
| Category | Pet food |
| Sub-category | Dog snacks and treats |
| Market | Mexico |
| Import status | Not imported |
| Store type | Supermarket |
| Date published | October 2022 |
| Launch type | New packaging |
| Price in US dollars | 2.49 ($3.83 per 100 grams) |
This product has been repackaged, and now retails in a 65 gram package. These dog treats are claimed to be natural, gluten free, hypoallergenic, as well as rich in protein, vitamins and minerals.
Chicken and Meat Bites
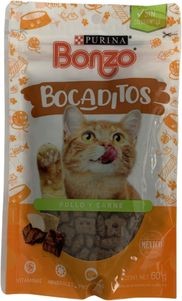
Source: Mintel, 2022
| Company | Nestlé |
|---|---|
| Brand | Purina Bonzo |
| Category | Pet food |
| Sub-category | Cat snacks and treats |
| Market | Mexico |
| Import status | Not imported |
| Store type | Specialist retailer |
| Date published | September 2022 |
| Launch type | New product |
| Price in US dollars | 2.11 ($3.52 per 100 grams) |
This product now retails in a 60 gram pack and claims to be suitable as a treat for adult cats. This product claims to be free from colorants, and rich in vitamins, minerals, and proteins.
For more information
The Canadian Trade Commissioner Service:
International Trade Commissioners can provide Canadian industry with on-the-ground expertise regarding market potential, current conditions and local business contacts, and are an excellent point of contact for export advice.
More agri-food market intelligence:
International agri-food market intelligence
Discover global agriculture and food opportunities, the complete library of Global Analysis reports, market trends and forecasts, and information on Canada's free trade agreements.
Agri-food market intelligence service
Canadian agri-food and seafood businesses can take advantage of a customized service of reports and analysis, and join our email subscription service to have the latest reports delivered directly to their inbox.
More on Canada's agriculture and agri-food sectors:
Canada's agriculture sectors
Information on the agriculture industry by sector. Data on international markets. Initiatives to support awareness of the industry in Canada. How the department engages with the industry.
Resources
- Euromonitor International
- Country Report; Pet care in Mexico, June 2022
- Country Report; Dog food in Mexico, June 2022
- Country Report; Cat food in Mexico, June 2022
- Country Report; Other pet food in Mexico, June 2022
- Agriculture and Agri-food Canada, Outline of opportunities in Mexico, May 2020
- Global Trade Tracker, 2022
- Mintel Global New Products Database, 2022
Sector Trend Analysis – Pet food trends in Mexico
Global Analysis Report
Prepared by: Brendan Dwyer, Student (co-op)
© His Majesty the King in Right of Canada, represented by the Minister of Agriculture and Agri-Food (2023).
Photo credits
All photographs reproduced in this publication are used by permission of the rights holders.
All images, unless otherwise noted, are copyright His Majesty the King in Right of Canada.
To join our distribution list or to suggest additional report topics or markets, please contact:
Agriculture and Agri-Food Canada, Global Analysis1341 Baseline Rd, Tower 5, 3rd floor
Ottawa ON K1A 0C5
Canada
Email: aafc.mas-sam.aac@agr.gc.ca
The Government of Canada has prepared this report based on primary and secondary sources of information. Although every effort has been made to ensure that the information is accurate, Agriculture and Agri-Food Canada (AAFC) assumes no liability for any actions taken based on the information contained herein.
Reproduction or redistribution of this document, in whole or in part, must include acknowledgement of agriculture and agri-food Canada as the owner of the copyright in the document, through a reference citing AAFC, the title of the document and the year. Where the reproduction or redistribution includes data from this document, it must also include an acknowledgement of the specific data source(s), as noted in this document.
Agriculture and Agri-Food Canada provides this document and other report services to agriculture and food industry clients free of charge.