

Note: This report includes forecasting data that is based on baseline historical data.
Executive summary
The major pet food importers are located in Western Europe and North America, and Japan. Canada was the fifth-largest importer of dog and cat food, reaching US$1.3 billion in 2023. South Korea was the twenty-first largest importer of pet food, reaching US$307.5 million in 2023.
South Korea has a diverse supply network of pet food providers. China, the United States (US) and Thailand were the largest suppliers of pet food to South Korea in 2023 with values of US$100.2 million (32.6% market share), US$48.8 million (15.9% market share) and US$37.6 million (12.2% market share) respectively. Canada as South Korea's fifth largest pet food supplier, experienced an increase in compound annual growth rate (CAGR) of 5.4% as pet food values grew from US$18.7 million in 2019 to US$23.1 million in 2023.
In 2023, Canada ranked the tenth-largest exporter of dog and cat food in the world, exporting US$713.2 million worth of dog and cat food to the world, a 3.1% share of the total global exports of dog and cat food.
South Korea, ranked the sixth-largest importer from Canada, received 3.0% (US$21.3 million) of Canadian dog and cat food exports in 2023 with a 6.6% CAGR from 2019 to 2023.
In 2023, the global pet food market was worth US$134.0 billion retail value. South Korea was ranked the fourteenth-largest market in the world, reaching US$1.5 billion in 2023, representing an increase by a CAGR of 11.3% (2018 to 2023).
Current value sales of cat food grow by 18.0% (CAGR, 2018 to 2023) to US$614.6 million. Mid-Priced Wet Cat Food had the best performance most dynamic category in 2023 with a CAGR of 31.5% from 2018 to 2023.
The retail sales of dog food reached US$875.6 million in 2023, at a CAGR of 7.6% from 2018 to 2023. Premium wet dog food had the best performance in 2023 with a CAGR of 15.1% from 2018 to 2023, reaching US$183.5 million in 2023.
While overall pet food is expected to reach sales of nearly US$1.5 billion in South Korea in 2023, other pet food only accounts for less than 1.5% of this total.
Trade overview
Global imports
The major pet food importers are located in Western Europe and North America, and Japan. Canada was the fifth-largest importer of dog and cat food, reaching US$1.3 billion in 2023. South Korea was the twenty-first largest importer of pet food, reaching US$307.5 million in 2023.
| Country | 2019 | 2020 | 2021 | 2022 | 2023 | CAGR* % 2019-2023 | Share % in 2023 |
|---|---|---|---|---|---|---|---|
| World | 15,006.5 | 17,603.3 | 20,731.9 | 22,722.8 | 23,370.7 | 11.7 | 100.0 |
| Germany | 1,514.7 | 1,684.4 | 1,993.7 | 2,098.6 | 2,425.4 | 12.5 | 10.4 |
| United States | 1,027.9 | 1,231.8 | 1,533.2 | 2,161.1 | 1,711.3 | 13.6 | 7.3 |
| United Kingdom | 890.8 | 975.6 | 1,122.7 | 1,364.8 | 1,649.2 | 16.7 | 7.1 |
| Poland | 695.5 | 988.3 | 1,149.2 | 1,140.4 | 1,398.8 | 19.1 | 6.0 |
| Canada | 799.9 | 898.1 | 1,064.3 | 1,258.6 | 1,329.9 | 13.6 | 5.7 |
| France | 719.9 | 902.0 | 1,054.1 | 918.1 | 1,193.4 | 13.5 | 5.1 |
| Italy | 677.4 | 705.0 | 847.8 | 912.6 | 901.9 | 10.4 | 3.9 |
| Belgium | 513.0 | 658.9 | 730.6 | 829.6 | 880.2 | 14.5 | 3.8 |
| Netherlands | 610.7 | 699.2 | 782.4 | 785.1 | 861.9 | 9.0 | 3.7 |
| Japan | 646.1 | 673.7 | 701.7 | 752.9 | 724.2 | 2.9 | 3.1 |
| South Korea 21 | 242.0 | 270.7 | 308.5 | 347.3 | 307.5 | 6.2 | 1.3 |
|
Source: Global Trade Tracker, 2024 *CAGR: compound annual growth rate HS Code: 230910 |
|||||||
South Korea imports
South Korea has a diverse supply network of pet food providers. China, US and Thailand were the largest suppliers of pet food to South Korea in 2023 with values of US$100.2 million (32.6% market share), US$48.8 million (15.9% market share) and US$37.6 million (12.2% market share) respectively. Canada as South Korea's fifth largest pet food supplier, experienced an increase in CAGR of 5.4% as pet food values grew from US$18.7 million in 2019 to US$23.1 million in 2023.
| 2019 | 2020 | 2021 | 2022 | 2023 | CAGR* % 2019-2023 | Market share % 2023 | |
|---|---|---|---|---|---|---|---|
| World | 242.0 | 270.7 | 308.6 | 347.1 | 307.3 | 6.2 | 100.0 |
| China | 73.1 | 84.0 | 89.1 | 103.5 | 100.2 | 8.2 | 32.6 |
| United States | 55.1 | 61.0 | 63.7 | 74.2 | 48.8 | −3.0 | 15.9 |
| Thailand | 26.9 | 33.0 | 39.6 | 44.7 | 37.6 | 8.7 | 12.2 |
| Japan | 15.5 | 18.2 | 21.0 | 19.8 | 23.1 | 10.5 | 7.5 |
| Canada | 18.7 | 18.1 | 26.6 | 32.8 | 23.1 | 5.4 | 7.5 |
| France | 14.7 | 10.0 | 11.3 | 14.3 | 16.2 | 2.5 | 5.3 |
| Australia | 8.1 | 9.3 | 10.4 | 12.2 | 10.7 | 7.2 | 3.5 |
| United Kingdom | 7.6 | 10.6 | 12.8 | 8.6 | 8.8 | 3.7 | 2.9 |
| New Zealand | 5.0 | 4.5 | 6.7 | 7.1 | 6.3 | 6.0 | 2.1 |
| Austria | 2.2 | 2.8 | 3.9 | 6.4 | 5.9 | 28.0 | 1.9 |
|
Source: Global Trade Tracker, 2024 *CAGR: compound annual growth rate HS Code: 230910 |
|||||||
Canada's performance
In 2023, Canada ranked the tenth-largest exporter of dog and cat food in the world, exporting US$713.2 million worth of dog and cat food to the world, a 3.1% share of the total global exports of dog and cat food.
South Korea, ranked the sixth-largest importer from Canada, received 3.0% (US$21.3 million) of Canadian dog and cat food exports in 2023 with a 6.6% CAGR from 2019 to 2023.
| Country | 2019 | 2020 | 2021 | 2022 | 2023 | CAGR* % 2019-2023 | Share % in 2023 |
|---|---|---|---|---|---|---|---|
| World | 598.7 | 754.2 | 844.2 | 790.4 | 713.2 | 4.5 | 100.0 |
| United States | 248.5 | 293.4 | 333.7 | 378.0 | 408.9 | 13.3 | 57.3 |
| China | 84.5 | 172.5 | 182.0 | 89.9 | 37.3 | −18.5 | 5.2 |
| Netherlands | 12.6 | 12.6 | 20.3 | 20.9 | 23.7 | 17.1 | 3.3 |
| Japan | 17.2 | 16.7 | 21.5 | 18.1 | 23.2 | 7.8 | 3.3 |
| Spain | 13.8 | 14.2 | 19.3 | 25.4 | 21.7 | 12. 0 | 3.0 |
| Korea | 16.5 | 17.9 | 29.2 | 28.0 | 21.3 | 6.6 | 3.0 |
| Taiwan | 14.6 | 14.5 | 14.9 | 24.2 | 21.0 | 9.6 | 2.9 |
| New Zealand | 15.9 | 16.1 | 17.2 | 15.9 | 18.0 | 3.1 | 2.5 |
| Italy | 8.2 | 8.8 | 10.8 | 13.1 | 13.7 | 13.6 | 1.9 |
| Poland | 9.2 | 8.7 | 12.0 | 11.7 | 12.6 | 8.0 | 1.8 |
|
Source: Global Trade Tracker, 2024 *CAGR: compound annual growth rate HS Code: 230910 |
|||||||
Ontario accounted for 47.9% (US$10.2 million) of the value of pet food exports to South Korea in 2023 followed by Alberta at 41.0% (US$8.7 million).
| Province | Export value US$ | Export volume (kg) | Share among provinces, % of value |
|---|---|---|---|
| Canada | 21,321,322 | 8,080,297 | 100.00 |
| Ontario | 10,219,038 | 2,710,695 | 47.9 |
| Alberta | 8,738,849 | 4,354,091 | 41.0 |
| New Brunswick | 879,475 | 449,339 | 4.1 |
| Quebec | 848,914 | 312,875 | 4.0 |
| British Columbia | 560,917 | 230,900 | 2.6 |
| Manitoba | 74,129 | 22,397 | 0.3 |
|
Source: Global Trade Tracker, 2024 *CAGR: compound annual growth rate HS Code: 230910 |
|||
Given the expected growth of the pet food market in South Korea, Canadian producers have an opportunity to expand their exports and products within the South Korean pet food sector. However, due to South Korea's strict import requirements, including regarding raw materials derived from ruminants, Canadian suppliers are encouraged to work closely with their importers and local partners to ensure their products meet all import requirements before shipping.
Pet food market overview
In 2023, the global pet food market was worth US$134.0 billion retail value. South Korea was ranked the fourteenth-largest market in the world, reaching US$1.5 billion in 2023, representing an increase by a CAGR of 11.3% (2018-2023). The pet food retail sales in South Korea are expected to grow to US$2.1 billion in 2028 at a CAGR of 6.9% from 2023 to 2028.
| Geography | 2018 | 2023 | CAGR* % 2018-2023 | 2024 | 2028 | CAGR* % 2023-2028 |
|---|---|---|---|---|---|---|
| World | 84,437.5 | 134,025.7 | 9.7 | 144,182.5 | 185,040.2 | 6.7 |
| United States | 33,393.7 | 53,232.3 | 9.8 | 55,820.1 | 68,223.6 | 5.1 |
| Brazil | 3,650.1 | 8,008.5 | 17.0 | 9,040.6 | 13,131.7 | 10.4 |
| China | 3,852.6 | 7,637.2 | 14.7 | 8,499.6 | 11,901.1 | 9.3 |
| United Kingdom | 4,468.0 | 5,451.8 | 4.1 | 5,682.4 | 6,435.2 | 3.4 |
| Russia | 2,344.9 | 4,621.8 | 14.5 | 5,080.5 | 6,891.6 | 8.3 |
| Germany | 3,562.9 | 4,508.0 | 4.8 | 4,752.8 | 5,517.0 | 4.1 |
| Canada | 2,959.5 | 4,401.3 | 8.3 | 4,679.1 | 5,869.2 | 5.9 |
| France | 3,581.0 | 4,400.2 | 4.2 | 4,589.8 | 5,258.1 | 3.6 |
| Japan | 3,527.8 | 4,240.9 | 3.8 | 4,347.9 | 4,820.5 | 2.6 |
| Italy | 2,615.7 | 3,357.3 | 5.1 | 3,546.6 | 4,199.1 | 4.6 |
| South Korea 14th | 884.7 | 1,513.2 | 11.3 | 1,634.1 | 2,113.2 | 6.9 |
|
Source: Euromonitor International, 2024 *CAGR: Compound Annual Growth Rate |
||||||
Pet humanization
Consumers are increasingly treating their cats as family members, and are willing to spend more on their nutrition and wellbeing. This trend has led to an increase in demand for premium cat food that is made from high-quality, natural ingredients and does not contain any artificial flavours, colours, or preservatives. As a result, cat food brands are focusing on developing premium products that meet the demands of consumers. The trends towards pet humanization and premiumization are expected to continue in the future, coming in different shapes and forms, such as human-like food and customized pet technology, providing an opportunity for cat food brands to capture significant share (Euromonitor International, 2023).
Premiumization
With the pet humanization trend, cat food is becoming more premium, and foods specifically for healthcare and functionality are increasing rapidly. Royal Canin offers customised nutrition solutions for different cats based on their condition and their breed. In terms of local brands, Dongwon F&B introduced the Dish series, which uses the same ingredients as human food, while Harim Pet Food's freeze-dried brand The Real offers various products based on human-grade ingredients and functional needs. Harim's The Real Raw product costs as much as KRW47,000 for a 360g pack, making it one of the most expensive pet food brands in South Korea. (Euromonitor International, 2023).
Convenience stores and general merchandise stores potential distribution channels
South Korea has a culture of feeding stray outdoor cats. From small children to adults, many people buy treats or food to feed outdoor cats. Unless they also raise indoor cats, and/or feed outdoor cats daily, it is rare that they buy cat food either online or at a physical store in bulk. For those who like cats but do not raise one at home, convenience stores and general merchandise stores could be a convenient and affordable option to buy treats for outdoor cats (Euromonitor International, 2023
Pet population and ownership
The pet population in South Korea has increased at a CAGR of 5.5% from 5.9 million pets in 2018 to 7.8 million pets in 2023. The pet population is forecast to increase by a CAGR of 6.9% as the pet population is expected to decline to 10.9 million pets by 2028. In 2023, cats and dogs accounted for 62.2% of the pet population while other pets accounted for 37.8%. The cat and dog populations will reach 1.9 million and 3.6 million respectively in 2028. Cat grew much faster than dog at a CAGR of 8.8% and 1.7% respectively from 2018 to 2023. Other pet grew fast too at a CAGR of 9.3% 2018-2023.
Small mammal and reptile increased significantly at the CAGR of 44.3% and 49.8% respectively from 2018 to 2023.
| Category | 2018 | 2023 | CAGR* % 2018-2023 | 2024 | 2028 | CAGR* % 2023-2028 |
|---|---|---|---|---|---|---|
| Pet population | 5,973.4 | 7,813.6 | 5.5 | 8,510.7 | 10,891.0 | 6.9 |
| Cat | 994.3 | 1,512.7 | 8.8 | 1,570.9 | 1,853.5 | 4.1 |
| Dog (total) | 3,086.3 | 3,350.0 | 1.7 | 3,383.0 | 3,580.9 | 1.3 |
| Small dogs (up to 20 pounds or 9 kilograms) | 2,320.6 | 2,375.1 | 0.5 | 2,385.0 | 2,474.4 | 0.8 |
| Medium dogs (20 to 50 pounds or 9 to 23 kilograms) | 430.4 | 569.5 | 5.8 | 585.3 | 655.3 | 2.8 |
| Large dogs (over 50 pounds or over 23 kilograms) | 335.3 | 405.4 | 3.9 | 412.7 | 451.2 | 2.2 |
| Other pet (total) | 1,892.7 | 2,950.9 | 9.3 | 3,556.8 | 5,456.6 | 13.1 |
| Bird | 7.3 | 9.3 | 5.0 | 9.6 | 11.7 | 4.7 |
| Fish | 1,810.2 | 2,450.1 | 6.2 | 2,794.2 | 4,011.2 | 10.4 |
| Small mammal/reptile (total) | 75.2 | 491.5 | 45.6 | 753.0 | 1,433.7 | 23.9 |
| Small mammal | 59.2 | 370.1 | 44.3 | 570.0 | 1,099.6 | 24.3 |
| Reptile | 16.1 | 121.4 | 49.8 | 183.0 | 334.1 | 22.4 |
|
Source: Euromonitor International, 2024 *CAGR: Compound Annual Growth Rate |
||||||
South Korea's dog ownership experienced a 2.3% increase in CAGR from 2.4 million households in 2018 to 2.7 million households in 2023. The corresponding percentage of those households owning dogs increased from 11.5% in 2018 to 12.0% in 2023. The number of households owning cats increased from 0.6 million in 2018 to 0.9 million in 2023 representing an increase in the percentage of those same households owning cats from 2.8% to 4.2% in the same period.
| Category | 2018 | 2019 | 2020 | 2021 | 2022 | 2023 | CAGR* % 2018-2023 |
|---|---|---|---|---|---|---|---|
| % Households owning a cat | 2.8 | 3.3 | 3.4 | 3.7 | 4.0 | 4.2 | 8.4 |
| Households owning a cat | 570.9 | 687.1 | 730.3 | 804.9 | 869.1 | 928.0 | 10.2 |
| % Households owning a dog | 11.5 | 11.6 | 11.7 | 11.9 | 12.0 | 12.0 | 0.9 |
| Households owning a dog | 2,387.6 | 2,452.5 | 2,513.2 | 2,588.9 | 2,640.4 | 2,670.5 | 2.3 |
|
Source: Euromonitor International, 2024 *CAGR: Compound Annual Growth Rate |
|||||||
Market segmentation
Cat food
Current value sales of cat food grow by 18.0% (CAGR, 2018 to 2023) to US$614.6 million. Mid-Priced Wet Cat Food had the best performance most dynamic category in 2023 with a CAGR of 31.5% from 2018 to 2023.
South Korea customers spent US$365.7 million on dry cat food and US$136.6 million on wet cat food in 2023. They spent more money buying premium dry cat food (US$210.8 million in 2023) than mid-priced (US$43.6 million) and economy dry food (US$111.2 million). And they also spent more money buying premium wet cat food (US$82.4 million in 2023) than mid-priced (US$54.3 million).
| Category | 2018 | 2019 | 2020 | 2021 | 2022 | 2023 |
|---|---|---|---|---|---|---|
| Cat Food (total) | 269.0 | 326.3 | 393.1 | 476.8 | 550.9 | 614.8 |
| Cat Treats and Mixers | 42.7 | 60.6 | 73.3 | 85.8 | 98.7 | 112.5 |
| Dry Cat Food | 187.1 | 217.8 | 250.1 | 297.2 | 334.6 | 365.7 |
| Economy Dry Cat Food | 66.4 | 72.7 | 79.2 | 90.3 | 101.1 | 111.2 |
| Mid-Priced Dry Cat Food | 29.3 | 31.8 | 34.6 | 39.5 | 41.8 | 43.6 |
| Premium Dry Cat Food | 91.5 | 113.3 | 136.4 | 167.4 | 191.7 | 210.8 |
| Wet Cat Food | 39.1 | 47.9 | 69.6 | 93.8 | 117.6 | 136.6 |
| Economy Wet Cat Food | ||||||
| Mid-Priced Wet Cat Food | 13.8 | 18.6 | 27.5 | 35.0 | 46.0 | 54.3 |
| Premium Wet Cat Food | 25.3 | 29.3 | 42.1 | 58.8 | 71.6 | 82.4 |
|
Source: Euromonitor International, 2024 *CAGR: Compound Annual Growth Rate |
||||||
| Category | Annual growth % 2022-2023 | CAGR* % 2018-2023 | Total growth % 2018-2023 |
|---|---|---|---|
| Cat Food (total) | 11.6 | 18.0 | 128.6 |
| Cat Treats and Mixers | 14.0 | 21.4 | 163.5 |
| Dry Cat Food | 9.3 | 14.3 | 95.5 |
| Economy Dry Cat Food | 10.0 | 10.9 | 67.5 |
| Mid-Priced Dry Cat Food | 4.3 | 8.3 | 48.8 |
| Premium Dry Cat Food | 10.0 | 18.2 | 130.4 |
| Wet Cat Food | 16.2 | 28.4 | 249.4 |
| Economy Wet Cat Food | |||
| Mid-Priced Wet Cat Food | 18.0 | 31.5 | 293.5 |
| Premium Wet Cat Food | 15.1 | 26.6 | 225.7 |
|
Source: Euromonitor International, 2024 *CAGR: Compound Annual Growth Rate |
|||
Retail sales of cat food will continue to grow throughout 2023-2028 with an expected CAGR of 9.1%, achieving US$950.7 million by 2028. Premium Wet Cat Food will experience the highest CAGR of 14.0% while Mid-Priced Dry Cat Food will experience the lowest CAGR of 4.3% in the forecast period.
Dry Cat Food will continue to lead cat food categories at US$520.2 million, representing 54.7% of the total cat food in 2028.
| Category | 2023 | 2024 | 2025 | 2026 | 2027 | 2028 |
|---|---|---|---|---|---|---|
| Cat Food | 614.8 | 688.0 | 759.9 | 828.2 | 897.7 | 950.7 |
| Cat Treats and Mixers | 112.5 | 126.0 | 139.9 | 153.9 | 167.7 | 179.4 |
| Dry Cat Food | 365.7 | 402.7 | 438.1 | 469.3 | 501.7 | 520.2 |
| Economy Dry Cat Food | 111.2 | 121.2 | 130.9 | 140.1 | 149.6 | 155.2 |
| Mid-Priced Dry Cat Food | 43.6 | 46.4 | 48.7 | 50.5 | 52.3 | 53.9 |
| Premium Dry Cat Food | 210.8 | 235.1 | 258.5 | 278.6 | 299.8 | 311.0 |
| Wet Cat Food | 136.6 | 159.3 | 182.0 | 205.1 | 228.3 | 251.1 |
| Economy Wet Cat Food | ||||||
| Mid-Priced Wet Cat Food | 54.3 | 63.3 | 71.5 | 79.3 | 86.3 | 92.1 |
| Premium Wet Cat Food | 82.4 | 96.0 | 110.4 | 125.8 | 142.1 | 159.0 |
|
Source: Euromonitor International, 2024 *CAGR: Compound Annual Growth Rate |
||||||
| Category | Annual growth % 2023-2024 | CAGR* % 2023-2028 | Total growth % 2023-2028 |
|---|---|---|---|
| Cat Food (total) | 5.9 | 9.1 | 54.6 |
| Cat Treats and Mixers | 7.0 | 9.8 | 59.5 |
| Dry Cat Food | 3.7 | 7.3 | 42.2 |
| Economy Dry Cat Food | 3.7 | 6.9 | 39.6 |
| Mid-Priced Dry Cat Food | 3.1 | 4.3 | 23.6 |
| Premium Dry Cat Food | 3.7 | 8.1 | 47.5 |
| Wet Cat Food | 10.0 | 12.9 | 83.8 |
| Economy Wet Cat Food | |||
| Mid-Priced Wet Cat Food | 6.7 | 11.1 | 69.6 |
| Premium Wet Cat Food | 11.9 | 14.0 | 93.0 |
|
Source: Euromonitor International, 2024 *CAGR: Compound Annual Growth Rate |
|||
Dog food
High inflation rates severely affected dog food in 2022, and this has continued in 2023. Many dog food brands have increased their retail prices by 10-20%, as every cost involved in producing dog food, such as raw materials and shipping, has increased rapidly, having a knock-on impact on prices. With higher prices, consumers have started to look for different ways to minimise their expenses. For instance, they have started to more actively look for discount deals, both online and in physical stores. Thus, economy dry dog food is set to see stronger current value growth than mid-priced and premium dry dog food in 2023 (Euromonitor International, 2023).
The retail sales of dog food reached US$875.6 million in 2023, at a CAGR of 7.6% from 2018 to 2023. Premium wet dog food had the best performance in 2023 with a CAGR of 15.1% from 2018 to 2023, reaching US$183.5 million in 2023. Premium dry food led the sales of dry dog food (US$331.9 million in 2023) with a 6.2% CAGR from 2018 to 2023.
| Category | 2018 | 2019 | 2020 | 2021 | 2022 | 2023 |
|---|---|---|---|---|---|---|
| Dog Food (total) | 608.2 | 664.7 | 725.5 | 798.4 | 855.2 | 875.5 |
| Dog Treats and Mixers | 95.7 | 112.9 | 120.8 | 130.4 | 140.0 | 144.2 |
| Dry Dog Food | 411.3 | 446.8 | 476.2 | 509.2 | 536.1 | 537.1 |
| Economy Dry Dog Food | 110.1 | 113.4 | 119.0 | 117.9 | 124.9 | 131.2 |
| Mid-Priced Dry Dog Food | 55.8 | 58.6 | 60.3 | 66.4 | 72.5 | 74.0 |
| Premium Dry Dog Food | 245.4 | 274.8 | 296.8 | 325.0 | 338.7 | 331.9 |
| Wet Dog Food | 101.3 | 105.0 | 128.6 | 158.7 | 179.0 | 194.3 |
| Economy Wet Dog Food | ||||||
| Mid-Priced Wet Dog Food | 10.2 | 10.6 | 11.4 | 12.2 | 10.6 | 10.8 |
| Premium Wet Dog Food | 91.0 | 94.5 | 117.1 | 146.4 | 168.4 | 183.5 |
|
Source: Euromonitor International, 2024 *CAGR: Compound Annual Growth Rate |
||||||
| Category | Annual growth % 2022-2023 | CAGR* % 2018-2023 | Total growth % 2018-2023 |
|---|---|---|---|
| Dog Food (total) | 2.4 | 7.6 | 43.9 |
| Dog Treats and Mixers | 3.0 | 8.5 | 50.7 |
| Dry Dog Food | 0.2 | 5.5 | 30.6 |
| Economy Dry Dog Food | 5.0 | 3.6 | 19.2 |
| Mid-Priced Dry Dog Food | 2.1 | 5.8 | 32.6 |
| Premium Dry Dog Food | −2.0 | 6.2 | 35.2 |
| Wet Dog Food | 8.5 | 13.9 | 91.8 |
| Economy Wet Dog Food | |||
| Mid-Priced Wet Dog Food | 1.9 | 1.1 | 5.9 |
| Premium Wet Dog Food | 9.0 | 15.1 | 101.6 |
|
Source: Euromonitor International, 2024 *CAGR: Compound Annual Growth Rate |
|||
Retail sales of dog food will recover throughout 2023-2028 with an expected CAGR of 4.5%, achieving US$1.1 billion by 2028. Retail sales of Premium Wet Dog Food will experience the highest CAGR of 7.5% while Mid-Priced Dry dog food will experience the lowest CAGR of 0.9% in the forecast period. It is forecast that premium dry food will continue to lead the sales in dry dog food (US$410.4 million in 2028) with a 4.3% CAGR from 2023 to 2028 while premium wet dog food (US$263.0 million in 2028) will continue to lead the wet dog food with a 7.5% CAGR from 2023 to 2028.
| Category | 2023 | 2024 | 2025 | 2026 | 2027 | 2028 |
|---|---|---|---|---|---|---|
| Dog Food (total) | 875.5 | 921.9 | 963.9 | 1,003.2 | 1,046.7 | 1,091.7 |
| Dog Treats and Mixers | 144.2 | 151.5 | 157.9 | 163.6 | 170.1 | 175.6 |
| Dry Dog Food | 537.1 | 557.4 | 577.1 | 595.4 | 616.9 | 640.3 |
| Economy Dry Dog Food | 131.2 | 138.2 | 144.0 | 147.0 | 149.9 | 152.6 |
| Mid-Priced Dry Dog Food | 74.0 | 74.5 | 74.9 | 75.4 | 76.3 | 77.3 |
| Premium Dry Dog Food | 331.9 | 344.6 | 358.2 | 373.1 | 390.8 | 410.4 |
| Wet Dog Food | 194.3 | 213.1 | 229.0 | 244.1 | 259.7 | 275.8 |
| Economy Wet Dog Food | ||||||
| Mid-Priced Wet Dog Food | 10.8 | 11.0 | 11.4 | 11.8 | 12.2 | 12.8 |
| Premium Wet Dog Food | 183.5 | 202.0 | 217.6 | 232.4 | 247.4 | 263.0 |
|
Source: Euromonitor International, 2024 *CAGR: Compound Annual Growth Rate |
||||||
| Category | Annual growth % 2023-2024 | CAGR* % 2023-2028 | Total growth % 2023-2028 |
|---|---|---|---|
| Dog Food (total) | 4.3 | 4.5 | 24.7 |
| Dog Treats and Mixers | 3.2 | 4.0 | 21.8 |
| Dry Dog Food | 3.8 | 3.6 | 19.2 |
| Economy Dry Dog Food | 1.8 | 3.1 | 16.3 |
| Mid-Priced Dry Dog Food | 1.3 | 0.9 | 4.5 |
| Premium Dry Dog Food | 5.0 | 4.3 | 23.7 |
| Wet Dog Food | 6.2 | 7.3 | 41.9 |
| Economy Wet Dog Food | |||
| Mid-Priced Wet Dog Food | 4.9 | 3.5 | 18.5 |
| Premium Wet Dog Food | 6.3 | 7.5 | 43.3 |
|
Source: Euromonitor International, 2024 *CAGR: Compound Annual Growth Rate |
|||
Other pet food
While overall pet food is expected to reach sales of nearly US$1.5 billion in South Korea in 2023, other pet food only accounts for less than 1.5% of this total. This shows that dog and cat food still overwhelmingly dominate, and other pet food holds only a fraction of sales.
Retail sales of other pet food increased at a CAGR of 25.0% from US$7.5 million in 2018 to US$22.9 million in 2023 and is expected to recover at a CAGR of 4.9% reaching US$29.1 million by 2028.
Small mammal/reptile food was the largest category of other pet food in absolute value terms with retail sales of US$15.2 million (66.4% market share) in 2023, increasing to 43.5% in CAGR from retail sales of US$2.5 million in 2018. Retail sales of small mammal/reptile food is expected to increase in CAGR by 4.5% to US$18.9 million by 2028.
During the 2018-2023 period, retail sales of fish food experienced the increase in CAGR of 9.5% from US$4.0 million in 2018. Retail sales of fish food are forecast to recover by a CAGR of 6.2% backing to US$8.5 million by 2028.
Retail sales of bird food increased at a CAGR of 7.0% from US$1.0 million in 2018 to US$1.4 million in 2023 and is expected to recover at a CAGR of 4.0% reaching US$1.7 million by 2028.
| Category | 2018 | 2019 | 2020 | 2021 | 2022 | 2023 |
|---|---|---|---|---|---|---|
| Pet Food | 884.7 | 998.9 | 1,128.5 | 1,288.4 | 1,427.7 | 1,513.2 |
| Dog and Cat Food | 877.1 | 991.0 | 1,118.7 | 1,275.1 | 1,406.1 | 1,490.4 |
| Other Pet Food | 7.5 | 7.8 | 9.9 | 13.3 | 21.6 | 22.9 |
| Bird Food | 1.0 | 1.1 | 1.2 | 1.3 | 1.3 | 1.4 |
| Fish Food | 4.0 | 4.1 | 4.9 | 5.6 | 6.0 | 6.3 |
| Small Mammal/Reptile Food | 2.5 | 2.6 | 3.8 | 6.4 | 14.3 | 15.2 |
|
Source: Euromonitor International, 2024 *CAGR: Compound Annual Growth Rate |
||||||
| Category | Annual growth % 2022-2023 | CAGR* % 2018-2023 | Total growth % 2018-2023 |
|---|---|---|---|
| Pet Food | 6.0 | 11.3 | 71.0 |
| Dog and Cat Food | 6.0 | 11.2 | 69.9 |
| Other Pet Food | 6.0 | 25.0 | 205.3 |
| Bird Food | 7.7 | 7.0 | 40.0 |
| Fish Food | 5.0 | 9.5 | 57.5 |
| Small Mammal/Reptile Food | 6.3 | 43.5 | 508.0 |
|
Source: Euromonitor International, 2024 *CAGR: Compound Annual Growth Rate |
|||
| Category | 2023 | 2024 | 2025 | 2026 | 2027 | 2028 |
|---|---|---|---|---|---|---|
| Pet Food | 1,513.2 | 1,634.1 | 1,749.3 | 1,858.1 | 1,972.4 | 2,071.5 |
| Dog and Cat Food | 1,490.4 | 1,609.9 | 1,723.9 | 1,831.4 | 1,944.4 | 2,042.4 |
| Other Pet Food | 22.9 | 24.2 | 25.5 | 26.7 | 27.9 | 29.1 |
| Bird Food | 1.4 | 1.4 | 1.5 | 1.6 | 1.6 | 1.7 |
| Fish Food | 6.3 | 6.8 | 7.2 | 7.6 | 8.1 | 8.5 |
| Small Mammal/Reptile Food | 15.2 | 16.0 | 16.8 | 17.5 | 18.2 | 18.9 |
|
Source: Euromonitor International, 2024 *CAGR: Compound Annual Growth Rate |
||||||
| Category | Annual growth % 2023-2024 | CAGR* % 2023-2028 | Total growth % 2023-2028 |
|---|---|---|---|
| Pet Food | 5.0 | 6.5 | 36.9 |
| Dog and Cat Food | 5.0 | 6.5 | 37.0 |
| Other Pet Food | 4.3 | 4.9 | 27.1 |
| Bird Food | 6.3 | 4.0 | 21.4 |
| Fish Food | 4.9 | 6.2 | 34.9 |
| Small Mammal/Reptile Food | 3.8 | 4.5 | 24.3 |
|
Source: Euromonitor International, 2024 *CAGR: Compound Annual Growth Rate |
|||
Company shares
Mars Inc, Daejoo Co Ltd and Inaba Pet Food Co Ltd clearly dominate the cat food sector, representing 44.5% of the market share in 2022, ahead of other competitors. However, Mars Inc and Daejoo Co Ltd had negative CAGRs of −2.6% and −2.2% respectively from 2018 to 2022. Harim Co Ltd gained the highest CAGR of 106.0% over the past five years.
| Company name | 2018 | 2019 | 2020 | 2021 | 2022 | CAGR* % 2018-2022 |
|---|---|---|---|---|---|---|
| Mars Inc | 29.3 | 26.3 | 24.4 | 24.9 | 26.4 | −2.6 |
| Daejoo Co Ltd | 10.6 | 10.0 | 9.9 | 9.3 | 9.7 | −2.2 |
| Inaba Pet Food Co Ltd | 5.6 | 7.6 | 8.2 | 7.7 | 8.4 | 10.7 |
| Wooriwa Co Ltd | 10.7 | 10.6 | 10.4 | 8.1 | −8.9 (2019-2022) | |
| Dongwon Group | 1.6 | 2.1 | 3.0 | 3.8 | 4.7 | 30.9 |
| Nestlé SA | 5.8 | 4.6 | 4.7 | 4.4 | 4.0 | −8.9 |
| Harim Co Ltd | 0.2 | 1.5 | 2.3 | 2.9 | 3.6 | 106.0 |
| Cargill Inc | 1.7 | 2.3 | 1.9 | 2.0 | 2.4 | 9.0 |
| Sajo Group | 1.1 | 1.5 | 2.5 | 2.3 | 2.2 | 18.9 |
| Ziwi Ltd | 0.6 | 0.8 | 1.3 | 1.9 | 46.8 (2019-2022) | |
| Private Label | 1.2 | 1.3 | 1.6 | 1.7 | 1.8 | 10.7 |
| Others | 19.4 | 18.3 | 15.9 | 13.4 | 13.8 | −8.2 |
|
Source: Euromonitor International, 2024 *CAGR: Compound Annual Growth Rate |
||||||
Mars Inc, Wooriwa Co Ltd and Natural Core Co Ltd dominate the dog food sector, accounting for 34.3% of the market share in 2022. Mars Inc and Wooriwa Co Ltd had the negative CAGRs of −0.3% and −3.2% respectively from 2018 to 2022. In particular, Harim Co Ltd had the highest CAGR of 35.8% from 2018 to 2022.
| Company name | 2018 | 2019 | 2020 | 2021 | 2022 | CAGR* % 2018-2022 |
|---|---|---|---|---|---|---|
| Mars Inc | 15.4 | 13.9 | 14.3 | 14.5 | 15.2 | −0.3 |
| Wooriwa Co Ltd | 13.9 | 14.3 | 13.0 | 12.6 | −3.2 (2019-2022) | |
| Natural Core Co Ltd | 6.9 | 6.9 | 6.8 | 6.3 | 6.5 | −1.5 |
| Cargill Inc | 7.2 | 7.8 | 5.5 | 5.8 | 5.8 | −5.3 |
| Harim Co Ltd | 1.5 | 2.7 | 3.7 | 4.7 | 5.1 | 35.8 |
| Petcurean Pet Nutrition Inc | 3.3 | 3.4 | 3.7 | 3.6 | 3.5 | 1.5 |
| Pet The Man Co Ltd | 2.6 | 2.5 | 3.3 | 3.1 | 3.0 | 3.6 |
| Colgate-Palmolive Co | 2.4 | 2.5 | 2.7 | 2.8 | 2.3 | −1.1 |
| Interpet Korea Co Ltd | 2.0 | 2.1 | 2.2 | N/C | ||
| Sajo Group | 1.6 | 1.7 | 2.1 | 2.2 | 2.1 | 7.0 |
| Private Label | 1.0 | 0.7 | 0.6 | 0.8 | 1.0 | 0.0 |
| Others | 23.0 | 23.6 | 22.1 | 22.9 | 23.3 | 0.3 |
|
Source: Euromonitor International, 2024 *CAGR: Compound Annual Growth Rate N/C: Not calculable |
||||||
JBL GmbH & Co KG, Spectrum Brands Holdings Inc and LIP Parrot Co were the top three in the other pet food sector, accounting for 8.1% of the market share in 2022. JBL GmbH & Co KG and Spectrum Brands Holdings Inc had the negative CAGRs of −3.3% and −6.9% respectively from 2018 to 2022. In particular, the others had a high CAGR of 0.3% from 2018 to 2022.
| Company Name | 2018 | 2019 | 2020 | 2021 | 2022 | CAGR* % 2018-2022 |
|---|---|---|---|---|---|---|
| JBL GmbH & Co KG | 4.0 | 4.8 | 4.6 | 4.5 | 3.5 | −3.3 |
| Spectrum Brands Holdings Inc | 4.0 | 4.0 | 3.8 | 4.0 | 3.0 | −6.9 |
| LIP Parrot Co | 0.8 | 1.1 | 1.6 | N/C | ||
| Marukan Co Ltd | 1.5 | 1.7 | 1.4 | N/C | ||
| Daehan Feed Co Ltd | 3.0 | 2.7 | 2.3 | 2.2 | 1.1 | −22.2 |
| Se Wha Pet Food Co | 0.7 | 0.6 | 0.5 | 0.4 | 0.3 | −19.1 |
| Others | 88.3 | 87.8 | 86.5 | 86.1 | 89.2 | 0.3 |
| Total | 100.0 | 100.0 | 100.0 | 100.0 | 100.0 | 0.0 |
|
Source: Euromonitor International, 2024 *CAGR: Compound Annual Growth Rate N/C: Not calculable |
||||||
Brand shares
Royal Canin by Mars Inc is the top brand in cat food (17.6% share in 2022), followed by Catsrang by Daejoo Co Ltd (9.7% share) and Ciao by Inaba Pet Food Co Ltd (8.4% share). The Real by Harim Co Ltd saw the biggest CAGR of 86.1% from 2018 to 2022.
| Brand name | Company name | 2018 | 2019 | 2020 | 2021 | 2022 | CAGR* % 2018-2022 |
|---|---|---|---|---|---|---|---|
| Royal Canin | Mars Inc | 17.6 | 15.9 | 14.9 | 15.9 | 17.6 | 0.0 |
| Catsrang | Daejoo Co Ltd | 10.6 | 10.0 | 9.9 | 9.3 | 9.7 | −2.2 |
| Ciao | Inaba Pet Food Co Ltd | 5.6 | 7.6 | 8.2 | 7.7 | 8.4 | 10.7 |
| Nutriplan | Dongwon Group | 1.6 | 2.1 | 3.0 | 3.8 | 4.7 | 30.9 |
| ANF | Wooriwa Co Ltd | 0.6 | 2.9 | 2.8 | 2.9 | 69.1 (2019-2022) | |
| Nutro | Mars Inc | 3.1 | 3.0 | 2.7 | 2.5 | 2.5 | −5.2 |
| The Real | Harim Co Ltd | 0.2 | 1.5 | 2.3 | 2.4 | 2.4 | 86.1 |
| Probest | Wooriwa Co Ltd | 6.0 | 4.1 | 3.4 | 2.2 | −28.4 (2019-2022) | |
| Sheba | Mars Inc | 1.8 | 1.9 | 1.9 | 2.1 | 2.2 | 5.1 |
| Whiskas | Mars Inc | 2.9 | 2.6 | 2.5 | 2.3 | 2.1 | −7.8 |
| Private | Private | 1.2 | 1.3 | 1.6 | 1.7 | 1.8 | 10.7 |
| Others | Others | 19.4 | 18.3 | 15.9 | 14.6 | 14.6 | −6.9 |
|
Source: Euromonitor International, 2024 *CAGR: Compound Annual Growth Rate |
|||||||
Royal Canin by Mars Inc leads the brand in dog food (10.6% share in 2022), followed by Natural Core by Natural Core Co Ltd (6.5% share) and Nutrena by Cargill Inc (5.1% share). The Real by Harim Co Ltd saw the biggest CAGR of 84.8% from 2018 to 2022.
| Brand name | Company name | 2018 | 2019 | 2020 | 2021 | 2022 | CAGR* % 2018-2022 |
|---|---|---|---|---|---|---|---|
| Royal Canin | Mars Inc | 10.2 | 9.2 | 9.5 | 9.8 | 10.6 | 1.0 |
| Natural Core | Natural Core Co Ltd | 6.9 | 6.9 | 6.8 | 6.3 | 6.5 | −1.5 |
| Nutrena | Cargill Inc | 7.1 | 6.6 | 4.7 | 5.1 | 5.1 | −7.9 |
| ANF | Wooriwa Co Ltd | 5.9 | 5.8 | 5.2 | 5.1 | −4.7 (2019-2022) | |
| Cesar | Mars Inc | 3.7 | 3.5 | 3.6 | 3.7 | 3.6 | −0.7 |
| The Real | Harim Co Ltd | 0.3 | 1.7 | 2.9 | 3.2 | 3.5 | 84.8 |
| Petcurean | Petcurean Pet Nutrition Inc | 3.3 | 3.4 | 3.7 | 3.6 | 3.5 | 1.5 |
| Pet The Man | Pet The Man Co Ltd | 2.5 | 2.4 | 3.2 | 3.1 | 2.9 | 3.8 |
| Hill's | Colgate-Palmolive Co | 2.4 | 2.5 | 2.7 | 2.8 | 2.3 | −1.1 |
| Sajo | Sajo Group | 1.5 | 1.6 | 2.0 | 2.1 | 2.1 | 8.8 |
| Private | Private | 1.0 | 0.7 | 0.6 | 0.8 | 1.0 | 0.0 |
| Others | Others | 23.4 | 30.3 | 29.0 | 29.3 | 29.7 | 6.1 |
|
Source: Euromonitor International, 2024 *CAGR: Compound Annual Growth Rate |
|||||||
JBL by JBL GmbH & Co KG leads the brand in other pet food (3.5% share in 2022), followed by Tetra by Spectrum Brands Holdings Inc (3.0% share) and Lipparrot by LIP Parrot Co (1.6% share). Grovita by Daehan Feed Co Ltd experienced the most negative CAGR of −22.2% from 2018 to 2022.
| Brand name | Company name | 2018 | 2019 | 2020 | 2021 | 2022 | CAGR* % 2018-2022 |
|---|---|---|---|---|---|---|---|
| JBL | JBL GmbH & Co KG | 4.0 | 4.8 | 4.6 | 4.5 | 3.5 | −3.3 |
| Tetra | Spectrum Brands Holdings Inc | 4.0 | 4.0 | 3.8 | 4.0 | 3.0 | −6.9 |
| Lipparrot | LIP Parrot Co | 0.8 | 1.1 | 1.6 | N/C | ||
| Marukan | Marukan Co Ltd | 1.5 | 1.7 | 1.4 | N/C | ||
| Grovita | Daehan Feed Co Ltd | 3.0 | 2.7 | 2.3 | 2.2 | 1.1 | −22.2 |
| Ping Pong Bird Feed | Se Wha Pet Food Co | 0.7 | 0.6 | 0.5 | 0.4 | 0.3 | −19.1 |
| Others | Others | 88.3 | 87.8 | 86.5 | 86.1 | 89.2 | 0.3 |
|
Source: Euromonitor International, 2024 *CAGR: Compound Annual Growth Rate N/C: Not calculable |
|||||||
Distribution channels
Pet food retail sales in South Korea were distributed primarily through retail e-commerce channels (68.9% market share representation), while the remaining pet food retail sales were distributed via retail and veterinary clinics (24.2% and 7.0% market share respectively) in 2023. Most distribution channels' market share representation declined in varying CAGRs between 2019 to 2023. Retail e-commerce increased by the largest CAGR (7.0%) in all channels.
| Outlet | 2019 | 2020 | 2021 | 2022 | 2023 | CAGR* % 2019-2023 |
|---|---|---|---|---|---|---|
| Retail Channels | 92.0 | 92.6 | 93.1 | 93.0 | 93.0 | 0.3 |
| Retail Offline | 39.5 | 32.8 | 27.4 | 25.6 | 24.2 | −11.5 |
| Grocery Retailers | 12.8 | 11.1 | 9.2 | 8.9 | 8.4 | −10.0 |
| Convenience Retail | 1.6 | 1.6 | 1.7 | 1.9 | 1.9 | 4.4 |
| Hypermarkets | 8.2 | 6.3 | 4.6 | 4.1 | 3.7 | −18.0 |
| Supermarkets | 0.8 | 0.9 | 0.8 | 0.7 | 0.6 | −6.9 |
| Warehouse clubs | 1.5 | 1.7 | 1.6 | 1.7 | 1.7 | 3.2 |
| Small Local Grocers | 0.6 | 0.6 | 0.5 | 0.5 | 0.4 | −9.6 |
| Non-Grocery Retailers | 26.7 | 21.7 | 18.2 | 16.7 | 15.8 | −12.3 |
| General Merchandise Stores | 2.3 | 2.6 | 2.7 | 2.8 | 3.0 | 6.9 |
| Home Products Specialists | 24.1 | 18.8 | 15.2 | 13.7 | 12.5 | −15.1 |
| Pet Shops and Superstores | 24.1 | 18.8 | 15.2 | 13.7 | 12.5 | −15.1 |
| Health and Beauty Specialists | 0.3 | 0.3 | 0.3 | 0.3 | 0.3 | 0.0 |
| Retail E-Commerce | 52.5 | 59.8 | 65.6 | 67.4 | 68.9 | 7.0 |
| Non-retail channels | 8.0 | 7.4 | 6.9 | 7.0 | 7.0 | −3.3 |
| Veterinary clinics | 8.0 | 7.4 | 6.9 | 7.0 | 7.0 | −3.3 |
| Total | 100.0 | 100.0 | 100.0 | 100.0 | 100.0 | 0.0 |
|
Source: Euromonitor International, 2024 *CAGR: Compound Annual Growth Rate |
||||||
Product launch analysis
From 2019 to 2023, a total of 1,418 pet food products were launched in South Korea. The number of yearly product launches has increased by a CAGR of 1.6% from the launch of 269 pet products in 2019 to the most recent launch of 273 pet products in 2023. Dog Snacks & Treats, Cat Snacks & Treats, and dog food wet were top categories of newly released pet food product launches. No additives/preservatives, Low/No/Reduced Allergen, and Functional Pet - Other were top claims associated with new pet food products released during the prescribed period.
| Product attributes | Yearly launch count | ||||
|---|---|---|---|---|---|
| 2019 | 2020 | 2021 | 2022 | 2023 | |
| Yearly product launches | 269 | 292 | 297 | 273 | 287 |
| Top five sub-categories | |||||
| Dog Snacks and Treats | 151 | 216 | 216 | 184 | 199 |
| Cat Snacks and Treats | 29 | 29 | 34 | 29 | 17 |
| Dog Food Wet | 37 | 15 | 21 | 29 | 18 |
| Dog Food Dry | 13 | 14 | 15 | 17 | 37 |
| Cat Food Wet | 38 | 11 | 10 | 12 | 12 |
| Top five claims | |||||
| No Additives/Preservatives | 96 | 91 | 109 | 95 | 65 |
| Low/No/Reduced Allergen | 60 | 106 | 101 | 53 | 73 |
| Functional Pet - Other | 48 | 67 | 69 | 38 | 57 |
| Free from Added/Artificial Colourings | 49 | 58 | 76 | 54 | 40 |
| Free from Added/Artificial Preservatives | 66 | 56 | 60 | 57 | 22 |
| Top five price groups (US dollars) | |||||
| 0.62 - 4.61 | 159 | 142 | 120 | 128 | 92 |
| 4.62 - 8.61 | 59 | 82 | 86 | 66 | 69 |
| 8.62 - 12.61 | 37 | 44 | 50 | 40 | 55 |
| 12.62 - 16.61 | 9 | 12 | 25 | 23 | 48 |
| 16.62 - 24.00 | 5 | 7 | 12 | 11 | 23 |
| Top five launch types | |||||
| New Product | 180 | 200 | 190 | 170 | 154 |
| New Variety/Range Extension | 84 | 72 | 96 | 84 | 115 |
| New Packaging | 2 | 10 | 4 | 14 | 14 |
| Relaunch | 0 | 9 | 2 | 5 | 3 |
| New Formulation | 3 | 1 | 5 | 0 | 1 |
| Top five flavours (including blend) | |||||
| Unflavoured/Plain | 17 | 54 | 34 | 23 | 41 |
| Chicken | 23 | 21 | 31 | 35 | 22 |
| Salmon | 20 | 15 | 17 | 22 | 19 |
| Duck | 12 | 10 | 13 | 18 | 15 |
| Beef | 15 | 14 | 6 | 9 | 18 |
| Top five ingredients | |||||
| Glycerol | 61 | 121 | 116 | 94 | 113 |
| Chicken Meat | 88 | 80 | 80 | 107 | 73 |
| Vitamin E | 69 | 87 | 84 | 82 | 83 |
| Food Acids | 61 | 75 | 67 | 91 | 78 |
| Potassium Sorbate | 23 | 50 | 62 | 64 | 93 |
| Source: Mintel, 2024 | |||||
Product examples
Turmeric Chicken Porridge for Dogs
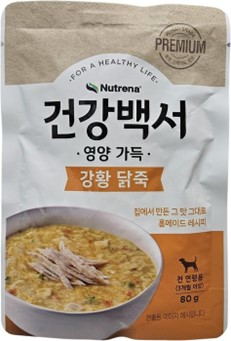
Source: Mintel Global New Products Database, 2024
| Company | Cargill Agri Purina |
|---|---|
| Manufacturer | Miso |
| Distributor | Cargill Agri Purina |
| Brand | Nutrena Geongangbaekseo |
| Category | Pet food |
| Sub-category | Dog food wet |
| Market | South Korea |
| Location of manufacture | South Korea |
| Import status | Not imported |
| Store type | Mass merchandise / hypermarket |
| Date published | December 2023 |
| Product source | Shopper |
| Launch type | New variety / range extension |
| Price in local currency | KRW3,500.00 |
| Price in US dollars | 2.66 |
| Price in Euros | 2.47 |
Nutrena Geongangbaekseo Turmeric Chicken Porridge for Dogs is now available, and retails in an 80 gram pack. - Premium human grade - For a healthy life - Home-made recipe - Suitable for all stage of life from three months - Can be fed straight from the pouch without heating or cooking - Helps with everyday vitality
Beef & Blueberry Jerky for Cats & Dogs

Source: Mintel Global New Products Database, 2024
| Company | Azure Group |
|---|---|
| Manufacturer | Azure Group |
| Distributor | Hanbang |
| Importer | Hanbang |
| Brand | Alfa Pet |
| Category | Pet food |
| Sub-category | Dog snacks and treats |
| Market | South Korea |
| Location of manufacture | New Zealand |
| Import status | Imported product |
| Date published | December 2023 |
| Launch type | New product |
| Price in local currency | KRW15,000.00 |
| Price in US dollars | 11.58 |
| Price in Euros | 10.63 |
Farm Alfa Pet Beef & Blueberry Jerky for Cats & Dogs is now available, and retails in an 80 gram pack. - Made down under in New Zealand and Australia - Low temperature dehydration to lock in more nutrition - 100% natural- No artificial additives or preservatives - Prevents ageing - High in protein - From pasture to bowl - Natural happiness - Logos and certifications: QR code, New Zealand FernMark Licence Programme
Turkey & Carrot & Spinach Sauce Adult Cat Food
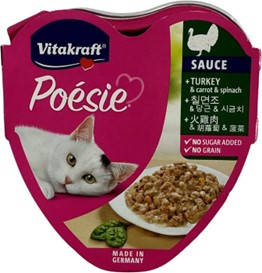
Source: Mintel Global New Products Database, 2024
| Company | Vitakraft Pet Care |
|---|---|
| Manufacturer | Vitakraft Pet Care |
| Distributor | Channelpet |
| Importer | Channelpet |
| Brand | Vitakraft Poésie |
| Category | Pet food |
| Sub-category | Cat food wet |
| Market | South Korea |
| Location of manufacture | Germany |
| Import status | Imported product |
| Store type | Department store |
| Date published | September 2023 |
| Product source | Shopper |
| Launch type | New variety / range extension |
| Price in local currency | KRW1,600.00 |
| Price in US dollars | 1.20 |
| Price in Euros | 1.13 |
Vitakraft Poésie Turkey & Carrot & Spinach Sauce Adult Cat Food is now available, and retails in an 85 gram pack. - No sugar added or grain - Complete pet food for adult cats
For more information
The Canadian Trade Commissioner Service:
International Trade Commissioners can provide Canadian industry with on-the-ground expertise regarding market potential, current conditions and local business contacts, and are an excellent point of contact for export advice.
More agri-food market intelligence:
International agri-food market intelligence
Discover global agriculture and food opportunities, the complete library of Global Analysis reports, market trends and forecasts, and information on Canada's free trade agreements.
Agri-food market intelligence service
Canadian agri-food and seafood businesses can take advantage of a customized service of reports and analysis, and join our email subscription service to have the latest reports delivered directly to their inbox.
More on Canada's agriculture and agri-food sectors:
Canada's agriculture sectors
Information on the agriculture industry by sector. Data on international markets. Initiatives to support awareness of the industry in Canada. How the department engages with the industry.
For additional information on the upcoming Seoul Food & Hotel 2024, please contac:
Ben Berry, Deputy Director
Trade Show Strategy and Delivery
Agriculture and agri-food Canada
ben.berry@agr.gc.ca
Resources
- Global Trade Tracker, 2024
- Euromonitor International, 2024
- Euromonitor International 2023, Cat Food in South Korea
- Euromonitor International 2023, Dog Food in South Korea
- Euromonitor International 2023, Other Pet Food in South Korea
- Mintel Global New Products Database, 2024
Sector Trend Analysis – Pet food trends in South Korea
Global Analysis Report
Prepared by: Hongli Wang, Market Analyst
© His Majesty the King in Right of Canada, represented by the Minister of Agriculture and Agri-Food (2024).
Photo credits
All photographs reproduced in this publication are used by permission of the rights holders.
All images, unless otherwise noted, are copyright His Majesty the King in Right of Canada.
To join our distribution list or to suggest additional report topics or markets, please contact:
Agriculture and Agri-Food Canada, Global Analysis1341 Baseline Rd, Tower 5, 3rd floor
Ottawa ON K1A 0C5
Canada
Email: aafc.mas-sam.aac@agr.gc.ca
The Government of Canada has prepared this report based on primary and secondary sources of information. Although every effort has been made to ensure that the information is accurate, Agriculture and Agri-Food Canada (AAFC) assumes no liability for any actions taken based on the information contained herein.
Reproduction or redistribution of this document, in whole or in part, must include acknowledgement of agriculture and agri-food Canada as the owner of the copyright in the document, through a reference citing AAFC, the title of the document and the year. Where the reproduction or redistribution includes data from this document, it must also include an acknowledgement of the specific data source(s), as noted in this document.
Agriculture and Agri-Food Canada provides this document and other report services to agriculture and food industry clients free of charge.