

Note: This report includes forecasting data that is based on baseline historical data.
Executive summary
The plant-based food market in the United Kingdom (UK) continues to experience dynamic growth, driven by rising consumer interest in health, sustainability, and ethical eating. With growing demand for plant-based protein, pulses such as peas, lentils, chickpeas, and beans are emerging as popular ingredients for their nutritional benefits and environmental sustainability. The market for plant-based pulse ingredients, valued at US$21.74 billion globally in 2023, is expected to grow at a compound annual growth rate (CAGR) of 3.1% through 2030 (Grand View Research,2024).
In the UK, health-conscious consumers and flexitarians are reducing their meat intake, with 32% reporting reduced meat consumption and 10% eating meat and fish only occasionally (Euromonitor International, 2023). This shift has led to increasing demand for plant-based products, reflected in the steady decline in red meat consumption. The number of vegans, vegetarians, and flexitarians is rising, contributing to a growing market for plant-based alternatives across multiple food categories.
In 2023, global imports of plant-based pulse ingredients reached US$14.8 billion, growing at a 14.5% CAGR from 2019 to 2023. India led with imports of US$3.1 billion, increasing at 18.8% CAGR, followed by China at US$1.7 billion with a 21.1% CAGR. The UK, ranking 11th, imported US$286.3 million with a 4.2% CAGR.
Canada plays a key role in the UK's plant-based pulse ingredient market, supplying a significant portion of pulse products. In 2023, Canada exported US$104.9 million of plant-based pulse ingredients to the UK, with Ontario as the largest supplier. Canada's strong agricultural base and strategic collaborations across the agri-food and biotech sectors have positioned it as a leader in developing and exporting plant-based proteins.
The UK market for plant-based food and beverage products has experienced dynamic growth from 2019 to 2023, with total retail sales increasing from $718.6 million to $1,403.1 million, representing a CAGR of 18.2%. The sector is projected to maintain steady growth, reaching a total market size of US$1,859.1 million by 2028 (CAGR 5.8% from 2023 to 2028).
The market size of plant-based proteins in the UK is projected to grow moderately between 2020 and 2029. By 2024, the total market across retail and foodservice channels is expected to reach 86.9 thousand tons, with a slight growth at a CAGR of 0.7% from 2020 to 2024.
Key demographic indicators
Plant-based foods remain a transformative trend in retail, driven by consumer interest in health, ethics, and sustainability. This trend is fueled by consumer motivations related to health, ethics, and sustainability, leading to the proliferation of plant-based claims across various food categories. Beyond traditional meat and milk substitutes, plant-based options have grown significantly in products like yogurt, cheese, and other dairy alternatives. Globally, 21.2% of people are reducing meat intake, 13.7% are cutting back on dairy, and 15.3% are following a plant-based diet, with a notable rise in veganism from 3.4% in 2019 to 4.6% in 2022 (Euromonitor International, 2024). Despite some setbacks, the overall interest in plant-based foods remains strong, particularly in markets with higher numbers of flexitarians and those reducing animal-based foods.
Global distribution of active patents for food and drink products disclosing plant-based protein sources shows soy as the most commonly mentioned alternative protein. While soy dominates, recent years have seen growing exploration of other sources such as peas, chickpeas, potatoes, legumes, and cereals. Additionally, 17% of patents feature alternative proteins from sources like hemp, marine plants, algae, fungi, insects, and those produced via precision fermentation (Mintel, 2023).
Pulse ingredients, derived from crops such as peas, lentils, chickpeas, and beans, are gaining popularity as they offer nutritional benefits like protein fortification, dietary fiber enrichment, and low-calorie formulation, making them attractive for both food and beverage applications. The global pulse ingredients market, estimated at US$ 21.74 billion in 2023, is projected to grow at a CAGR of 3.1% from 2024 to 2030 (Grand View Research,2024). Known for their health benefits and environmental sustainability, pulses see steady global demand despite market fluctuations. Major companies like Ripple Foods, Beyond Meat, and Konscious Foods prominently incorporate pulse ingredients into their products (Vegconomist, 2024).
In the UK, the demand for pulse ingredients is supported by the broader trend towards plant-based diets, as more consumers seek alternatives to animal products. In response to unhealthy eating habits and sedentary lifestyles, many British consumers, according to Euromonitor's survey, are prioritizing weight management: 20% are actively dieting, and 30% are monitoring their food intake. Despite 44% prioritizing healthy ingredients in their food and drinks–compared to 52% globally–only 28% closely read nutrition labels. Health concerns, rising prices, and sustainability have led 32% to reduce meat consumption, with 10% now eating meat and fish only occasionally (Euromonitor International, 2023).
British meat consumption has hit its lowest level since 1974, declining 14% over the past decade. Red meat, in particular, is less popular. The number of vegans, vegetarians, and flexitarians is rising, with 1.1 million more vegans and 3.1 million more vegetarians between 2023 and 2024. In 2023, the UK saw an average per capita daily consumption of 110g of protein and 135g of fat, compared to 92g of protein and 89g of fat globally (Euromonitor International, 2023). Additionally, 6.4 million people plan to go meat-free this year (Claire Hamlett, 2024). A recent study reveals that 49% of plant-based individuals in the UK are male, with London having the highest rate of plant-based eaters at 15%, while Northern Ireland has the lowest at 2%. Health concerns drive nearly half of these individuals, with 30% of Gen Z, 24% of those aged 30-39, and 24% of those aged 40-49 following a plant-based diet (Jordi Casamitjana, 2024).
Trade overview
In 2023, global imports of plant-based pulse ingredients reached US$14.8 billion, growing at a 14.5% CAGR from 2019 to 2023. India led with imports of US$3.1 billion, increasing at 18.8% CAGR, followed by China at US$1.7 billion with a 21.1% CAGR. Turkey and Mexico showed the highest growth, with 32.0% and 33.4% CAGR respectively. Pakistan and Egypt experienced moderate growth, while the US and Spain saw steady increases. Italy and Canada also contributed significantly. The UK, ranking 11th, imported US$286.3 million with a 4.2% CAGR.
| Country | 2019 | 2020 | 2021 | 2022 | 2023 | CAGR* % 2019-2023 |
|---|---|---|---|---|---|---|
| World | 8,600.8 | 10,517.1 | 11,981.8 | 13,572.3 | 14,756.1 | 14.5 |
| India | 1,550.0 | 1,563.8 | 2,094.9 | 1,948.7 | 3,082.6 | 18.8 |
| China | 803.2 | 1,071.6 | 1,190.5 | 1,750.1 | 1,725.1 | 21.1 |
| Turkey | 388.7 | 553.4 | 670.4 | 856.1 | 1,180.3 | 32.0 |
| Pakistan | 221.1 | 634.8 | 771.4 | 759.8 | 809.1 | 8.4 |
| United States | 386.6 | 483.6 | 591.2 | 732.6 | 692.3 | 15.7 |
| Egypt | 406.4 | 384.5 | 446.7 | 498.1 | 542.3 | 7.5 |
| Mexico | 145.4 | 194.6 | 250.5 | 176.1 | 460.6 | 33.4 |
| Spain | 217.2 | 229.2 | 196.2 | 222.7 | 425.8 | 18.3 |
| Italy | 257.9 | 346.8 | 364.1 | 380.5 | 425.7 | 13.4 |
| Canada | 191.3 | 224.2 | 205.2 | 220.3 | 299.6 | 11.9 |
| United Kingdom (11th) | 242.7 | 257.8 | 230.0 | 255.3 | 286.3 | 4.2 |
|
Source: Global Trade Tracker, 2024 *CAGR: Compound Annual Growth Rate Note: HS codes for plant-based pulse ingredients fall under 0713 for dried legumes (peas, beans, lentils) and 1106.10 for pulse flours. |
||||||
In 2023, the UK's top 10 import markets for plant-based pulse ingredients saw an increase to US$286.3 million, up from US$242.7 million in 2019, reflecting a 4.2% CAGR from 2019 to 2023. Canada remained the largest supplier with imports totaling US$101.3 million, but its growth was modest at 0.5% CAGR. In contrast, India experienced significant growth, with imports rising to US$50.8 million and a CAGR of 28.1%. The UAE and Netherlands also showed strong performance with CAGRs of 30.0% and 32.6%, respectively. Conversely, Imports from France fell by 19.0%, and Myanmar experienced a slight decline. Imports from Argentina grew by 24.0% CAGR, while imports from Denmark increased sharply by 49.6% CAGR, reaching US$6.0 million.
| Country | 2019 | 2020 | 2021 | 2022 | 2023 | CAGR* % 2019-2023 |
|---|---|---|---|---|---|---|
| World | 242.7 | 257.8 | 230.0 | 255.3 | 286.3 | 4.2 |
| Canada | 99.2 | 96.8 | 94.4 | 98.4 | 101.3 | 0.5 |
| India | 18.9 | 20.2 | 19.3 | 28.4 | 50.8 | 28.1 |
| Turkey | 14.6 | 24.9 | 30.0 | 27.3 | 24.9 | 14.4 |
| Australia | 10.5 | 11.5 | 12.5 | 13.5 | 11.8 | 3.0 |
| Argentina | 4.8 | 8.0 | 5.6 | 7.2 | 11.5 | 24.0 |
| France | 25.5 | 14.9 | 8.1 | 11.7 | 11.0 | −19.0 |
| United Arab Emirates | 3.1 | 4.5 | 6.0 | 2.7 | 8.7 | 30.0 |
| Netherlands | 2.3 | 4.1 | 2.0 | 8.5 | 7.1 | 32.6 |
| Myanmar | 6.8 | 11.7 | 6.0 | 5.4 | 6.7 | −0.2 |
| Denmark | 1.2 | 1.3 | 3.3 | 5.4 | 6.0 | 49.6 |
|
Source: Global Trade Tracker, 2024 *CAGR: Compound Annual Growth Rate Note: HS codes for plant-based pulse ingredients fall under 0713 for dried legumes (peas, beans, lentils) and 1106.10 for pulse flours. |
||||||
In 2023, the UK's top plant-based pulse imports were dried kidney beans (HS Code 071333) at US$94.8 million, dried chickpeas (HS Code 071320) at US$51.4 million, and dried lentils (HS Code 071340) at US$48.4 million. The three fastest-growing products were dried bambara beans (HS Code 071334), with a 144.7% CAGR reaching US$0.2 million, dried pigeon peas (HS Code 071360) at 53.6% CAGR totaling US$5.2 million, and dried broad beans and horse beans (HS Code 071350) with a 46.6% CAGR, amounting to US$9.3 million.
| HS code | Description | 2019 | 2020 | 2021 | 2022 | 2023 | CAGR* % 2019-2023 |
|---|---|---|---|---|---|---|---|
| Total | 242.7 | 257.8 | 230.0 | 255.3 | 286.3 | 4.2 | |
| 071333 | dried kidney beans | 94.8 | 98.0 | 96.3 | 97.3 | 94.8 | 0.0 |
| 071320 | dried chickpeas | 45.3 | 48.2 | 38.8 | 45.2 | 51.4 | 3.2 |
| 071340 | dried lentils | 22.8 | 34.9 | 31.6 | 37.0 | 48.4 | 20.7 |
| 071331 | dried mung beans or urad beans | 13.9 | 21.4 | 19.7 | 20.6 | 26.3 | 17.3 |
| 071310 | dried peas | 36.4 | 22.7 | 16.0 | 18.4 | 22.9 | −11.0 |
| 110610 | pulse flour and meal | 9.9 | 10.9 | 9.9 | 12.7 | 13.5 | 8.0 |
| 071350 | dried broad beans and horse beans | 2.0 | 2.6 | 4.2 | 8.5 | 9.3 | 46.6 |
| 071339 | dried beans | 7.4 | 7.4 | 5.1 | 7.2 | 7.6 | 0.7 |
| 071360 | dried pigeon peas | 0.9 | 4.1 | 2.2 | 2.9 | 5.2 | 53.6 |
| 071390 | other dried leguminous vegetables | 5.3 | 2.4 | 2.0 | 1.7 | 2.8 | −15.1 |
| 071335 | dried, shelled cow peas | 3.2 | 4.0 | 3.0 | 2.5 | 2.4 | −6.9 |
| 071332 | dried red adzuki beans | 0.6 | 1.1 | 1.0 | 1.1 | 1.4 | 23.0 |
| 071334 | dried bambara beans | 0.01 | 0.11 | 0.16 | 0.14 | 0.2 | 144.7 |
|
Source: Global Trade Tracker, 2024 *CAGR: Compound Annual Growth Rate Note: HS codes for plant-based pulse ingredients fall under 0713 for dried legumes (peas, beans, lentils) and 1106.10 for pulse flours. |
|||||||
Canada's performance
As one of Canada's five Global Innovation Clusters, The Protein Industries Cluster, led by Protein Industries Canada, is enhancing the value of canadian crops like canola, wheat, and pulses, and meeting the growing demand for plant-based meat alternatives in North America, Asia, and Europe. The Cluster promotes sustainability and traceability in the food supply by integrating partners across the value chain–from seed genetics and farming to ingredient processing and consumer products. With a total funding of up to Can$323 million, it supports the sector-wide goal of reaching Can$25 billion in annual sales by 2035 (Government of Canada, 2024).
Canada's advantage in plant-based pulse protein development is driven by strategic collaborations across the agri-food and biotech sectors, leveraging its strong agricultural base, particularly in pulse crop production. Partnerships, such as those involving Lovingly Made Flour Mills, TMRW Foods, Roquette, Prairie Fava, and BioNeutra, focus on sustainable and scalable plant-based products, supported by advanced processing technologies for protein extraction. Efforts by companies like Wamame, Apex, and AGT emphasize upcycling plant-based waste, aligning with global sustainability trends. With innovative technologies and market expansion through collaborations like Avena, Big Mountain Foods, and Danone Canada, Canada is well-positioned as a leader in the plant-based protein market (Protein Industries Canada,2024).
In 2023, Canada's plant-based pulse ingredients exports to global markets reached US$4.6 billion, with a CAGR of 10.8% from 2019 to 2023. China, India, and the US were the top markets, contributing significantly to this growth, while Morocco showed the highest CAGR at 50.8%. The UK ranked 12th, slightly decreasing by 0.1% CAGR to US$104.9 million in 2023.
| Country | 2019 | 2020 | 2021 | 2022 | 2023 | CAGR* % 2019-2023 |
|---|---|---|---|---|---|---|
| World | 3,074.7 | 4,262.4 | 3,705.0 | 4,343.1 | 4,641.0 | 10.8 |
| China | 710.7 | 948.3 | 791.9 | 871.1 | 832.4 | 4.0 |
| India | 421.4 | 707.7 | 406.3 | 394.6 | 795.9 | 17.2 |
| United States | 267.1 | 276.7 | 394.2 | 547.2 | 520.2 | 18.1 |
| Turkey | 117.1 | 373.4 | 363.2 | 522.1 | 518.7 | 45.1 |
| United Arab Emirates | 146.3 | 228.3 | 264.3 | 314.2 | 217.6 | 10.4 |
| Bangladesh | 309.2 | 314.3 | 224.9 | 223.1 | 143.7 | −17.4 |
| Morocco | 24.0 | 72.1 | 22.3 | 62.8 | 124.1 | 50.8 |
| Colombia | 92.1 | 97.1 | 95.0 | 116.4 | 124.1 | 7.7 |
| Mexico | 27.3 | 42.7 | 46.2 | 47.3 | 110.0 | 41.7 |
| Algeria | 42.4 | 47.5 | 74.6 | 111.3 | 108.6 | 26.5 |
| Italy | 49.4 | 76.4 | 86.6 | 71.0 | 106.8 | 21.2 |
| United Kingdom (12th) | 105.2 | 97.3 | 92.3 | 101.1 | 104.9 | −0.1 |
| Peru | 32.5 | 59.6 | 50.8 | 84.1 | 81.4 | 25.8 |
| Spain | 20.4 | 27.5 | 28.5 | 39.4 | 76.6 | 39.2 |
| Pakistan | 101.9 | 90.7 | 109.1 | 181.8 | 66.6 | −10.1 |
| Japan | 46.8 | 44.1 | 50.8 | 54.2 | 58.2 | 5.6 |
| France | 17.3 | 20.9 | 29.2 | 27.9 | 40.2 | 23.4 |
| Chile | 16.3 | 48.1 | 20.0 | 10.6 | 37.3 | 22.9 |
| Belgium | 14.8 | 19.5 | 26.3 | 32.1 | 35.9 | 24.9 |
| Egypt | 47.8 | 81.7 | 55.7 | 23.6 | 34.1 | −8.1 |
|
Source: Global Trade Tracker, 2024 *CAGR: Compound Annual Growth Rate Note: HS codes for plant-based pulse ingredients fall under 0713 for dried legumes (peas, beans, lentils) and 1106.10 for pulse flours. |
||||||
Canada's plant-based pulse ingredient exports to the UK remained stable between 2019 and 2023, totaling US$104.9 million in 2023, with a slight decline of −0.1% CAGR. Dried kidney beans (HS 071333) were the largest export, accounting for US$80.7 million, but with a −1.7% CAGR. Dried lentils (HS 071340) grew by 3.1% to US$11.6 million, while dried chickpeas (HS 071320) experienced the highest growth at 14.4%, reaching US$6.9 million. Dried beans (HS 071339) increased 8.7% to US$4.8 million in 2023, and pulse flour and meal (HS 110610) rose 7.7% to US$702.6 thousand. Dried peas (HS 071310) declined sharply, with a −15.0% CAGR.
| HS code | Description | 2019 | 2020 | 2021 | 2022 | 2023 | CAGR* % 2019-2023 |
|---|---|---|---|---|---|---|---|
| Total | 105,173.0 | 97,257.9 | 92,346.1 | 101,054.6 | 104,853.6 | −0.1 | |
| 071333 | dried kidney beans | 86,247.7 | 76,510.8 | 74,028.2 | 76,197.6 | 80,663.9 | −1.7 |
| 071340 | dried lentils | 10,261.8 | 11,187.5 | 8,561.7 | 10,445.4 | 11,587.4 | 3.1 |
| 071320 | dried chickpeas | 4,043.8 | 3,926.9 | 4,142.9 | 7,486.7 | 6,924.7 | 14.4 |
| 071339 | dried beans | 3,401.1 | 3,877.7 | 4,548.9 | 5,519.6 | 4,752.4 | 8.7 |
| 110610 | pulse flour and meal | 522.7 | 883.0 | 566.9 | 854.0 | 702.6 | 7.7 |
| 071310 | dried peas | 426.7 | 481.3 | 337.8 | 296.5 | 222.5 | −15.0 |
| 071390 | dried leguminous vegetables | 0.0 | 8.4 | 0.0 | 0.0 | 0.0 | N/C |
| 071332 | dried red adzuki beans | 269.1 | 382.1 | 159.7 | 254.9 | 0.0 | N/C |
|
Source: Global Trade Tracker, 2024 *CAGR: Compound Annual Growth Rate N/C: Not calculable Note: HS codes for plant-based pulse ingredients fall under 0713 for dried legumes (peas, beans, lentils) and 1106.10 for pulse flours. |
|||||||
Ontario was the largest supplier by province, with exports growing steadily at a CAGR of 8.3%, reaching US$73.0 million in 2023. Saskatchewan followed with a 4.7% CAGR, contributing US$18.0 million. Manitoba's exports, however, saw a significant decline, with a −16.9% CAGR, dropping to US$12.7 million. Alberta experienced the sharpest fall, with exports decreasing by −43.0% to US$1.1 million, while British Columbia had minimal exports, contributing only US$15.3 thousand in 2023.
| Province | 2019 | 2020 | 2021 | 2022 | 2023 | CAGR* % 2019-2023 |
|---|---|---|---|---|---|---|
| Total | 105,173.0 | 97,257.9 | 92,346.1 | 101,054.6 | 104,853.6 | −0.1 |
| Ontario | 53,102.6 | 62,684.6 | 70,138.5 | 75,474.1 | 73,036.9 | 8.3 |
| Saskatchewan | 14,959.1 | 15,967.3 | 12,965.2 | 18,459.9 | 18,005.8 | 4.7 |
| Manitoba | 26,551.5 | 18,103.9 | 9,111.8 | 6,945.7 | 12,690.8 | −16.9 |
| Alberta | 10,479.0 | 502.1 | 130.7 | 175.0 | 1,104.7 | −43.0 |
| British Columbia | 80.7 | 15.3 | −34.0 | |||
|
Source: Global Trade Tracker, 2024 *CAGR: Compound Annual Growth Rate Note: HS codes for plant-based pulse ingredients fall under 0713 for dried legumes (peas, beans, lentils) and 1106.10 for pulse flours. |
||||||
Market size
The UK market for plant-based food and beverage products has experienced dynamic growth from 2019 to 2023, with total retail sales increasing from US$718.6 million to US$1,403.1 million, representing a CAGR of 18.2%. The sector is projected to maintain steady growth, reaching a total market size of US$1,859.1 million by 2028 (CAGR 5.8% from 2023 to 2028).
The plant-based cooking ingredients and meals category saw remarkable growth, surging from US$47.1 million in 2019 to US $159.0 million in 2023, with a robust CAGR of 35.6%. This category is expected to continue expanding, though at a slower rate, with a forecasted CAGR of 7.3% from 2023 to 2028, reaching US$226.0 million by 2028. Within this segment, meals and soups and ready meals showed substantial growth, with CAGRs of 25.9% and 25.4% respectively, and are projected to maintain growth rates of 10.5% and 8.6% from 2023 to 2028.
In the UK, the growing number of flexitarians is driving the popularity of vegetarian claims in cooking ingredients and meals. Vegetarian products dominate this segment, with significant sales of vegetarian sauces, dips, and condiments. Plant-based options are gaining traction as consumers seek healthier and more sustainable choices. Major brands like Unilever and Filippo Berio are expanding their offerings with vegan and vegetarian options. The rise of plant-based ready meals, including those from brands like White Rabbit and Beyond Meat, reflects the demand for convenient, health-focused meals. This trend towards plant-based alternatives is expected to continue, supported by increasing consumer interest in both dietary health and environmental sustainability (Euromonitor International, 2024).
| Category | 2019 | 2023 | CAGR* % 2019-2023 | 2024 | 2028 | CAGR* % 2023-2028 |
|---|---|---|---|---|---|---|
| Cooking Ingredients and Meals | 47.1 | 159.0 | 35.6 | 168.9 | 226.0 | 7.3 |
| Meals and Soups | 31.7 | 79.8 | 25.9 | 87.8 | 131.3 | 10.5 |
| Sauces, Dips and Condiments | 8.6 | 69.4 | 68.7 | 70.7 | 79.6 | 2.8 |
| Ready Meals | 26.4 | 65.3 | 25.4 | 71 | 98.7 | 8.6 |
| Soup | 4.1 | 13.2 | 34.0 | 15.1 | 24.4 | 13.1 |
| Sweet Spreads | 6.8 | 9.8 | 9.9 | 10.4 | 15.1 | 8.9 |
| Nut and Seed Based Spreads | 6.8 | 9.8 | 9.9 | 10.4 | 15.1 | 8.9 |
| Pizza | 1.299 | 1.302 | 0.1 | 1.8 | 8.1 | 44.1 |
|
Source: Euromonitor International, 2024 *CAGR: Compound Annual Growth Rate |
||||||
The plant-based dairy products and alternatives category also demonstrated significant growth, increasing from US$508.1 million in 2019 to $832.1 million in 2023 (CAGR of 13.1%). However, growth is expected to slow, with a forecasted CAGR of 4.6% from 2023 to 2028, bringing the category to US$1,042.5 million by 2028. Notably, plant-based milk and plant-based cheese within this category exhibited strong growth rates, with CAGRs of 13.9% and 25.0% from 2019 to 2023. Despite a slowdown, plant-based cheese is still expected to grow at a solid 8.9% CAGR from 2023 to 2028.
In 2023, the plant-based segment of dairy products, particularly plant-based milk, saw notable growth driven by increasing consumer awareness of food intolerances, health trends, and sustainability concerns. Plant-based milk, especially oat-based options, became popular for its creamy texture and neutral taste, complementing coffee and meeting the needs of lactose-intolerant and vegan consumers. Groupe Danone led the no-allergens dairy market with a 71% retail value share, while competition from brands like Mighty, offering pea and oat milk, grew(Euromonitor International, 2024). The market is expected to further expand with fortified and functional claims, driven by innovation and consumer demand for health benefits and environmental sustainability. Despite some resistance due to perceived nutritional shortcomings of plant-based alternatives, advancements in product development aim to address these concerns (Euromonitor International, 2024).
| Category | 2019 | 2023 | CAGR* % 2019-2023 | 2024 | 2028 | CAGR* % 2023-2028 |
|---|---|---|---|---|---|---|
| Dairy Products and Alternatives | 508.1 | 832.1 | 13.1 | 871.3 | 1,042.50 | 4.6 |
| Plant-based Milk | 256.4 | 431.9 | 13.9 | 449.5 | 539.1 | 4.5 |
| Drinking Milk Products | 256.4 | 431.9 | 13.9 | 449.5 | 539.1 | 4.5 |
| Butter and Spreads | 159.1 | 226.2 | 9.2 | 231.8 | 243.5 | 1.5 |
| Yoghurt and Sour Milk Products | 64 | 117.7 | 16.5 | 129.3 | 176.9 | 8.5 |
| Plant-based Yoghurt | 64 | 117.7 | 16.5 | 129.3 | 176.9 | 8.5 |
| Plant-based Cheese | 17.3 | 42.2 | 25.0 | 45.3 | 64.6 | 8.9 |
| Other Dairy | 11.3 | 13.7 | 4.9 | 14.8 | 17 | 4.4 |
| Cream | 6.6 | 10.1 | 11.3 | 10.5 | 12.3 | 4.0 |
| Chilled and Shelf Stable Desserts | 4.7 | 3.6 | −6.8 | 4.3 | 4.7 | 5.6 |
| Prepared Baby Food | 0.1 | 0.4 | 27.6 | 0.6 | 1.4 | 29.9 |
| Baby Food | 0.1 | 0.4 | 27.6 | 0.6 | 1.4 | 29.9 |
| Hot Drinks | 0.1 | 0.8 | 71.6 | 1.2 | 1.5 | 13.5 |
| Fresh Coffee | 0 | 0.6 | 134.6 | 1 | 1.4 | 16.9 |
| Coffee | 0 | 0.6 | 134.6 | 1 | 1.4 | 16.9 |
| Other Hot Drinks | 0.1 | 0.1 | 20.2 | 0.2 | 0.1 | −9.9 |
|
Source: Euromonitor International, 2024 *CAGR: Compound Annual Growth Rate |
||||||
The plant-based snacks category saw its market size increase from US$39.0 million in 2019 to US$112.0 million in 2023, reflecting a CAGR of 30.2%. Despite the slowdown to a 6.2% CAGR expected between 2023 and 2028, certain segments like ice cream and sweet biscuits, snack bars, and fruit snacks continue to exhibit strong demand, with expected growth rates of 8.5% and 5.1%, respectively.
In 2023, plant-based snacks in the UK saw significant growth, outpacing both vegan and vegetarian claims despite starting from a lower base. Categories like sweet biscuits, snack bars, and plant-based ice cream made notable contributions. Vegan chocolate gained traction, driven by consumers' familiarity with milk alternatives and their demand for indulgent, sustainable options. Established brands like Cadbury and Lindt, as well as emerging players like Hip, expanded their plant-based offerings. Similarly, plant-based ice cream, such as Hackney Gelato's new sorbetto, continued to rise in popularity, fueled by consumer desires for indulgence and quality flavors rather than solely health benefits (Euromonitor International, 2024).
| Category | 2019 | 2023 | CAGR* % 2019-2023 | 2024 | 2028 | CAGR* % 2023-2028 |
|---|---|---|---|---|---|---|
| Snacks | 39.0 | 112.0 | 30.2 | 116.7 | 151.1 | 6.2 |
| Sweet Biscuits, Snack Bars and Fruit Snacks | 20.3 | 42.0 | 19.9 | 42.7 | 54 | 5.1 |
| Ice Cream | 8.3 | 32.1 | 40.3 | 34.4 | 48.2 | 8.5 |
| Snack Bars | 13.7 | 30.5 | 22.2 | 31.2 | 39.7 | 5.4 |
| Confectionery | 3.01 | 25.5 | 70.6 | 26.4 | 31.3 | 4.1 |
| Chocolate Confectionery | 2.4 | 22.2 | 74.9 | 22.9 | 27.4 | 4.4 |
| Savoury Snacks | 7.3 | 12.3 | 13.8 | 13.2 | 17.6 | 7.4 |
| Sweet Biscuits | 6.5 | 11.4 | 15.0 | 11.5 | 14.2 | 4.4 |
| Savoury Biscuits | 3.3 | 6.3 | 17.1 | 6.3 | 6.7 | 1.2 |
| Salty Snacks | 0.01 | 4.9 | 341.2 | 5.7 | 9.2 | 13.3 |
| Sugar Confectionery | 0.6 | 3.4 | 51.3 | 3.5 | 3.9 | 2.7 |
| Nuts, Seeds and Trail Mixes | 0.1 | 1.0 | 79.4 | 1.1 | 1.6 | 9.7 |
| Other Savoury Snacks | 0.3 | 0.1 | −17.9 | 0.1 | 0.1 | 2.9 |
| Fruit Snacks | 0.13 | 0.02 | −41.3 | 0.01 | 0..06 | 29.0 |
| Popcorn | 3.6 | |||||
|
Source: Euromonitor International, 2024 *CAGR: Compound Annual Growth Rate |
||||||
The plant-based soft drinks category experienced rapid expansion, with sales growing from US$41.1 million in 2019 to US$118.6 million in 2023, resulting in a CAGR of 30.3%. This momentum is expected to continue, with a forecasted CAGR of 8.7% from 2023 to 2028, driven by the increasing popularity of ready-to-drink coffee, which saw an impressive 46.9% CAGR from 2019 to 2023 and is projected to grow at 15.8% CAGR until 2028.
| Category | 2019 | 2023 | CAGR* % 2019-2023 | 2024 | 2028 | CAGR* % 2023-2028 |
|---|---|---|---|---|---|---|
| Soft Drinks | 41.1 | 118.6 | 30.3 | 130.7 | 179.9 | 8.7 |
| Ready-to-drink Coffee | 9.8 | 45.5 | 46.9 | 54.5 | 94.8 | 15.8 |
| Juice | 18.2 | 38.2 | 20.3 | 38.4 | 36.4 | −0.9 |
| Energy Drinks | 13.0 | 34.1 | 27.2 | 36.7 | 46.9 | 6.6 |
| Non-Cola Carbonates | 0.06 | 0.64 | 79.9 | 0.8 | 1.5 | 18.7 |
| Carbonates | 0.06 | 0.64 | 79.90 | 0.8 | 1.5 | 18.7 |
| Ready-to-drink Tea | 0.04 | 0.17 | 45.8 | 0.24 | 0.30 | 11.3 |
|
Source: Euromonitor International, 2024 *CAGR: Compound Annual Growth Rate |
||||||
The plant-based hot drinks category in the UK saw impressive growth, with sales rising from $0.1 million in 2019 to $0.8 million in 2023, marking a remarkable CAGR of 71.6%. This robust growth is primarily driven by the rapid expansion of fresh coffee, which grew at a CAGR of 134.6% over the same period. Looking ahead, the sector is expected to maintain positive momentum, with a forecasted CAGR of 13.5% from 2023 to 2028, reaching US$1.5 million by 2028. However, the other hot drinks segment is anticipated to experience slower growth and a slight decline.
Plant-based, vegetarian, and vegan claims within hot drinks are poised for significant growth, reflecting broader trends in packaged foods. The rising consumer demand for non-dairy options, driven by dietary, environmental, and ethical reasons, is expected to boost the popularity of vegan hot drinks. Innovations such as the January 2023 launch of Galaxy Vegan Hot Chocolate by a major brand are likely to further stimulate the market, encouraging more players to enter the sector and driving dynamic growth in vegan hot drinks over the forecast period (Euromonitor International, 2024).
| Category | 2019 | 2023 | CAGR* % 2019-2023 | 2024 | 2028 | CAGR* % 2023-2028 |
|---|---|---|---|---|---|---|
| Hot Drinks | 0.1 | 0.8 | 71.6 | 1.2 | 1.5 | 13.5 |
| Fresh Coffee | 0.02 | 0.64 | 134.6 | 0.99 | 1.4 | 16.9 |
| Other Hot Drinks | 0.1 | 0.1 | 20.2 | 0.2 | 0.1 | −9.9 |
|
Source: Euromonitor International, 2024 *CAGR: Compound Annual Growth Rate |
||||||
The plant-based staple foods sector in the UK has shown significant growth, with sales expanding from US$83.1 million in 2019 to US$180.6 million in 2023, achieving a robust CAGR of 21.4%. This growth is primarily driven by the "processed meat, seafood and alternatives to meat" and "meat and seafood substitutes" categories, which recorded a CAGR of 21.3% and 22.2%, respectively, over the same period. Looking ahead, the market is projected to continue its upward trajectory with a forecasted CAGR of 7.4% from 2023 to 2028, reaching $258.1 million by 2028. Key segments such as rice, pasta, and noodles are expected to maintain strong growth, driven by increasing consumer preference for plant-based options, although growth rates are anticipated to moderate compared to recent years.
In the UK, the rise in health-conscious and flexitarian diets has propelled vegetarian claims to lead the staple foods sector. This trend is supported by growing consumer demand for plant-based options, including vegetarian and vegan meat and seafood substitutes. Despite a slight dip in sales due to economic pressures, innovations such as Richmond's high-protein plant-based sausages and Beyond Meat's new chicken alternatives sustain consumer interest. The shift towards plant-based diets is expected to continue driving growth, with major brands expanding their product ranges and focusing on affordability to meet evolving consumer preferences amidst ongoing economic challenges (Euromonitor International, 2024).
| Category | 2019 | 2023 | CAGR* % 2019-2023 | 2024 | 2028 | CAGR* % 2023-2028 |
|---|---|---|---|---|---|---|
| Staple Foods | 83.1 | 180.6 | 21.4 | 187.9 | 258.1 | 7.4 |
| Processed Meat, Seafood and Alternatives to Meat | 70.1 | 151.9 | 21.3 | 158.1 | 222.8 | 8.0 |
| Meat and Seafood Substitutes | 60.3 | 134.5 | 22.2 | 139.6 | 196 | 7.8 |
| Breakfast Cereals | 11.5 | 20.5 | 15.5 | 21 | 23.1 | 2.4 |
| Tofu and Derivatives | 9.8 | 17.4 | 15.3 | 18.4 | 26.7 | 9.0 |
| Rice, Pasta and Noodles | 1.2 | 6.1 | 51.2 | 6.5 | 9.5 | 9.3 |
| Noodles | 0.6 | 4 | 58.3 | 4.2 | 5.4 | 6.5 |
| Pasta | 0.5 | 2.1 | 41.2 | 2.4 | 4 | 13.9 |
| Processed Fruit and Vegetables | 0.3 | 1.9 | 65.1 | 1.9 | 2.2 |
3.4 |
| Dessert Mixes | 0.1 | 0.2 | 25.1 | 0.3 | 0.5 | 13.8 |
| Baked Goods | 0.1 | 0.2 | 25.1 | 0.3 | 0.5 | 13.8 |
|
Source: Euromonitor International, 2024 *CAGR: Compound Annual Growth Rate |
||||||
The market size of plant-based proteins in the UK is projected to grow moderately between 2020 and 2029. By 2024, the total market across retail and foodservice channels is expected to reach 86.9 thousand tons, with a slight growth at a CAGR of 0.7% from 2020 to 2024. Growth is driven mainly by the foodservice sector, which grows at 13.4% CAGR through 2024, reaching 17.3 thousand tons, and a further 3.5% CAGR from 2024 to 2029, totaling 20.5 thousand tons. Retail demand, however, is shrinking slightly, with a negative CAGR of −1.6% from 2020 to 2024, although it is expected to recover by 2.6% CAGR between 2024 and 2029. Key product categories, such as pea protein and soy protein isolate, will see solid growth, particularly in foodservice. Pea protein is expected to grow by 6.4% CAGR and soy protein isolate by 4.7% CAGR from 2024 to 2029.
| Category | Channel | 2020 | 2024 | CAGR* % 2020-2024 | 2025 | 2029 | CAGR* % 2024-2029 |
|---|---|---|---|---|---|---|---|
| Plant-Based Proteins | Retail | 74.1 | 69.6 | −1.6 | 71.1 | 79.2 | 2.6 |
| Foodservice | 10.5 | 17.3 | 13.4 | 17.9 | 20.5 | 3.5 | |
| Total | 84.6 | 86.9 | 0.7 | 89.1 | 99.8 | 2.8 | |
| Gluten | Retail | 21.3 | 19.3 | −2.5 | 19.3 | 19.5 | 0.3 |
| Foodservice | 3.0 | 4.8 | 12.3 | 4.9 | 5.1 | 1.1 | |
| Total | 24.4 | 24.1 | −0.3 | 24.2 | 24.6 | 0.4 | |
| Pea Protein[1] | Retail | 5.4 | 5.5 | 0.6 | 5.7 | 7.2 | 5.5 |
| Foodservice | 0.8 | 1.4 | 15.9 | 1.4 | 1.9 | 6.4 | |
| Total | 6.1 | 6.9 | 2.9 | 7.1 | 9.1 | 5.7 | |
| Soy Protein Concentrate | Retail | 19.4 | 19.1 | −0.4 | 19.4 | 20.6 | 1.6 |
| Foodservice | 2.7 | 4.7 | 14.7 | 4.9 | 5.3 | 2.4 | |
| Total | 22.2 | 23.8 | 1.8 | 24.3 | 26.0 | 1.7 | |
| Soy Protein Isolate | Retail | 4.4 | 4.7 | 1.3 | 4.9 | 5.6 | 3.8 |
| Foodservice | 0.6 | 1.2 | 16.6 | 1.2 | 1.5 | 4.7 | |
| Total | 5.1 | 5.8 | 3.6 | 6.1 | 7.1 | 4.0 | |
| Vegetable Proteins | Retail | 23.6 | 21.1 | −2.7 | 21.8 | 26.3 | 4.5 |
| Foodservice | 3.3 | 5.2 | 12.0 | 5.5 | 6.8 | 5.4 | |
| Total | 26.9 | 26.3 | −0.5 | 27.3 | 33.1 | 4.7 | |
|
Source: Euromonitor International, 2024 *CAGR: Compound Annual Growth Rate 1: Protein derived from pea sources, including but not limited to isolates and concentrates. Please note that if a product listing declares inclusion of "Pea Flour", this will be tracked in "Other Flours", not "Pea Protein". |
|||||||
The market for plant-based protein ingredients in the UK is expected to grow steadily from 2020 to 2029. By 2024, total usage across packaged food products is projected to reach 86.9 thousand tons, reflecting a 0.7% CAGR from 2020. Key growth areas include staple foods, with plant-based proteins anticipated to increase from 53.2 thousand tons in 2020 to 56.2 thousand tons in 2024, driven by a 1.4% CAGR. Pea protein, particularly in staple foods, is forecasted to grow at a 6.7% CAGR, reaching 2.4 thousand tons by 2024, and continue to expand by 5.6% CAGR to 3.1 thousand tons by 2029
| Ingredient | Product | 2020 | 2024 | CAGR* % 2020-2024 | 2025 | 2029 | CAGR* % 2024-2029 |
|---|---|---|---|---|---|---|---|
| Plant-Based Proteins | Snacks | 0.43 | 0.41 | −1.0 | 0.4 | 0.5 | 2.7 |
| Dairy Products and Alternatives | 1.9 | 1.5 | −6.3 | 1.5 | 1.8 | 3.6 | |
| Cooking Ingredients and Meals | 2.0 | 2.1 | 1.4 | 2.2 | 2.5 | 2.9 | |
| Staple Foods | 53.2 | 56.2 | 1.4 | 58.3 | 67.8 | 3.8 | |
| Pet Food | 27.0 | 26.5 | −0.4 | 26.5 | 27.1 | 0.4 | |
| Gluten | Snacks | 0.2 | 0.2 | −1.8 | 0.19 | 0.20 | 0.9 |
| Dairy Products and Alternatives | |||||||
| Cooking Ingredients and Meals | 1.0 | 1.1 | 1.0 | 1.1 | 1.2 | 2.8 | |
| Staple Foods | 11.2 | 10.8 | −0.9 | 10.9 | 11.2 | 0.8 | |
| Pet Food | 11.9 | 12.0 | 0.2 | 12.1 | 12.0 | −0.1 | |
| Pea Protein[1] | Snacks | 0.2 | 0.2 | 0.2 | 0.16 | 0.19 | 4.6 |
| Dairy Products and Alternatives | 0.7 | 0.8 | 2.2 | 0.8 | 0.9 | 2.9 | |
| Staple Foods | 1.8 | 2.4 | 6.7 | 2.5 | 3.1 | 5.6 | |
| Pet Food | 3.4 | 3.6 | 1.0 | 3.6 | 4.8 | 6.4 | |
| Soy Protein Concentrate | Snacks | 0.041 | 0.039 | −1.0 | 0.04 | 0.04 | 2.3 |
| Dairy Products and Alternatives | 0.9 | 0.3 | −23.9 | 0.30 | 0.30 | −0.2 | |
| Cooking Ingredients and Meals | 0.8 | 0.9 | 2.5 | 0.9 | 1.1 | 3.2 | |
| Staple Foods | 9.0 | 11.9 | 7.1 | 12.4 | 14.5 | 4.1 | |
| Pet Food | 11.4 | 10.7 | −1.5 | 10.6 | 10.1 | −1.3 | |
| Soy Protein Isolate | Dairy Products and Alternatives | 0.2 | 0.3 | 5.1 | 0.3 | 0.4 | 7.5 |
| Staple Foods | 4.6 | 5.3 | 3.6 | 5.6 | 6.4 | 3.9 | |
| Pet Food | 0.2 | 0.2 | 0.7 | 0.21 | 0.23 | 1.8 | |
| Vegetable Proteins | Snacks | 0.031 | 0.029 | −1.3 | 0.03 | 0.04 | 4.6 |
| Dairy Products and Alternatives | 0.08 | 0.11 | 9.2 | 0.12 | 0.15 | 6.2 | |
| Cooking Ingredients and Meals | 0.20 | 0.19 | −0.8 | 0.20 | 0.21 | 1.9 | |
| Staple Foods | 26.5 | 25.9 | −0.6 | 26.8 | 32.5 | 4.7 | |
|
Source: Euromonitor International, 2024 *CAGR: Compound Annual Growth Rate 1: Protein derived from pea sources, including but not limited to isolates and concentrates. Please note that if a product listing declares inclusion of "Pea Flour", this will be tracked in "Other Flours", not "Pea Protein". |
|||||||
Competitive landscape
Between 2019 and 2023, the UK's plant-based food and beverage market experienced notable growth, with varying degrees of expansion across different categories.
Nestlé SA emerged as the dominant player in the plant-based hot drinks category, capturing a 75% market share by 2023, while the overall category grew significantly, achieving a CAGR of 68.2%.
In the plant-based soft drinks sector, Starbucks Corp led the market with a 30% share, although competition remained strong with companies like Barr (AG) Plc and Britvic Plc also holding substantial shares. The whole category expanded steadily, reaching US$115.9 million in 2023, with notable growth from brands such as Califia Farms LP and Coca-Cola Co., which achieved impressive CAGRs of 71.2% and 82.1%, respectively.
In the pant-based snacks category, Unilever Group and Lotus Bakeries NV dominated, with nearly equal market shares of 25% and 24.6%. This category grew to US$109.4 million in 2023, driven by a CAGR of 29.3%, with smaller players like Candy Kittens Ltd also showing rapid growth.
The plant-based dairy products and alternatives market was led by Danone, Groupe, which held a commanding 42.2% share, followed by Upfield Holdings BV and Cereal Base CEBA AB. The category reached a total value of US$813 million, supported by a CAGR of 12.4%.
In the plant-based cooking ingredients and meals sector, Unilever Group again took the lead with a 22% market share, driven by a CAGR of 46.6% over the period. Despite a slight decline in sales for Kraft Heinz Co from 2022 to 2023, the overall market reached US$155.3 million in 2023.
Lastly, in the plant-based staple foods category, Hain Celestial Group Inc held the largest share at 22.3%, followed by Beyond Meat Inc and JBS SA. Although the category experienced slower growth with a CAGR of 20.6%, it remained a significant segment of the market, valued at US$176.5 million in 2023.
| Category | Company | 2019 | 2020 | 2021 | 2022 | 2023 | CAGR* % 2019-2023 | Market share % in 2023 |
|---|---|---|---|---|---|---|---|---|
| Plant-based Hot Drinks | Nestlé SA | 0.0 | 0.0 | 0.4 | 0.6 | 0.6 | N/C | 75.0 |
| Hotel Chocolat Ltd | 0.1 | 0.1 | 0.1 | 0.1 | 0.1 | 0.0 | 12.5 | |
| Others | 0.2 | 0.3 | 0.1 | 0.1 | N/C | 12.5 | ||
| Total | 0.1 | 0.3 | 0.8 | 0.8 | 0.8 | 68.2 | 100.0 | |
| Plant-based Soft Drinks | Starbucks Corp | 7.6 | 22.7 | 34.8 | 39.4 | 34.8 | 46.3 | 30.0 |
| Barr (AG) Plc | 17.0 | 21.3 | 30.1 | 29.1 | 28.7 | 14.0 | 24.8 | |
| Britvic Plc | 7.2 | 9.3 | 16.0 | 13.9 | 15.2 | 20.5 | 13.1 | |
| Basecamp Brews Ltd | 5.8 | 6.1 | 7.4 | 12.1 | 12.4 | 20.9 | 10.7 | |
| Califia Farms LP | 1.0 | 1.6 | 2.7 | 6.3 | 8.6 | 71.2 | 7.4 | |
| Coca-Cola Co, The | 0.6 | 5.5 | 6.9 | 6.0 | 6.6 | 82.1 | 5.7 | |
| Nexba Beverages Pty Ltd | 0.2 | 0.2 | 1.6 | 1.6 | N/C | 1.4 | ||
| Huel Ltd | 0.1 | 0.1 | 0.1 | 0.8 | 0.9 | 73.2 | 0.8 | |
| AG Barr PLC | 0.4 | 0.5 | 0.5 | 0.7 | 0.8 | 18.9 | 0.7 | |
| Danone, Groupe | 1.3 | 1.2 | 1.3 | 0.5 | 0.5 | −21.2 | 0.4 | |
| Others | 0.3 | 1.8 | 2.1 | 2.8 | 5.8 | 109.7 | 5.0 | |
| Total | 41.3 | 70.3 | 102.1 | 113.2 | 115.9 | 29.4 | 100.0 | |
| Plant-based Snacks | Unilever Group | 5.8 | 7.3 | 21.7 | 21.3 | 27.4 | 47.4 | 25.0 |
| Lotus Bakeries NV | 12.4 | 19.7 | 22.0 | 24.1 | 26.9 | 21.4 | 24.6 | |
| Nairn's Oatcakes Ltd | 8.7 | 10.5 | 12.6 | 12.3 | 14.0 | 12.6 | 12.8 | |
| Ecotone | 1.4 | 2.8 | 3.8 | 4.3 | N/C | 3.9 | ||
| Candy Kittens Ltd | 0.5 | 1.5 | 1.9 | 2.9 | 2.9 | 55.2 | 2.7 | |
| Zertus GmbH | 2.5 | N/C | 2.3 | |||||
| Cereal Base CEBA AB | 1.5 | 3.0 | 4.4 | 4.0 | 2.3 | 11.3 | 2.1 | |
| Mae Deli Ltd, The | 0.6 | 0.9 | 1.5 | 1.9 | 2.0 | 35.1 | 1.8 | |
| Froneri Ltd | 0.9 | 2.9 | 3.0 | 1.1 | N/C | 1.0 | ||
| Mood Foods Ltd | 0.1 | 0.3 | 0.6 | 0.6 | 1.1 | 82.1 | 1.0 | |
| Private Label | 0.3 | 0.3 | 0.9 | 0.8 | 0.8 | 27.8 | 0.7 | |
| Others | 9.2 | 17.0 | 20.5 | 20.8 | 24.1 | 27.2 | 22.0 | |
| Total | 39.1 | 62.8 | 91.8 | 95.5 | 109.4 | 29.3 | 100.0 | |
| Plant-based Dairy Products and Alternatives | Danone, Groupe | 271.8 | 321.6 | 356.5 | 313.6 | 343.3 | 6.0 | 42.2 |
| Upfield Holdings BV | 156.1 | 156.4 | 182.5 | 195.8 | 222.7 | 9.3 | 27.4 | |
| Cereal Base CEBA AB | 60.6 | 116.6 | 168.9 | 157.2 | 185.2 | 32.2 | 22.8 | |
| Coconut Collaborative Ltd | 6.6 | 15.3 | 21.2 | N/C | 2.6 | |||
| Saputo Inc | 8.8 | 12.2 | 13.5 | 13.4 | 14.7 | 13.7 | 1.8 | |
| Others | 12.5 | 20.7 | 23.6 | 19.6 | 25.9 | 20.0 | 3.2 | |
| Total | 509.8 | 627.5 | 751.6 | 714.9 | 813.0 | 12.4 | 100.0 | |
| Plant-based Cooking Ingredients and Meals | Unilever Group | 7.4 | 15.4 | 25.6 | 25.6 | 34.2 | 46.6 | 22.0 |
| Kraft Heinz Co | 6.3 | 20.5 | 34.5 | 27.4 | N/C | 17.6 | ||
| Hain Celestial Group Inc, The | 4.9 | 8.4 | 11.9 | 11.6 | 12.1 | 25.4 | 7.8 | |
| Samworth Bros Ltd | 3.2 | 4.3 | 8.7 | 11.5 | 10.2 | 33.6 | 6.6 | |
| SHS Group | 6.8 | 10.9 | 13.4 | 11.4 | 9.5 | 8.7 | 6.1 | |
| Powder Bowl Trading Ltd | 3.9 | 5.8 | 8.1 | 7.9 | 8.4 | 21.1 | 5.4 | |
| Tideford Organic Foods Ltd | 1.3 | 3.0 | 4.2 | 4.8 | 5.1 | 40.7 | 3.3 | |
| Gosh! Food Ltd | 1.7 | 1.5 | 1.3 | 1.6 | 4.0 | 23.9 | 2.6 | |
| Mitsubishi Corp | 2.9 | 3.5 | 3.3 | N/C | 2.1 | |||
| Premier Foods Plc | 2.5 | 3.6 | 2.8 | 2.8 | N/C | 1.8 | ||
| Private Label | 0.0 | 0.1 | 0.1 | 0.3 | 0.4 | N/C | 0.3 | |
| Others | 18.0 | 33.5 | 43.7 | 43.4 | 37.9 | 20.5 | 24.4 | |
| Total | 47.2 | 91.7 | 144.0 | 158.9 | 155.3 | 34.7 | 100.0 | |
| Plant-based Staple Foods | Hain Celestial Group Inc, The | 28.3 | 52.8 | 63.7 | 45.3 | 39.4 | 8.6 | 22.3 |
| Beyond Meat Inc | 2.7 | 8.2 | 17.1 | 18.2 | 20.6 | 66.2 | 11.7 | |
| JBS SA | 17.8 | 24.7 | 27.9 | 20.4 | 18.2 | 0.6 | 10.3 | |
| Monde Nissin Corp | 9.8 | 16.0 | 19.0 | 16.4 | 16.9 | 14.6 | 9.6 | |
| Plant Meat Ltd | 3.8 | 11.7 | 13.2 | 12.8 | N/C | 7.3 | ||
| Mae Deli Ltd, The | 3.9 | 5.4 | 7.0 | 7.5 | 8.7 | 22.2 | 4.9 | |
| PepsiCo Inc | 4.4 | 6.3 | 5.9 | 6.4 | 7.2 | 13.1 | 4.1 | |
| Unilever Group | 4.8 | 10.0 | 7.1 | 6.8 | N/C | 3.9 | ||
| Handy Food Innovation Ltd | 2.4 | 5.0 | 4.6 | 6.0 | N/C | 3.4 | ||
| Sonae SGPS SA | 5.0 | 6.6 | 4.4 | 5.3 | N/C | 3.0 | ||
| Private Label | 1.7 | 4.5 | 5.5 | 5.5 | 5.0 | 31.0 | 2.8 | |
| Others | 14.8 | 31.1 | 40.9 | 37.9 | 29.6 | 18.9 | 16.8 | |
| Total | 83.4 | 165.0 | 220.3 | 186.9 | 176.5 | 20.6 | 100.0 | |
|
Source: Euromonitor International, 2024 *CAGR: Compound Annual Growth Rate N/C: Not calculable |
||||||||
New product launch analysis
The UK's health and wellness industry has gained prominence, particularly post-pandemic, as consumers become more aware of the negative health impacts of processed foods and drinks. Additionally, there is growing concern about the environmental impact of food production, driving consumers towards sustainable choices like plant-based diets (Euromonitor International, 2024).
Between 2019 and 2023, the UK saw a significant rise in plant-based food and drink product launches, with the yearly count increasing from 338 in 2019 to 670 in 2023, reflecting growing consumer interest. Key brands like M&S Food Plant Kitchen and Alpro maintained a steady presence, while newer brands like Plants by Deliciously Ella surged by 2023. Marks & Spencer and Asda/Walmart consistently ranked among the top companies, with the majority of launches priced between US$0.31 and US$17.30. The dominant launch type was new variety/range extensions, which nearly doubled from 2019 to 2023. Ingredient claims such as "natural" and "vegetable-based" saw consistent growth, while categories like meat substitutes and prepared meals remained popular throughout the period.
| Product attributes | Yearly launch count | ||||
|---|---|---|---|---|---|
| 2019 | 2020 | 2021 | 2022 | 2023 | |
| Yearly product launches | 338 | 408 | 509 | 579 | 670 |
| Top five brands | |||||
| M&S Food Plant Kitchen | 21 | 26 | 20 | 17 | 23 |
| Asda Plant Based | 0 | 42 | 15 | 10 | 1 |
| Alpro | 11 | 8 | 17 | 8 | 5 |
| Plants by Deliciously Ella | 0 | 0 | 0 | 0 | 38 |
| Deliciously Ella | 1 | 5 | 10 | 8 | 14 |
| Top five companies | |||||
| Marks & Spencer | 29 | 26 | 22 | 29 | 30 |
| Walmart | 0 | 44 | 17 | 12 | 37 |
| Asda | 0 | 44 | 17 | 12 | 37 |
| Groupe Danone | 18 | 18 | 21 | 16 | 12 |
| WhiteWave Foods | 18 | 16 | 21 | 16 | 7 |
| Top three price groups (US dollars) | |||||
| 0.31 - 17.30 | 317 | 375 | 482 | 541 | 640 |
| 17.31 - 34.30 | 10 | 22 | 18 | 18 | 19 |
| 34.31 - 51.30 | 6 | 10 | 8 | 13 | 5 |
| Top three launch types | |||||
| New Variety/Range Extension | 119 | 115 | 206 | 238 | 261 |
| New Product | 148 | 190 | 175 | 199 | 212 |
| New Packaging | 54 | 60 | 84 | 83 | 136 |
| Relaunch | 16 | 40 | 40 | 54 | 55 |
| New Formulation | 1 | 3 | 4 | 5 | 6 |
| Top five ingredient claims | |||||
| Natural | 135 | 139 | 175 | 207 | 236 |
| Vegetable Based | 46 | 88 | 63 | 93 | 103 |
| Coconut Oil Derived | 48 | 65 | 85 | 81 | 103 |
| Organic | 66 | 50 | 63 | 47 | 50 |
| Gluten-Free | 21 | 42 | 47 | 54 | 66 |
| Top five categories | |||||
| Meat Substitutes | 57 | 59 | 67 | 65 | 74 |
| Plant Based Drinks (Dairy Alternatives) | 30 | 23 | 31 | 50 | 32 |
| Nutritional & Meal Replacement Drinks | 22 | 31 | 38 | 39 | 35 |
| Snack/Cereal/Energy Bars | 36 | 46 | 27 | 16 | 38 |
| Prepared Meals | 19 | 37 | 27 | 42 | 37 |
| Source: Mintel GNPD, 2024 | |||||
Examples of new products
Pasta al Pesto
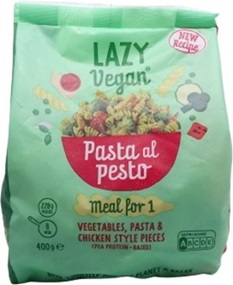
Source: Mintel Global New Products Database, 2024
| Company | Lazy Vegan |
|---|---|
| Brand | Lazy Vegan |
| Category | Prepared meals |
| Store name | Ocado |
| Store type | Internet / mail order |
| Date published | December 2023 |
| Launch type | Relaunch |
| Price in US dollars | 4.39 |
Lazy Vegan Pasta al Pesto has been relaunched with a new recipe and packaging, and retails in a 400 gram pack. - Meal for one- Vegetable pasta and chicken style pieces pea-protein based - 228 grams veggies - Ready in eight minutes - Scores an A on the Nutri-Score - Give oneself and the planet a break - A creamy vegan Italian pasta al pesto loaded with fresh vegetables, basil, garlic, vegan cheese, fusilli pasta and chicken style pieces - Plant-based - 100% natural ingredients - 228 grams vegetables and peas - 20 grams of protein - Free from gluten, wheat, milk, lactose, soy, nut and additives - Suitable for vegans, vegetarians and coeliacs- Nothing but good stuff - Lazy Vegan makes eating vegan food as easy and healthy as possible - If all eat more plant-based food, it is good for the planet, good for the animals, and good for health - Mixed vegetables and legumes with pea protein-based pieces, cooked gluten-free pasta and Italian seasoning - Frozen - Can be heated in a frying pan or microwaved - Recyclable pack - Logos and certifications: TikTok, Facebook, Instagram, Certified B Corporation, International Vegan V-Label
Original Plant-Based Kebab
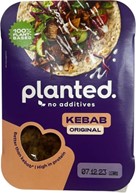
Source: Mintel Global New Products Database, 2024
| Company | Planted foods |
|---|---|
| Brand | Planted. |
| Category | Meat substitutes |
| Location of manufacture | Switzerland |
| Import status | Imported product |
| Store name | tesco (online) |
| Store type | Internet / mail order |
| Date published | December 2023 |
| Launch type | New variety / range extension |
| Price in US dollars | 3.15 |
Planted. Original Plant-Based Kebab is now available, and retails in a 160 gram pack. - 100% plant-based - No additives - Better than kebab as it is made with 78% less CO2 and 85% less water - High in protein - Plant-based food made from pea protein with 17% marinade - Tastes delicious in a wrap, or served with crispy fried potatoes and fresh vegetables- Made from peas - Recyclable pack containing a tray made of mono-PP and can be recycled- Preparation instructions - Logos and certifications: Certified B Corporation, International Vegan V-Label, QR code, FSC Mix, TikTok, Instagram, Facebook
Plant-Based Burger
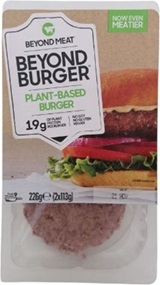
Source: Mintel Global New Products Database, 2024
| Company | The New Plant |
|---|---|
| Brand | Beyond Meat Beyond Burger |
| Category | Meat substitutes |
| Store name | Sainsbury's |
| Store type | Supermarket |
| Date published | December 2022 |
| Launch type | Relaunch |
| Price in US dollars | 4.30 |
Beyond Meat Beyond Burger Plant-Based Burger has been relaunched with a new brand name, previously known as Beyond Meat The Beyond Burger, a new meatier formula and retails in a 226 gram pack containing two 113 gram units. - 19 grams of plant protein per burger - No soy or gluten - Vegan - Cooks in nine minutes - Made from plants - Plant-based burger made with pea protein, defrosted - Partly recyclable pack - Logos and certifications: Vegetarian Society Approved Vegetarian Trademark, Kosher, Halal, Facebook, Twitter, Instagram, Pinterest, YouTube
Dark Chocolate & Salted Caramel Mousse
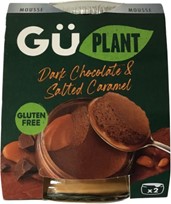
Source: Mintel Global New Products Database, 2024
| Company | Gü |
|---|---|
| Brand | Gü Plant |
| Category | Desserts and ice cream |
| Store name | Asda |
| Store type | Mass merchandise / hypermarket |
| Date published | December 2023 |
| Launch type | Relaunch |
| Price in US dollars | 5.01 |
Gü Plant Dark Chocolate & Salted Caramel Mousse has been relaunched with a new brand name, previously known as Gü Free From, and with a new look, and retails in a 140 gram pack containing two 70 gram pots. - Gluten-free - Vegan chocolate mousses with salted caramel - 100% recyclable packaging - Logos and certifications: Vegan Society Approved Vegan Trademark, Instagram, Twitter, Facebook
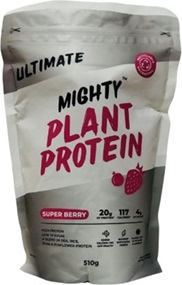
Super Berry Plant Protein
Source: Mintel Global New Products Database, 2024
| Company | Mighty Drinks |
|---|---|
| Brand | Ultimate Mighty |
| Category | Nutritional and meal replacement drinks |
| Store name | Sainsbury's |
| Store type | Supermarket |
| Date published | December 2023 |
| Launch type | Relaunch |
| Price in US dollars | 23.46 |
Ultimate Mighty Super Berry Plant Protein has been relaunched with a new brand name, previously Mighty Human, and retails in a 510 gram pack. - High protein- Low in sugar - A blend of pea, rice, faba and sunflower protein- 20 grams of protein - 117 calories - 4 grams of BCAAs - Added calcium for gut health - Blended with super greens - Packed with 16 vitamins and minerals - Recyclable pack - Vitamin C, vitamin B6, pantothenic acid and niacin contribute to the reduction of tiredness and fatigue - Vitamin K contributes to the maintenance of normal bones - Riboflavin, zinc and vitamin A contribute to the maintenance of normal skin and vision - Loaded with four plant-based proteins, added super greens and 4 grams of BCAAa, this protein powder contains plenty of nutrients and is high in protein - Contains under 120 calories - Added fibre and calcium keeps the gut happy - No nasties- Food supplement with sweeteners - Logos and certifications: Instagram, Facebook, Twitter
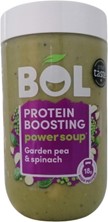
Protein Boosting Garden Pea & Spinach Power Soup
Source: Mintel Global New Products Database, 2024
| Company | BOL |
|---|---|
| Brand | BOL |
| Category | Soup |
| Store name | Tesco Extra |
| Store type | Mass merchandise / hypermarket |
| Date published | December 2023 |
| Launch type | New packaging |
| Price in US dollars | 4.19 |
BOL Protein Boosting Garden Pea & Spinach Power Soup has been repackaged with a new look, and retails in a 600 gram pack. - 18 grams high protein - 100% plant based - High in protein which contributes to a growth in muscle mass and the maintenance of normal bones - Garden pea and spinach soup with cannellini beans and courgette - Microwaveable - Dairy and gluten free- Recyclable, upcycle and re-usable pack - Contains two serves - Made in small batches in the UK - High in 19 grams fibre - Three of five a day - All taste, no waste - Traffic light nutritional label - Logos and certifications: QR code, Certified B Corporation, Instagram, Twitter, Facebook, Vegetarian Society Vegan Approved, Great Taste 2022 one star
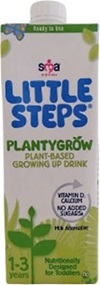
Plantygrow Plant-Based Growing Up Drink
Source: Mintel Global New Products Database, 2024
| Company | SMA Nutrition |
|---|---|
| Brand | SMA Nutrition Little Steps |
| Category | Baby food |
| Store name | Ocado |
| Store type | Internet / mail order |
| Date published | November 2023 |
| Launch type | New packaging |
| Price in US dollars | 4.79 |
SMA Nutrition Little Steps Plantygrow Plant-Based Growing Up Drink has been repackaged with a new look, and now retails in a redesigned 1 litre pack. - Ready to use - Vitamin D, calcium - No added sugars - Milk alternative - Nutritionally designed for toddlers - One to three years - Super easy to enjoy - Use in the toddler's favourite breakfast - Make yummy smoothies and shakes- Nutritionally designed for toddlers one to three years - Made with wheat, oat, barley, rye, corn and pea - Good source of vitamins A, C, B2 and B12, and iron- Enriched with omega-3, omega-6 and iodine, to help support normal growth - With calcium and vitamin D to help support normal growth and development of bones - UHT - Produced in Europe - Fortified, mixed cereal and pea protein based drink for young children from one year onwards - Suitable for vegetarians - Recyclable pack - Logos and certifications: FSC Mix, Facebook
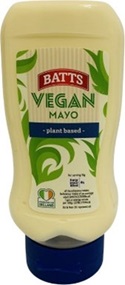
Vegan Mayo
Source: Mintel Global New Products Database, 2024
| Company | Lidl |
|---|---|
| Brand | Batts |
| Category | Sauces and seasonings |
| Location of manufacture | Ireland |
| Import status | Imported product |
| Store name | Lidl |
| Store type | Supermarket |
| Date published | January 2023 |
| Launch type | New variety / range extension |
| Price in US dollars | 2.41 |
Batts Vegan Mayo is now available, and retails in a 405 gram pack. - Plant based - Gluten free - Rapeseed oil from the EU and non-EU- Suitable for vegetarians and vegans - Recyclable pack
For more information
The Canadian Trade Commissioner Service:
International Trade Commissioners can provide Canadian industry with on-the-ground expertise regarding market potential, current conditions and local business contacts, and are an excellent point of contact for export advice.
More agri-food market intelligence:
International agri-food market intelligence
Discover global agriculture and food opportunities, the complete library of Global Analysis reports, market trends and forecasts, and information on Canada's free trade agreements.
Agri-food market intelligence service
Canadian agri-food and seafood businesses can take advantage of a customized service of reports and analysis, and join our email subscription service to have the latest reports delivered directly to their inbox.
More on Canada's agriculture and agri-food sectors:
Canada's agriculture sectors
Information on the agriculture industry by sector. Data on international markets. Initiatives to support awareness of the industry in Canada. How the department engages with the industry.
For additional information on the SIAL Paris 2024, please contact:
Ben Berry, Deputy Director
Trade Show Strategy and Delivery
Agriculture and agri-food Canada
ben.berry@agr.gc.ca
Resources
- Claire Hamlett, July 2024: UK Meat Production Falls For First Time In Years
- Euromonitor International, Data statistics, 2024
- Euromonitor International, August 2024: Health and Wellness in the United Kingdom
- Euromonitor International, August 2024: HW Snacks in the United Kingdom
- Euromonitor International, August 2024: HW Dairy Products and Alternatives in the United Kingdom
- Euromonitor International, August 2024: HW Cooking Ingredients and Meals in the United Kingdom
- Euromonitor International, August 2024: HW Staple Foods in the United Kingdom
- Euromonitor International, August 2024: HW Hot Drinks in the United Kingdom
- Euromonitor International, January 2024: New Frontiers in Healthy Food and Beverages
- Euromonitor International, May 2023: Consumer Lifestyles in the UK
- Government of Canada, 2024: Canada's Protein Industries Cluster
- Global Trade Tracker, 2024
- Grand View Research, March 2024: Pulse Ingredients Market Size, Share & Growth Report, 2024-2030
- Mintel Global New Products Database, 2024
- Mintel, 2023: Patent insights: alternative proteins for the future
- Protein Industries Canada,2024: New partnership will advance development of pea and fava protein ingredients and food products
- Protein Industries Canada,2024: Improving Canadian plant-based ingredients, food and co-products
- Protein Industries Canada,2024: New alternative protein options for health-conscious markets
- Protein Industries Canada,2024: Canadian innovation taking plant-protein nutrition to new heights
- Protein Industries Canada,2024: New partnership will lead to development of Canadian protein ingredients focused on functionality and taste
- Protein Industries Canada,2024: Developing innovative Canadian ingredients for new snack and food options
- Jordi Casamitjana, August 2024: Research Finds 49% of the UK Plant-Based People Identify as Male
- Vegconomist, August 2024: Pulses Continue to Race Around the World, LDC's New Business Unit is Latest Move to Increase Global Supplies
Sector Trend Analysis – Plant-based pulse ingredients in the United Kingdom
Global Analysis Report
Prepared by: Zhi Duo Wang, Market Analyst
© His Majesty the King in Right of Canada, represented by the Minister of Agriculture and Agri-Food (2025).
Photo credits
All photographs reproduced in this publication are used by permission of the rights holders.
All images, unless otherwise noted, are copyright His Majesty the King in Right of Canada.
To join our distribution list or to suggest additional report topics or markets, please contact:
Agriculture and Agri-Food Canada, Global Analysis1341 Baseline Rd, Tower 5, 3rd floor
Ottawa ON K1A 0C5
Canada
Email: aafc.mas-sam.aac@agr.gc.ca
The Government of Canada has prepared this report based on primary and secondary sources of information. Although every effort has been made to ensure that the information is accurate, Agriculture and Agri-Food Canada (AAFC) assumes no liability for any actions taken based on the information contained herein.
Reproduction or redistribution of this document, in whole or in part, must include acknowledgement of agriculture and agri-food Canada as the owner of the copyright in the document, through a reference citing AAFC, the title of the document and the year. Where the reproduction or redistribution includes data from this document, it must also include an acknowledgement of the specific data source(s), as noted in this document.
Agriculture and Agri-Food Canada provides this document and other report services to agriculture and food industry clients free of charge.